Copyright
©The Author(s) 2022.
World J Gastroenterol. Jul 14, 2022; 28(26): 3201-3217
Published online Jul 14, 2022. doi: 10.3748/wjg.v28.i26.3201
Published online Jul 14, 2022. doi: 10.3748/wjg.v28.i26.3201
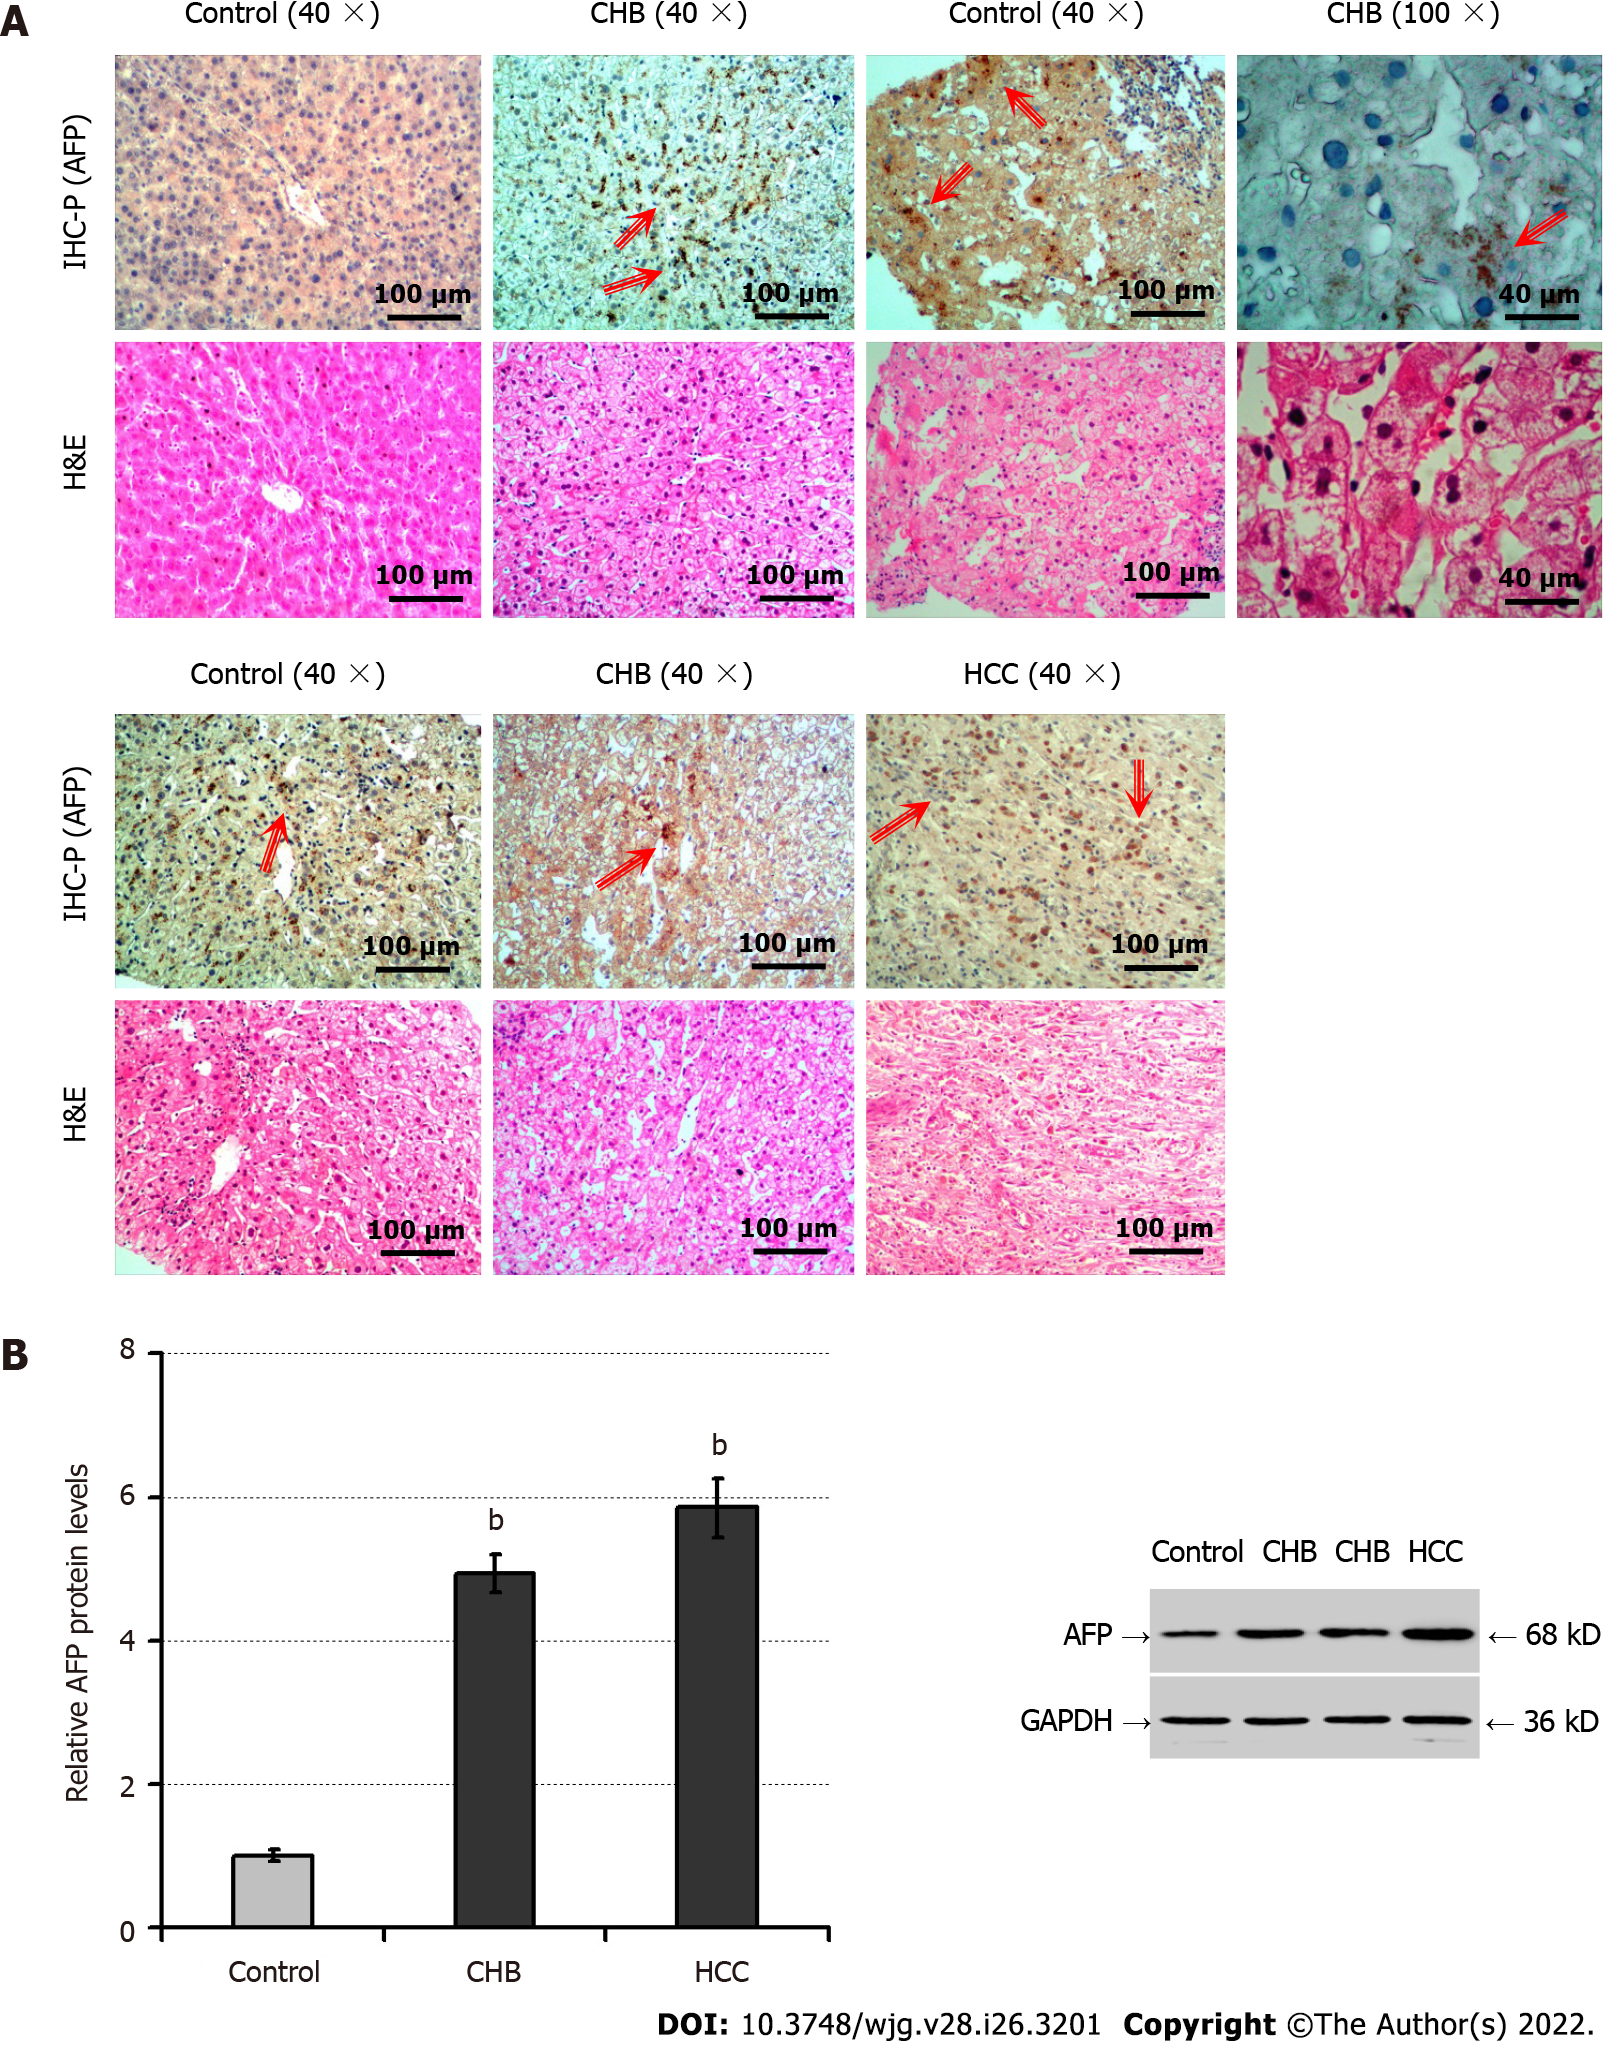
Figure 1 The intrahepatic levels of alpha-fetoprotein protein are elevated in injured livers.
A: Immunohistochemistry and hematoxylin and eosin (H&E) staining analyzed alpha-fetoprotein (AFP) expression and pathological changes, respectively, in liver tissues of patients with chronic hepatitis B (CHB, n = 34), trauma (n = 8) or hepatocellular carcinoma (HCC, the positive control group, n = 8). The upper panels display immunohistochemical staining, and the lower panels exhibit H&E staining in sequential tissue sections. The positive expression of AFP was stained with brownish yellow by immunohistochemistry and indicated by the arrows; B: The relative levels of AFP protein expression were analyzed by Western blot in the liver specimens indicated. H&E: Hematoxylin and eosin; IHC-P: Immunohistochemistry-paraffin; AFP: Alpha-fetoprotein; HCC: Hepatocellular carcinoma; CHB: Chronic hepatitis B. bP < 0.01, compared with the control group.
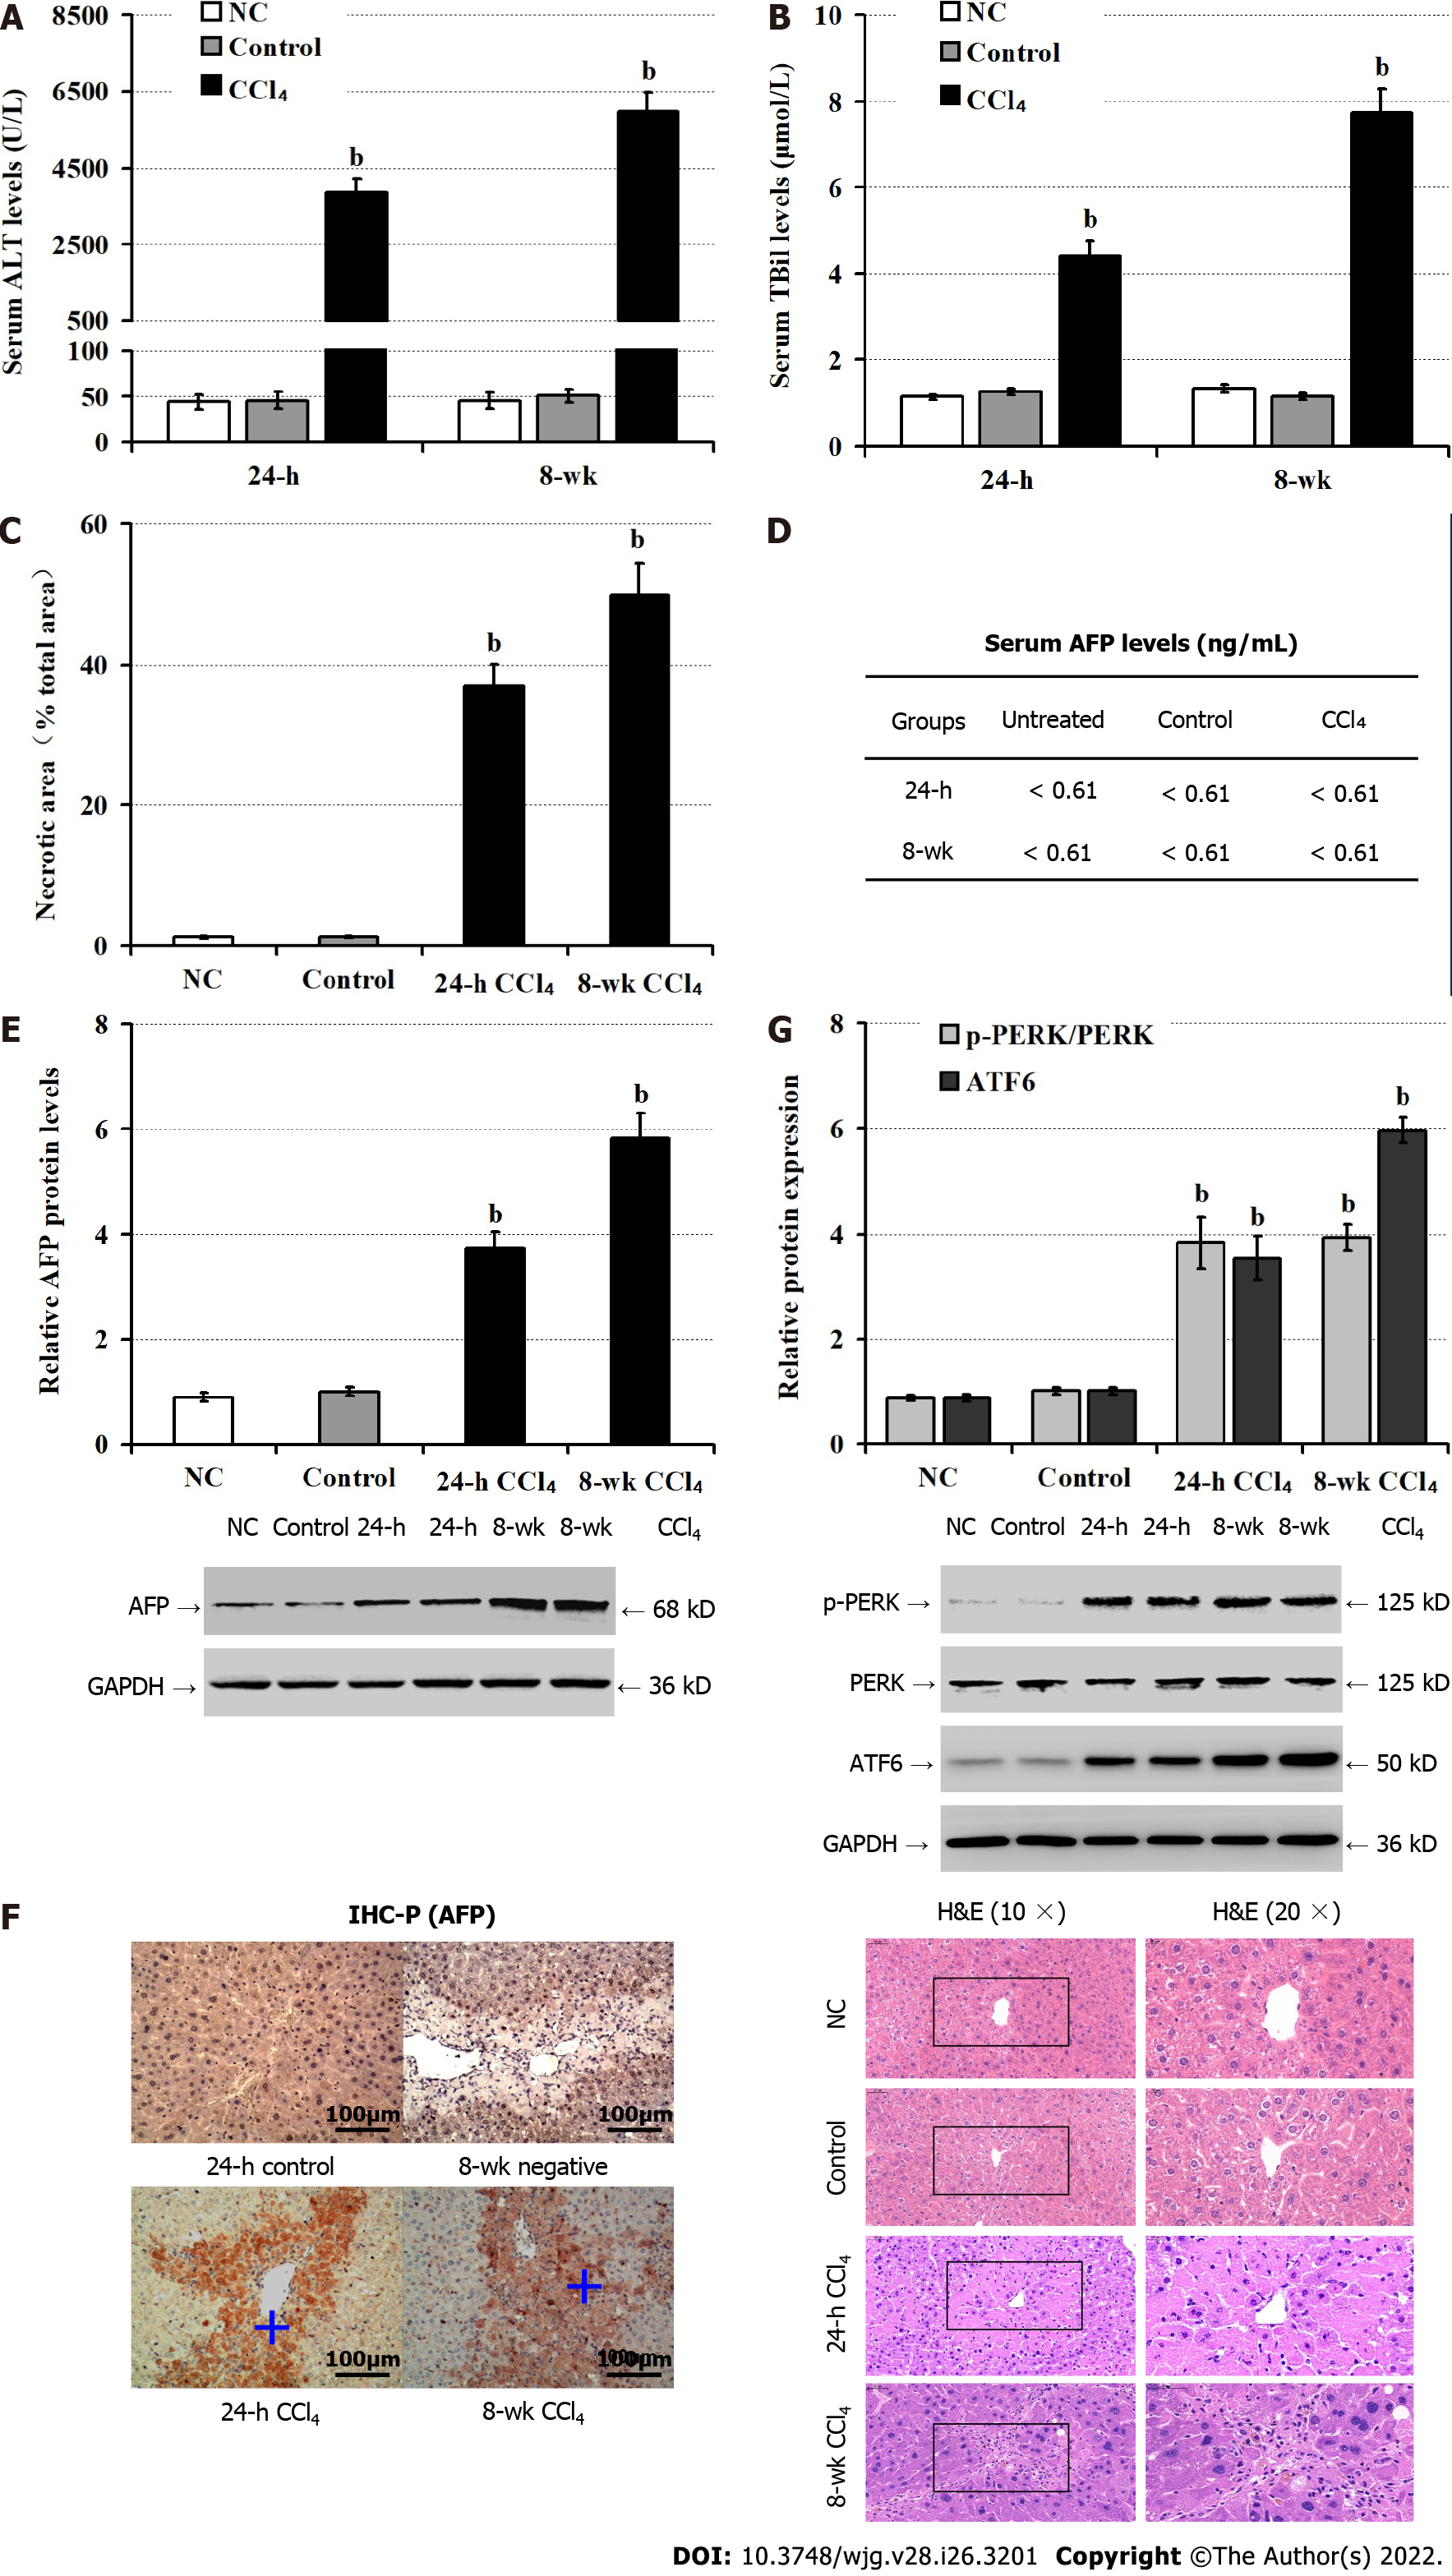
Figure 2 Administration with carbon tetrachloride induces alpha-fetoprotein expression, endoplasmic reticulum stress and liver injury in mice.
Male BALB/c mice were untreated (NC), or administrated with olive oil (control) or carbon tetrachloride (CCl4) for 24 h, or 8 wk. A: Serum alanine aminotransferase levels; B: Serum total bilirubin levels; C: Hematoxylin and eosin staining analysis of pathological changes in mouse liver tissues at 24-h and 8-wk post CCl4; D: Chemiluminescence immunoassay of serum alpha-fetoprotein (AFP) levels; E: Western blot analysis of the relative levels of AFP expression in liver tissues of mice; F: Immunohistochemical staining of AFP expression in liver tissue of mice at 24-h post CCl4, the positive expression of AFP was stained with brownish yellow and indicated by a plus sign; G: Western blot analysis of the relative levels of protein kinase R-like endoplasmic reticulum kinase phosphorylation and activating transcription factor-6 expression in liver tissues of mice. AFP: Alpha-fetoprotein; ALT: Alanine aminotransferase; ATF6: Activating transcription factor-6; CCl4: Carbon tetrachloride; H&E: Hematoxylin and eosin; PERK: Protein kinase R-like endoplasmic reticulum kinase; TBil: Total bilirubin. bP < 0.01 compared with the control group.
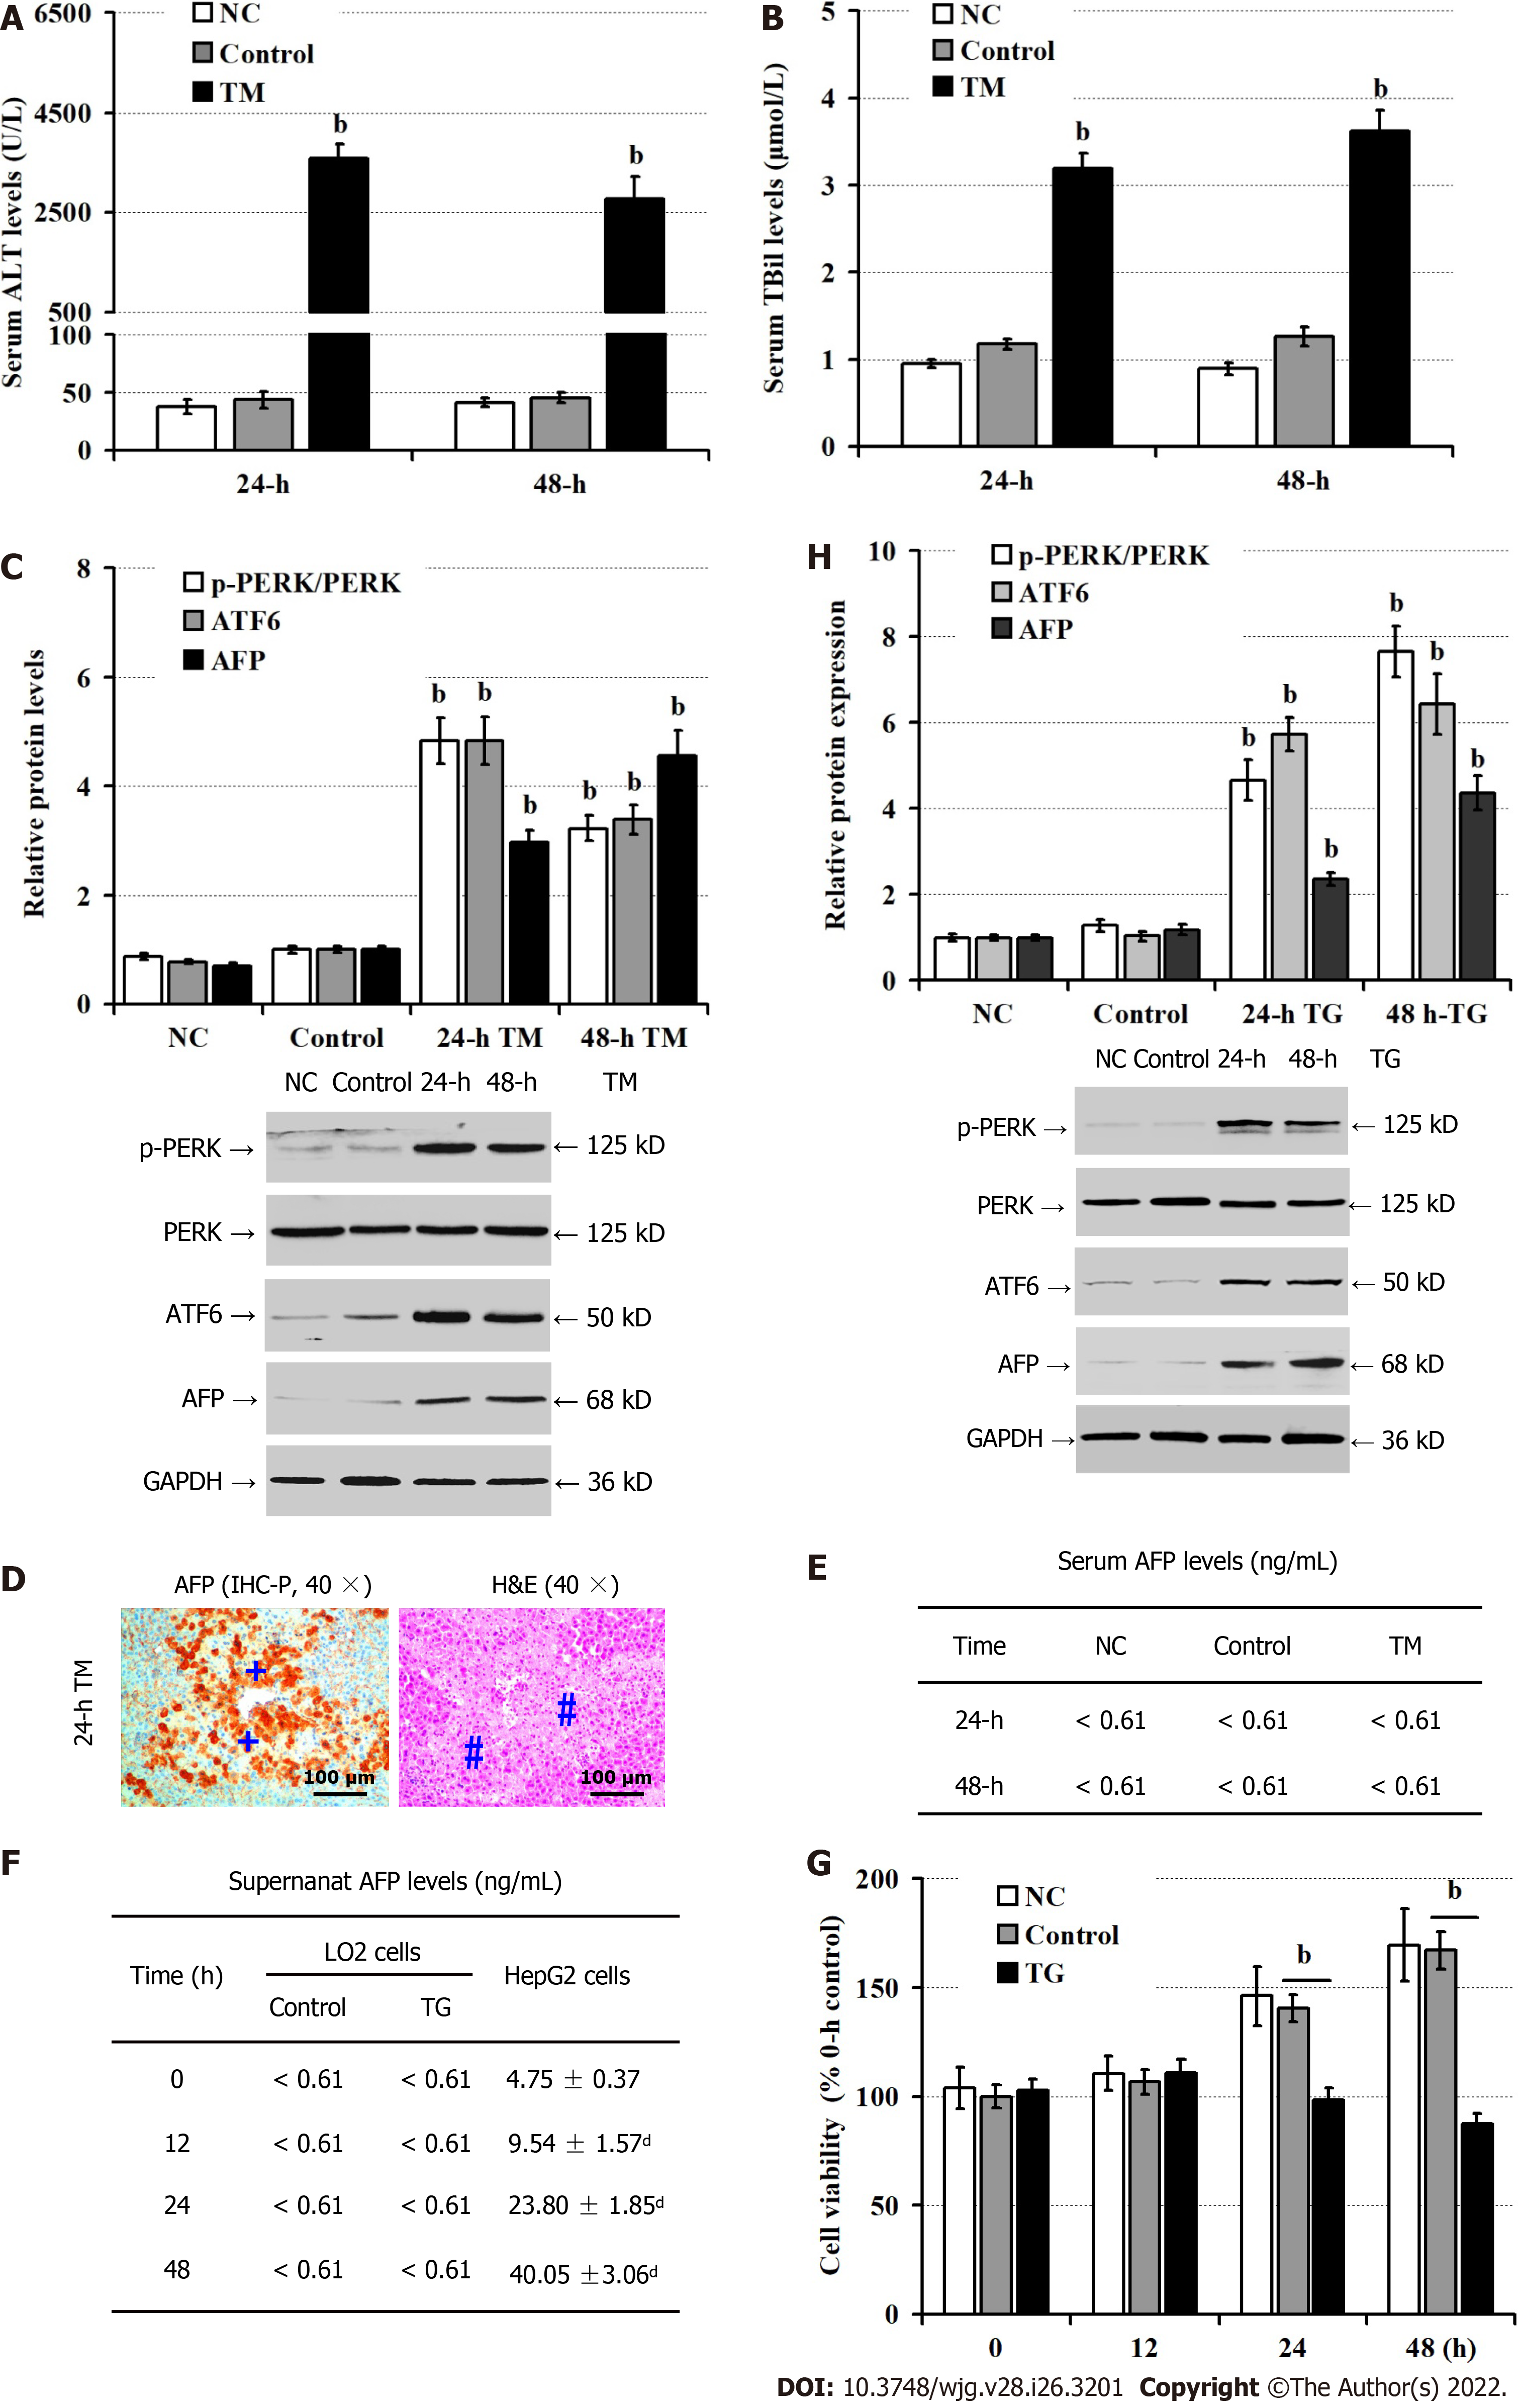
Figure 3 Endoplasmic reticulum stress up-regulates alpha-fetoprotein expression in hepatocytes.
Male BALB/c mice were untreated (NC), or treated with phosphate buffer saline (control) or TM for 24 h or 48 h. LO2 cells were untreated (NC), or treated with dimethyl sulfoxide (control) or thapsigargin (TG) for 24 h, and 48 h. A: Serum alanine aminotransferase levels; B: Serum total bilirubin levels; C: Western blot analysis of the relative levels of proteins; D: Immunohistochemical analysis of alpha-fetoprotein (AFP) expression and hematoxylin and eosin staining analysis of liver injury in mice at 24 h post endoplasmic reticulum stress. The positive expression of AFP was stained with brownish yellow and indicated by a plus sign. Hash sign indicates the area of necrosis; E: Chemiluminescence immunoassay of serum AFP levels in mice; F: The levels of AFP in the supernatants of cultured cells; G: Cell counting kit-8 analysis of the cell viability; H: Western blot analysis of the relative levels of p-protein kinase R-like endoplasmic reticulum kinase, ATF6 and AFP expression in LO2 cells. AFP: Alpha-fetoprotein; ALT: Alanine aminotransferase; ATF6: Activating transcription factor-6; CCl4: Carbon tetrachloride; CCK-8: Cell counting kit-8; DMSO: Dimethyl sulfoxide; H&E: Hematoxylin and eosin; IHC-P: Immunohistochemistry-paraffin; PBS: Phosphate buffer saline; p-PERK: Phosphorylated protein kinase R-like endoplasmic reticulum kinase; TBil: Total Bilirubin; TM: Tunicamycin; TG: Thapsigargin. bP < 0.01, compared with the control group; dP < 0.01, compared with the 0 h group in HepG2 cells.
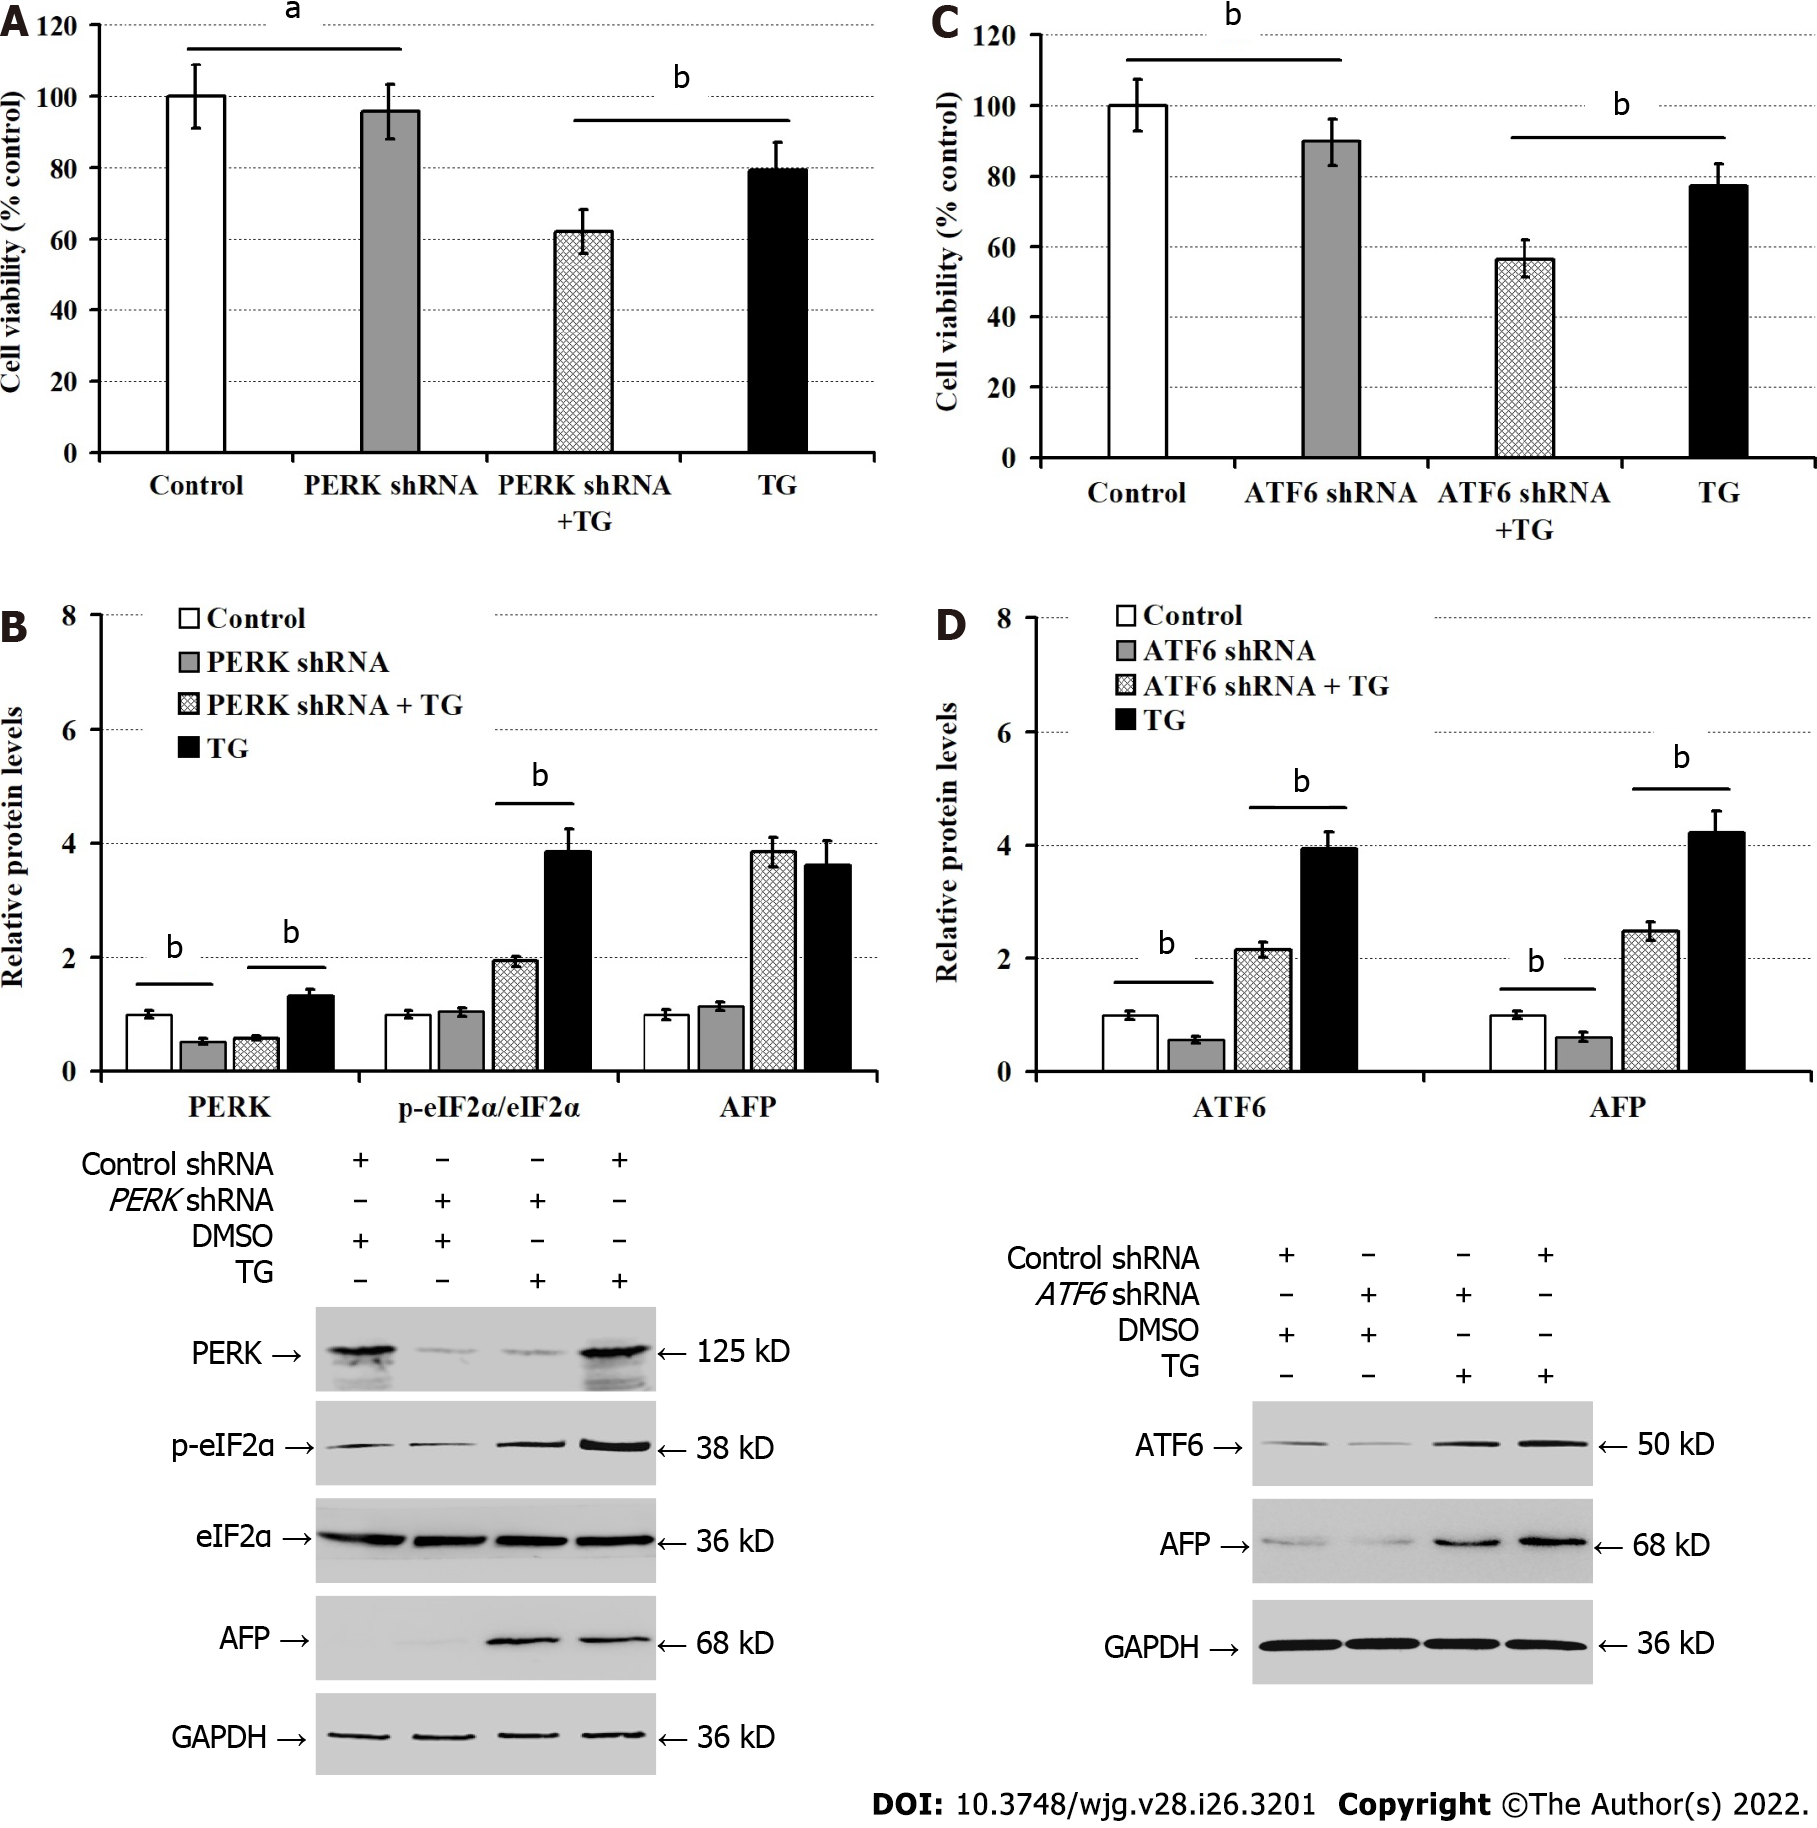
Figure 4 Activating transcription factor-6 silencing inhibits the expression of alpha-fetoprotein induced by thapsigargin invitro.
LO2 cells were transfected with control shRNA, protein kinase R-like endoplasmic reticulum kinase (PERK)-shRNA, or activating transcription factor-6 (ATF6)-shRNA for 48 h, and treated with dimethyl sulfoxide (control) or thapsigargin for 24 h. A: Cell counting kit-8 (CCK-8) analysis of cell viability; B: Western blot analysis of p-PERK, phosphorylated eukaryotic translational initiation factor 2 alpha, and alpha-fetoprotein expression; C: CCK-8 analysis of cell viability; D: Western blot analysis of the relative levels of ATF6 and AFP protein expression. AFP: Alpha-fetoprotein; ATF6: Activating transcription factor-6; CCK-8: Cell counting kit-8; DMSO: Dimethyl sulfoxide; p-eIF2α: Phosphorylated eukaryotic translational initiation factor 2 alpha; p-PERK: Phosphorylated protein kinase R-like endoplasmic reticulum kinase; TG: Thapsigargin. aP < 0.05, bP < 0.01, compared with these two groups.
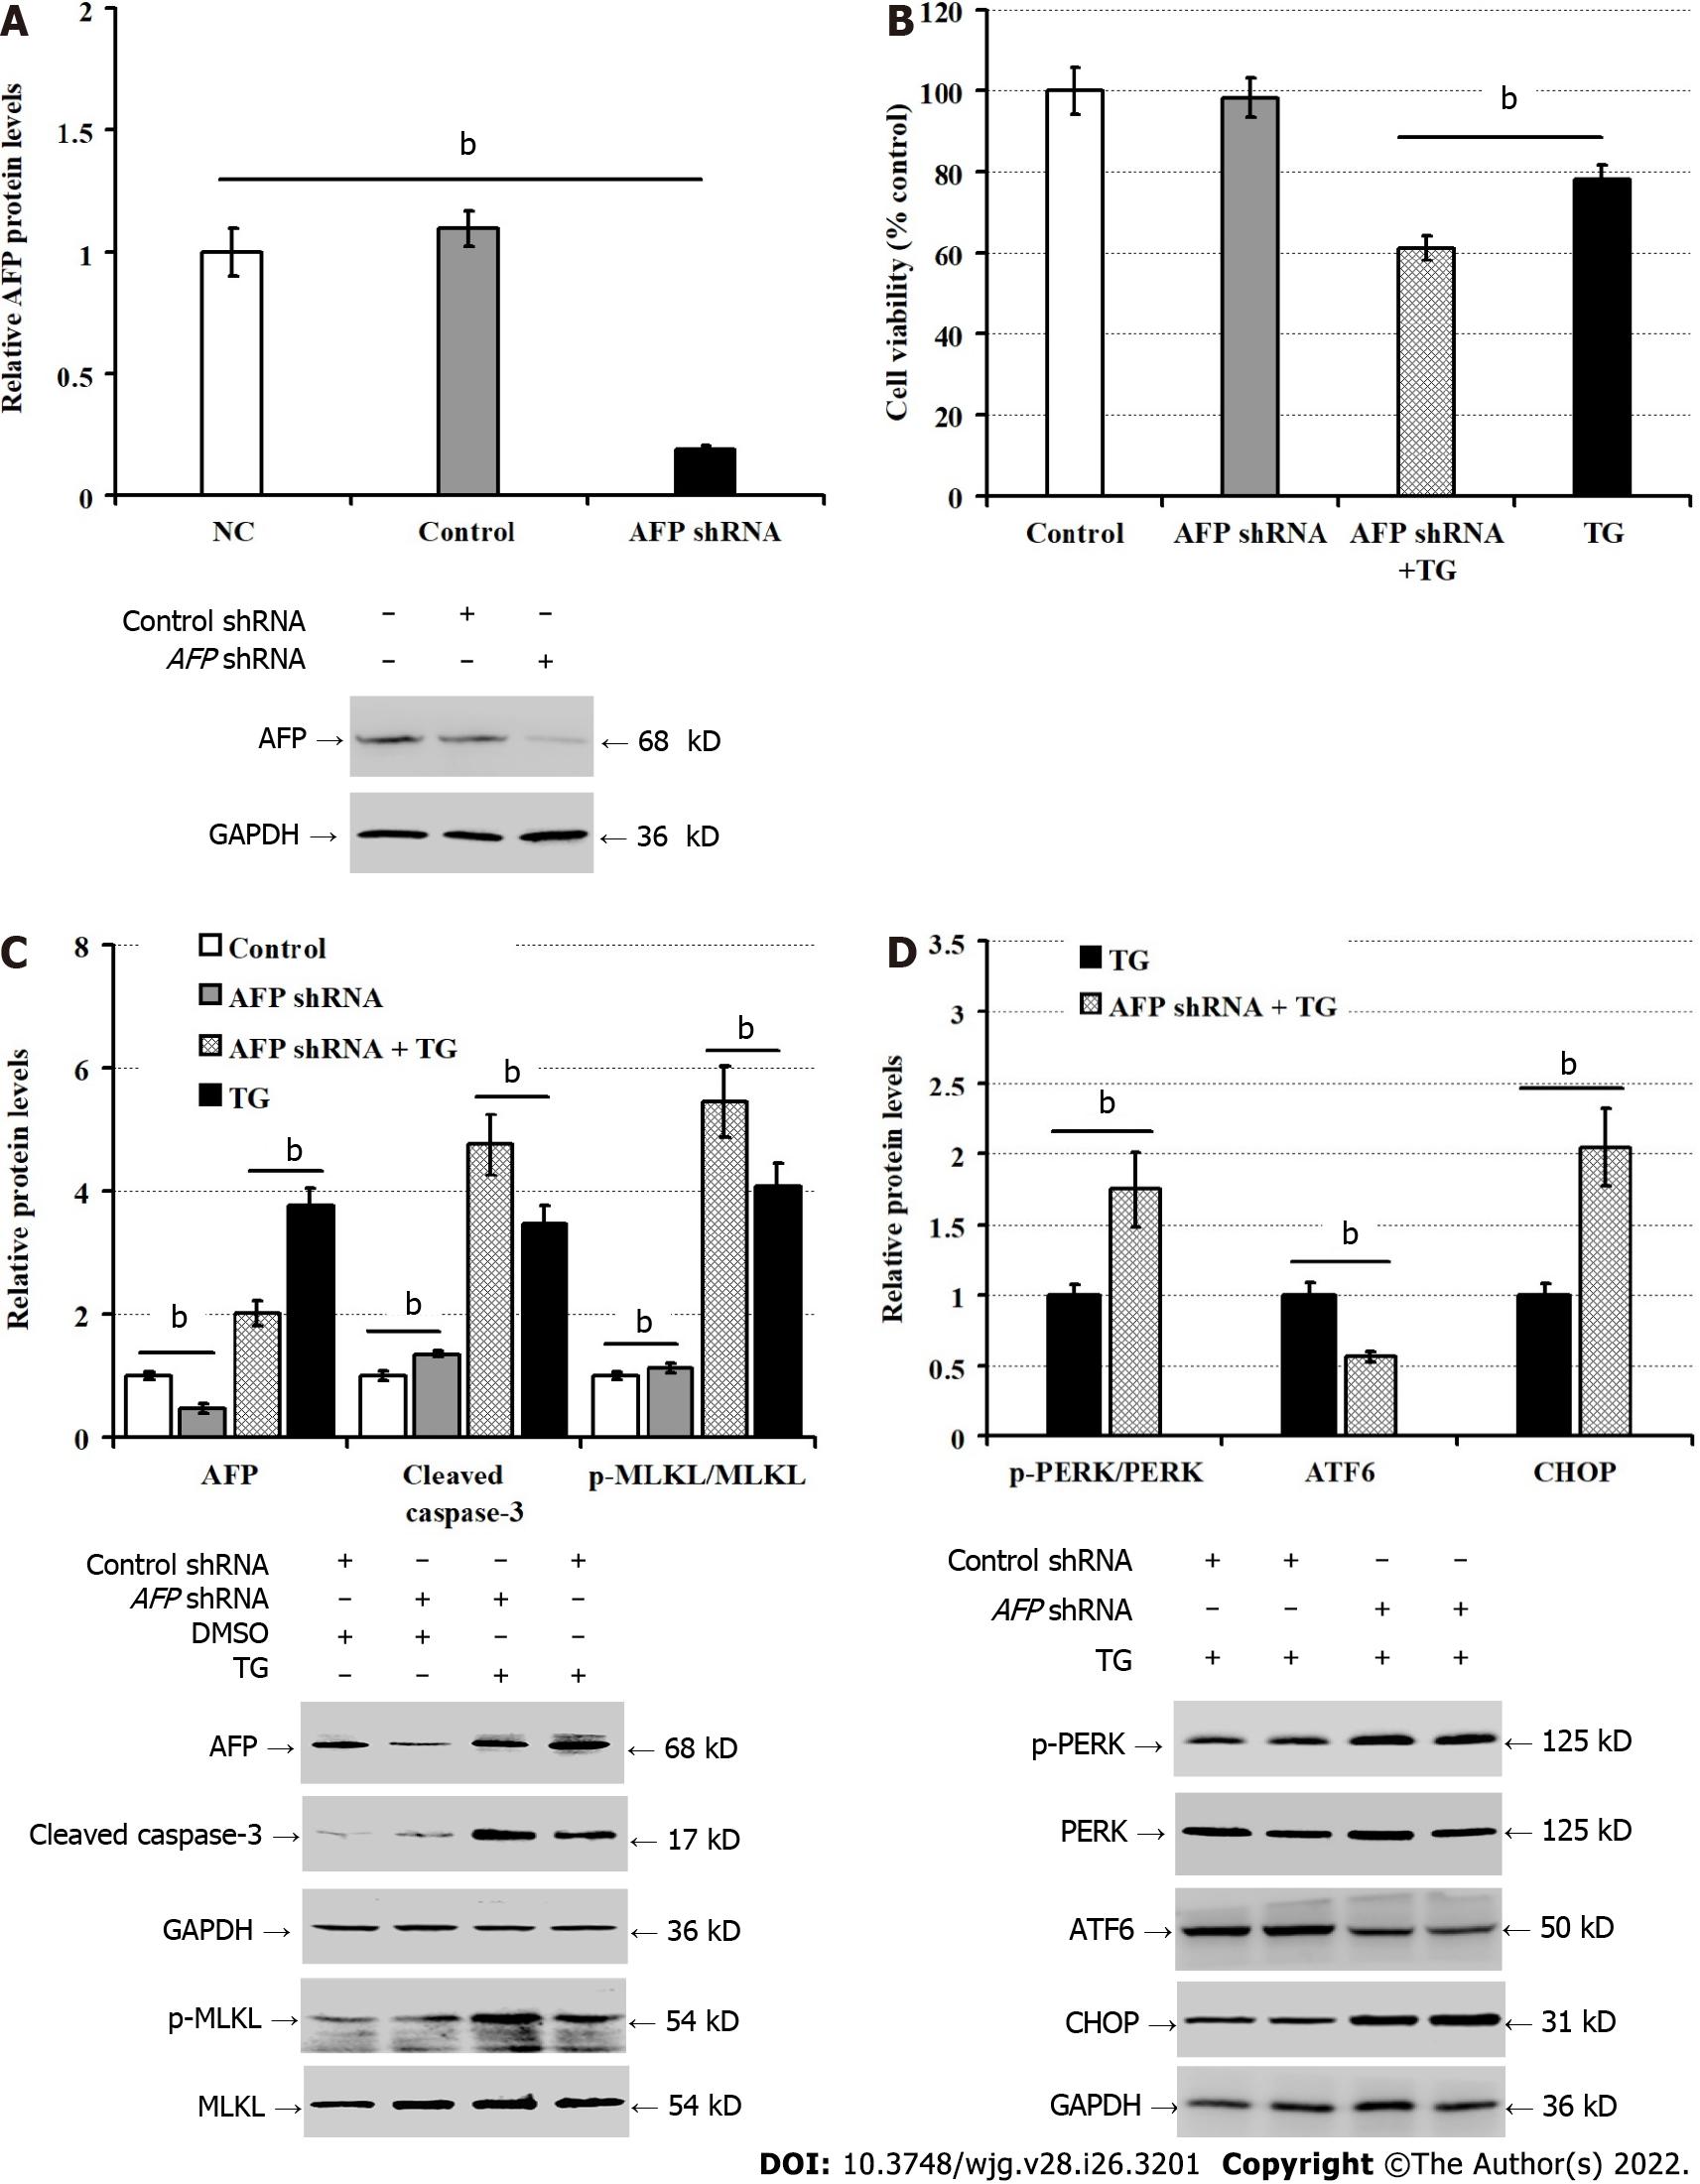
Figure 5 Silencing of alpha-fetoprotein exacerbates the thapsigargin-induced LO2 cell injury.
A: Western blot determined alpha-fetoprotein silencing in LO2 cells; B: Cell counting kit-8 analysis of LO2 cell viability; C: Western blot for the relative levels of indicated protein expression in LO2 cells; D: Western blot for the relative levels of endoplasmic reticulum stress-related protein. AFP: Alpha-fetoprotein; CCK-8: Cell counting kit-8; ER: Endoplasmic reticulum; TG: Thapsigargin; p-MLKL: Phosphorylated mixed lineage kinase domain-like pseudokinase; p-PERK: Phosphorylated protein kinase R-like endoplasmic reticulum kinase. Data are typical images or expressed as the mean ± SD of each group from 3 separate experiments. bP < 0.01 compared with these two groups.
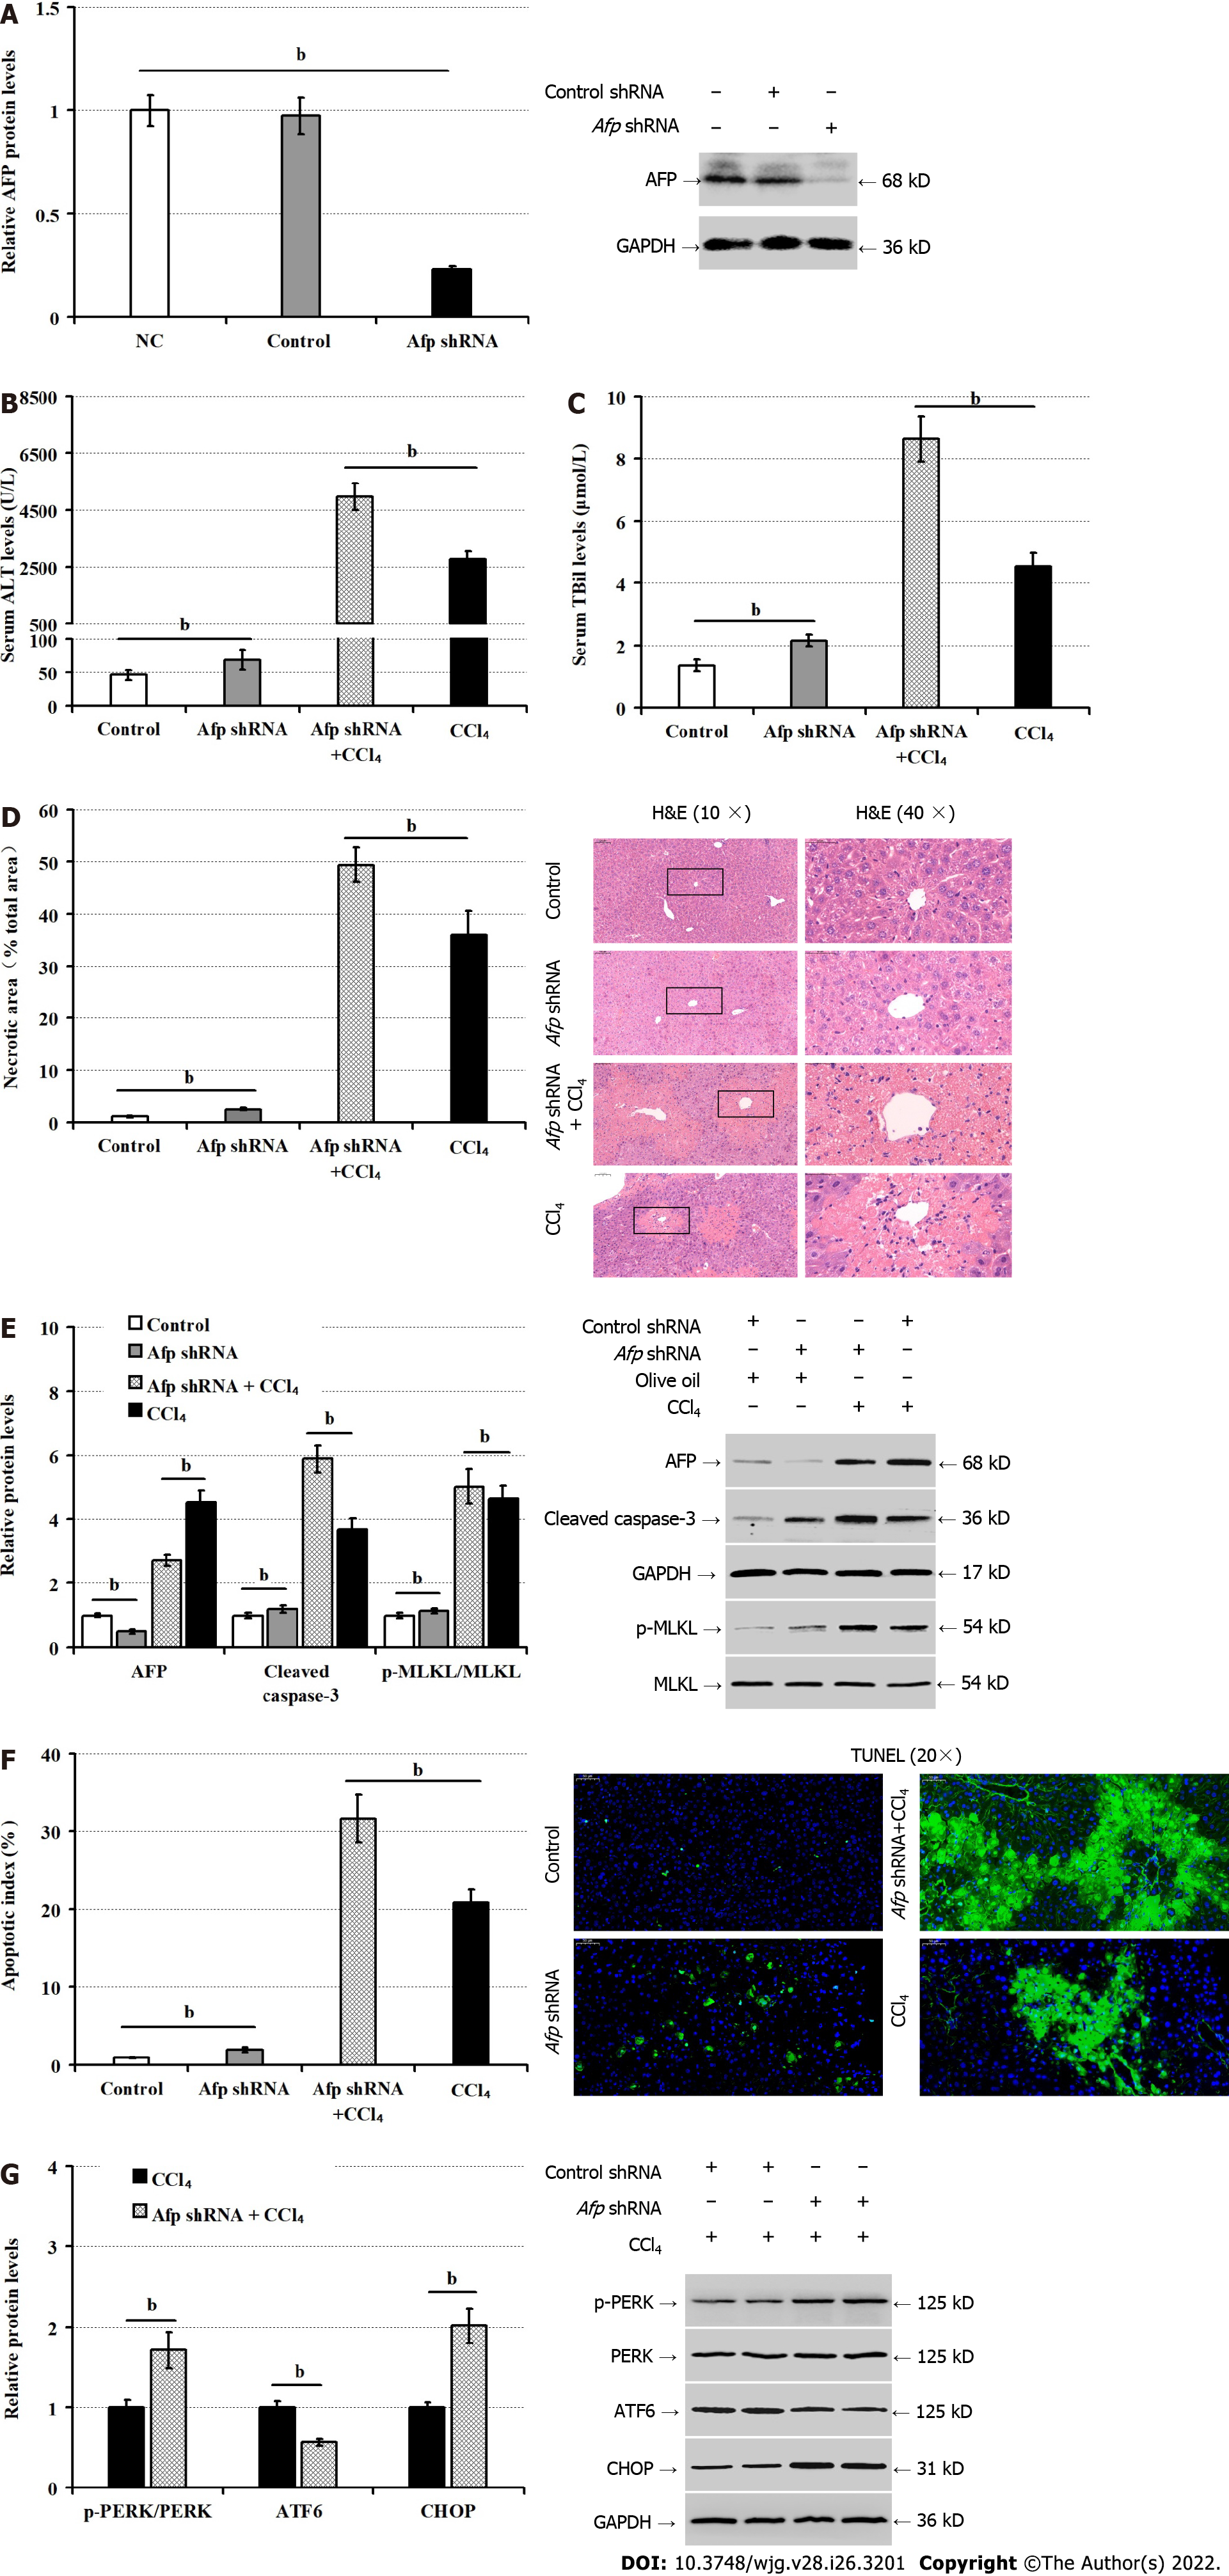
Figure 6 Silencing of alpha-fetoprotein increases liver injury in mice following CCl4 administration.
A: Western blot for the protein levels of alpha-fetoprotein (AFP) in the liver tissues of mice; B: Serum alanine aminotransferase levels; C: Serum levels of total bilirubin; D: Liver sections stained by hematoxylin and eosin and measurements of necrotic areas in mice; E: Western blot for the relative levels of AFP, cleaved caspase-3, and phosphorylated mixed lineage kinase domain-like pseudokinase expression in the liver tissues; F: TUNEL analysis of hepatocyte apoptosis; G: The relative levels of phosphorylated protein kinase R-like ER kinase, activating transcription factor-6 and C/enhancer binding protein homologous protein protein in liver tissues. AFP: Alpha-fetoprotein; ALT: Alanine aminotransferase; ATF6: Activating transcription factor-6; CCl4: Carbon tetrachloride; CHOP: C/enhancer binding protein homologous protein; H&E: Hematoxylin and eosin; p-MLKL: Phosphorylated mixed lineage kinase domain-like pseudokinase; p-PERK: Phosphorylated protein kinase R-like ER kinase; TBil: Total bilirubin; TUNEL: Terminal deoxynucleotidyl transferase-mediated dUTP nick end labeling. bP < 0.01 compared with these two groups.
- Citation: Chen YF, Liu SY, Cheng QJ, Wang YJ, Chen S, Zhou YY, Liu X, Jiang ZG, Zhong WW, He YH. Intracellular alpha-fetoprotein mitigates hepatocyte apoptosis and necroptosis by inhibiting endoplasmic reticulum stress. World J Gastroenterol 2022; 28(26): 3201-3217
- URL: https://www.wjgnet.com/1007-9327/full/v28/i26/3201.htm
- DOI: https://dx.doi.org/10.3748/wjg.v28.i26.3201


