Copyright
©The Author(s) 2022.
World J Gastroenterol. Jul 14, 2022; 28(26): 3150-3163
Published online Jul 14, 2022. doi: 10.3748/wjg.v28.i26.3150
Published online Jul 14, 2022. doi: 10.3748/wjg.v28.i26.3150
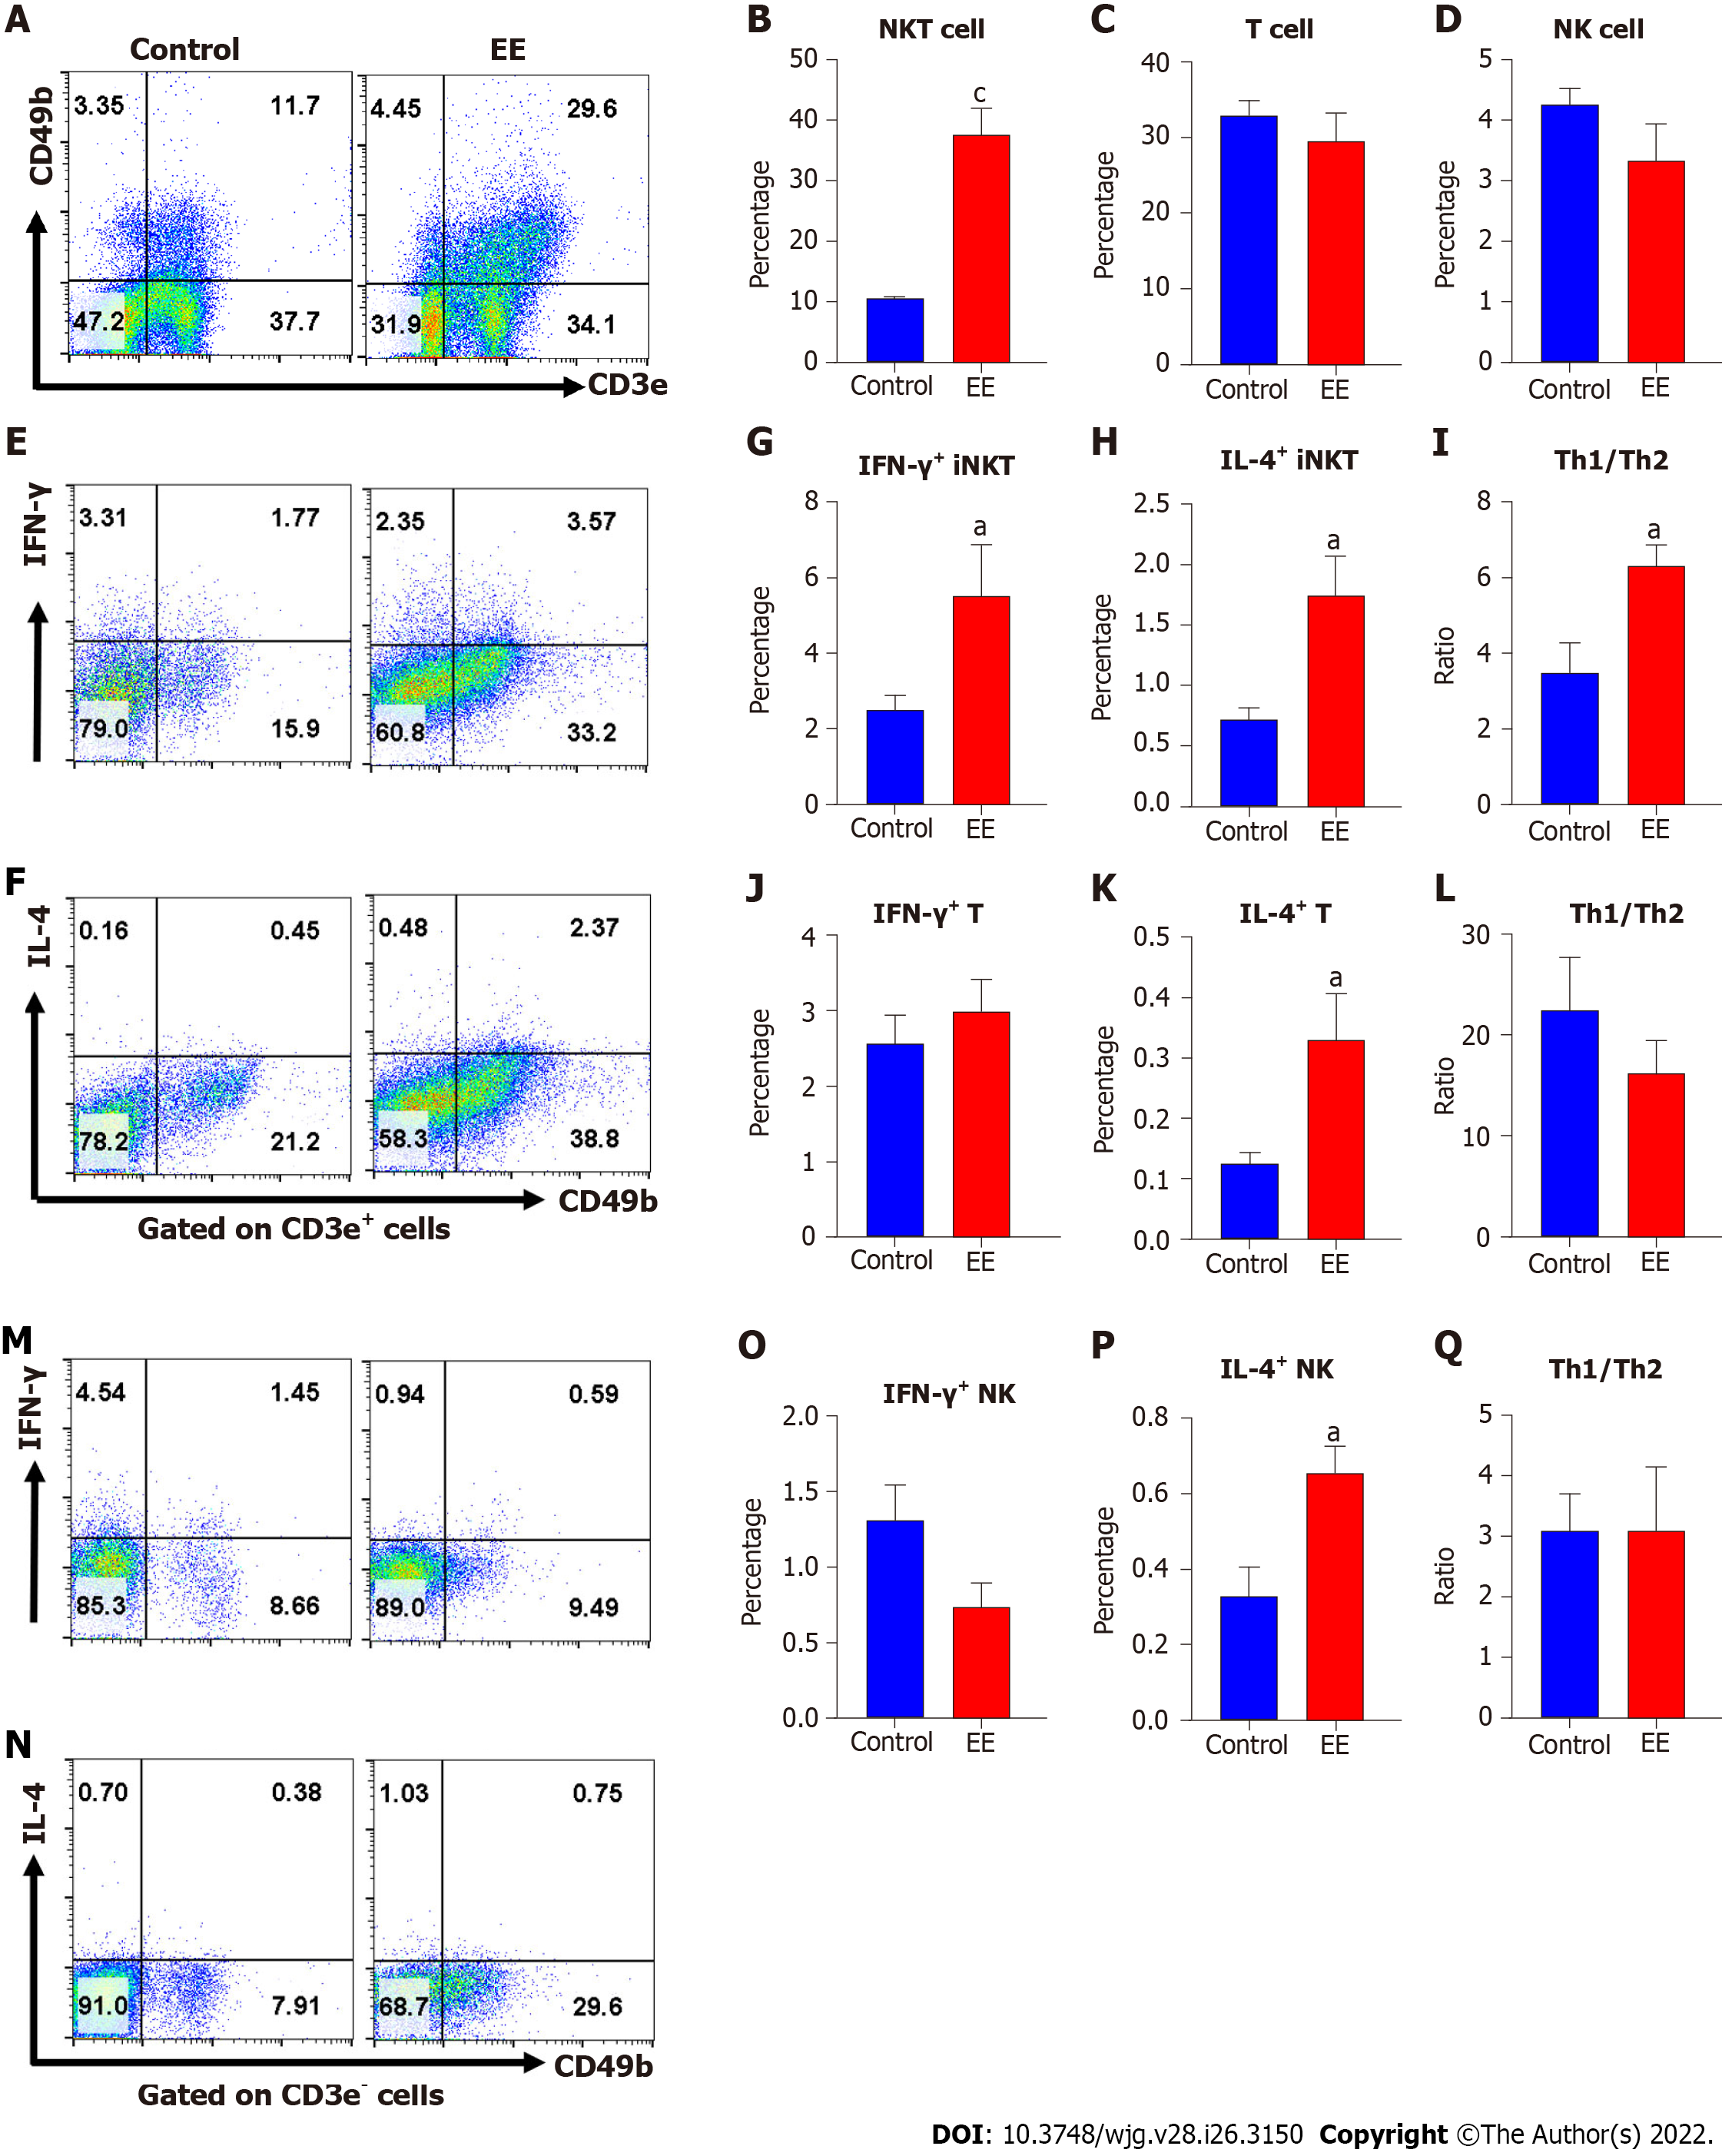
Figure 1 Ethinylestradiol promotes hepatic natural killer T cell proliferation along with biased Th1 cytokine production.
A: The percentage of hepatic natural killer T (NKT) cells, T cells and NK cells were detected and defined as CD3e+CD49b+ (upper right), CD3e+CD49b- (lower right), CD3e-CD49b+ (upper left), respectively; B: Proportion analysis and comparison of NKT cells; C: Proportion analysis and comparison of T cells; D: Proportion analysis and comparison of NK cells; E and F: Th1 cytokine (IFN-γ) (E) and Th2 cytokine (IL-4) (F) produced by NKT cells and T cells were detected, respectively; G: IFN-γ produced by NKT cells; H: IL-4 produced by NKT cells; I: The ratio of Th1/Th2 by NKT cells; J: IFN-γ produced by T cells; K: IL-4 produced by T cells; L: The ratio of Th1/Th2 by T cells; M and N: Th1 cytokine (IFN-γ) (M) and Th2 cytokine (IL-4) (N) produced by NK cells were detected; O: IFN-γ produced by NK cells; P: IL-4 produced by NK cells; Q: The ratio of Th1/Th2 by NK cells. All values are the means ± SE (n = 4-6). aP < 0.05, cP < 0.001 vs control.
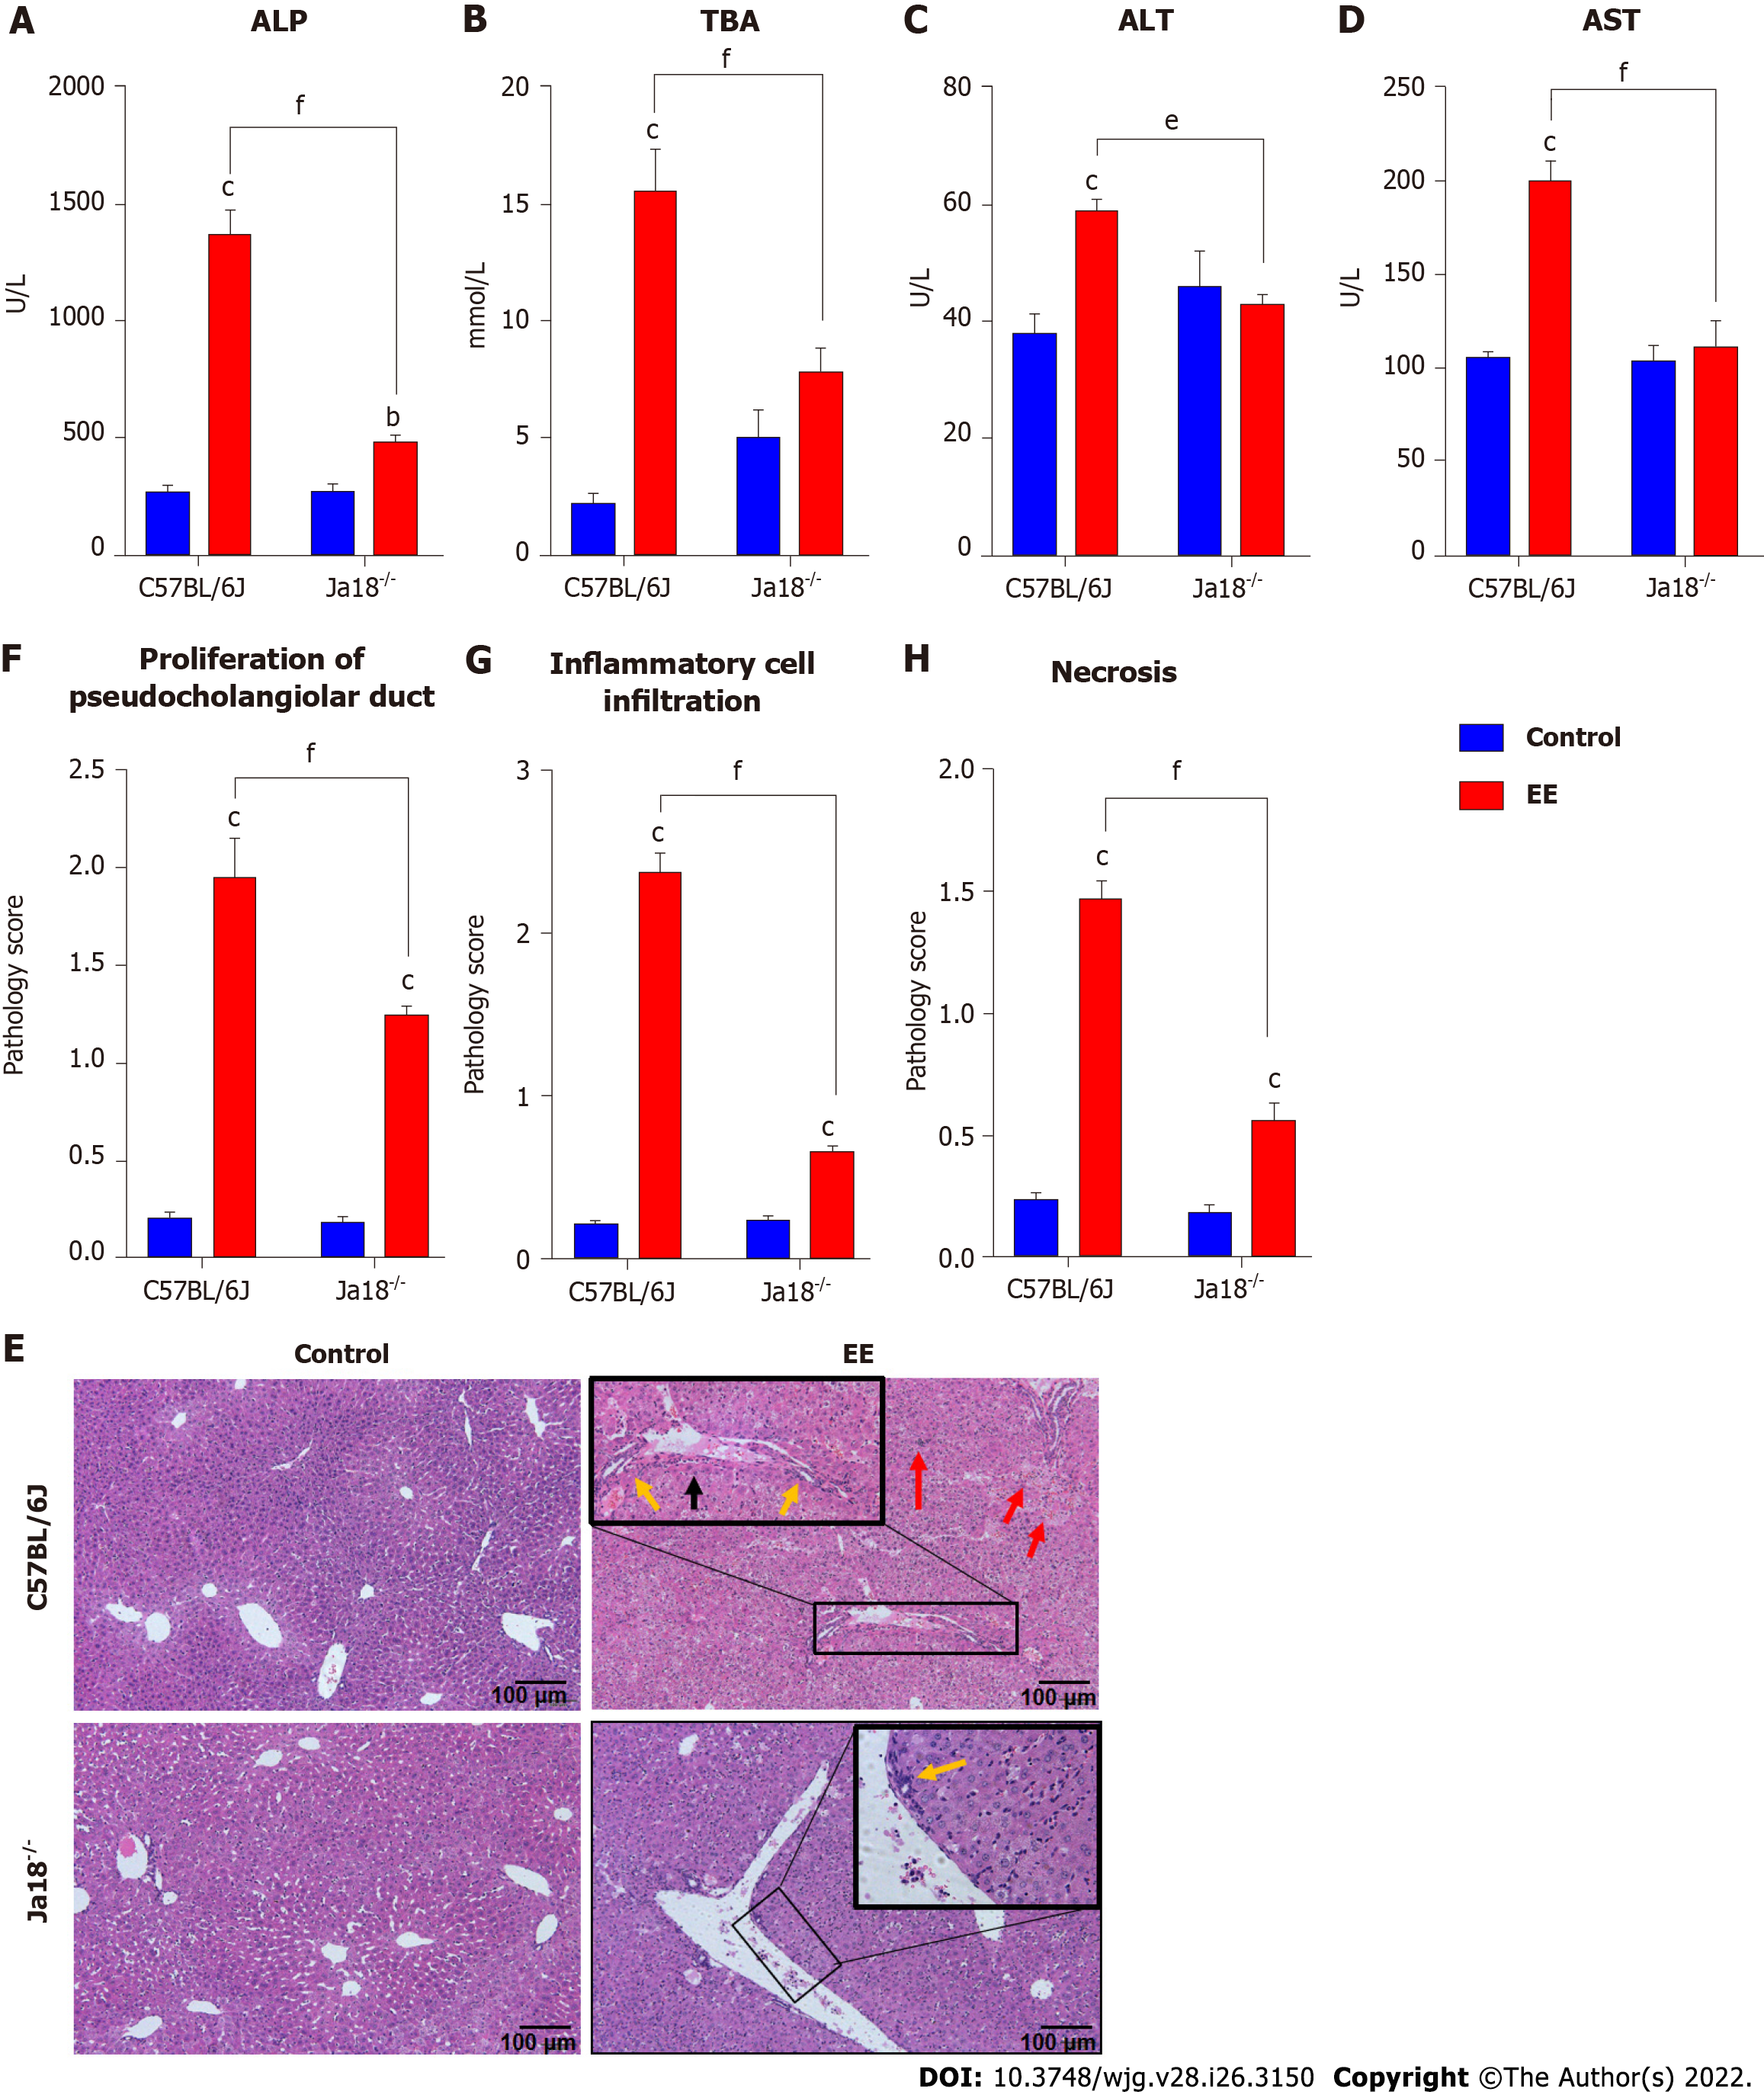
Figure 2 Invariant natural killer T cells exacerbate ethinylestradiol-induced cholestatic liver damage.
A-D: The serum levels of ALP (A), TBA (B), ALT (C) and AST (D); E: Liver sections stained with hematoxylin and eosin (10×); F: Proliferation of pseudocholangiolar duct (yellow arrows); G and H: Inflammatory cell infiltration (G, red arrows) and hepatocyte necrosis (H, black arrows) were compared as pathology scores. All values are the means ± SE (n = 4-6). bP < 0.01, cP < 0.001 vs control; eP < 0.01, fP < 0.001 vs C57BL/6J group.
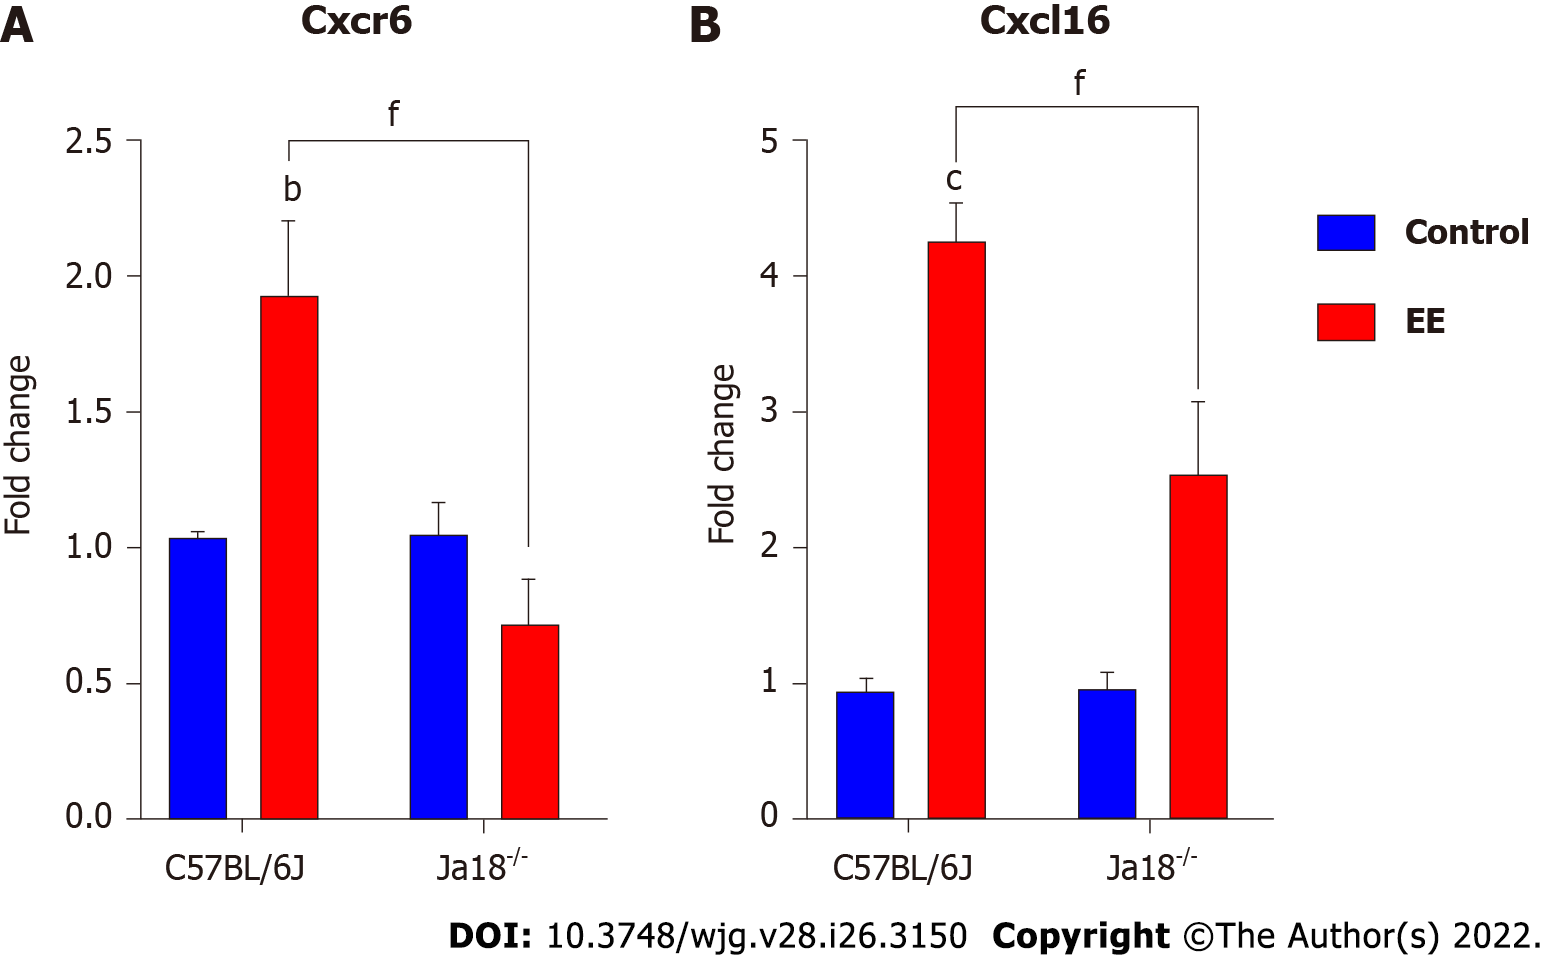
Figure 3 Invariant natural killer T cell deficiency lowers the hepatic expression of chemokine/chemokine receptors.
A and B: Hepatic mRNA expressions of Cxcr6 (A) and Cxcl16 (B) were determined and compared. All values are the means ± SE (n = 4-6). bP < 0.01, cP < 0.001 vs control; fP < 0.001 vs C57BL/6J group.
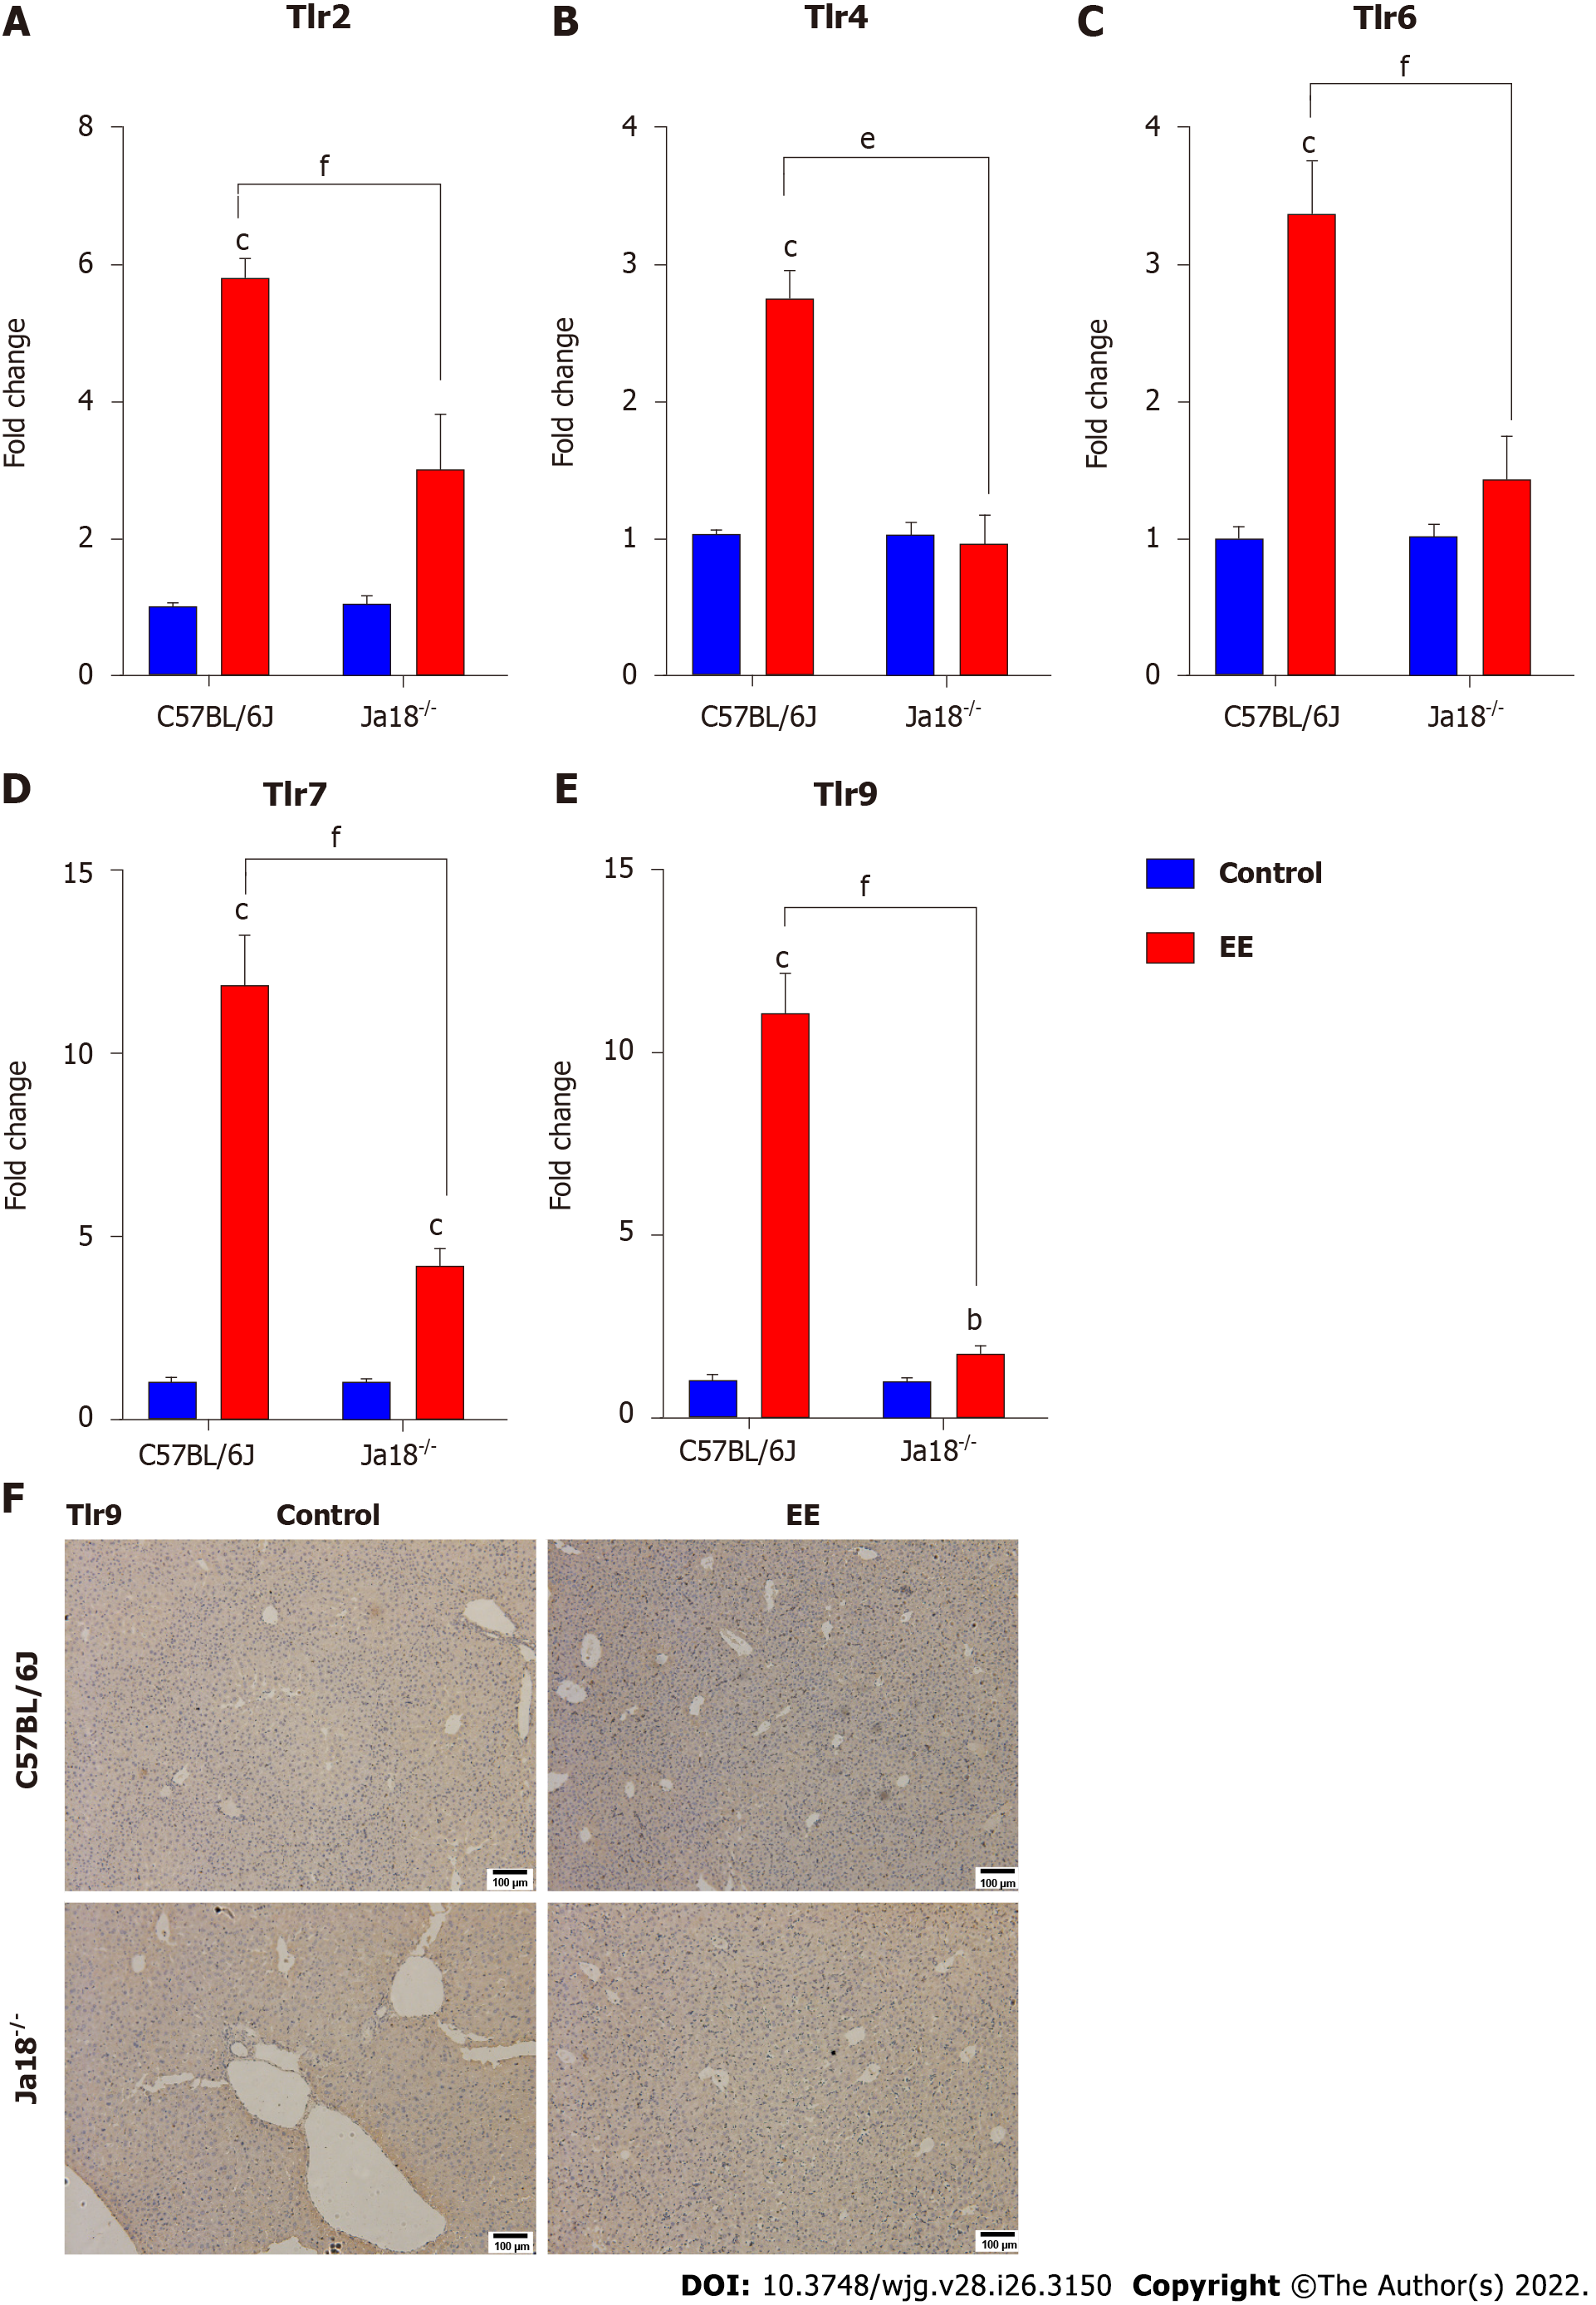
Figure 4 Absence of invariant natural killer T cells alters the expression of toll-like receptors.
A-E: Hepatic mRNA levels of Tlr2 (A), Tlr4 (B), Tlr6 (C), Tlr7 (D) and Tlr9 (E) were determined and compared; F: Changes in the protein level of TLR9 were determined by immunohistochemistry. All values are the means ± SE (n = 4-6). bP < 0.01, cP < 0.001 vs control; eP < 0.01, fP < 0.001 vs C57BL/6J group.
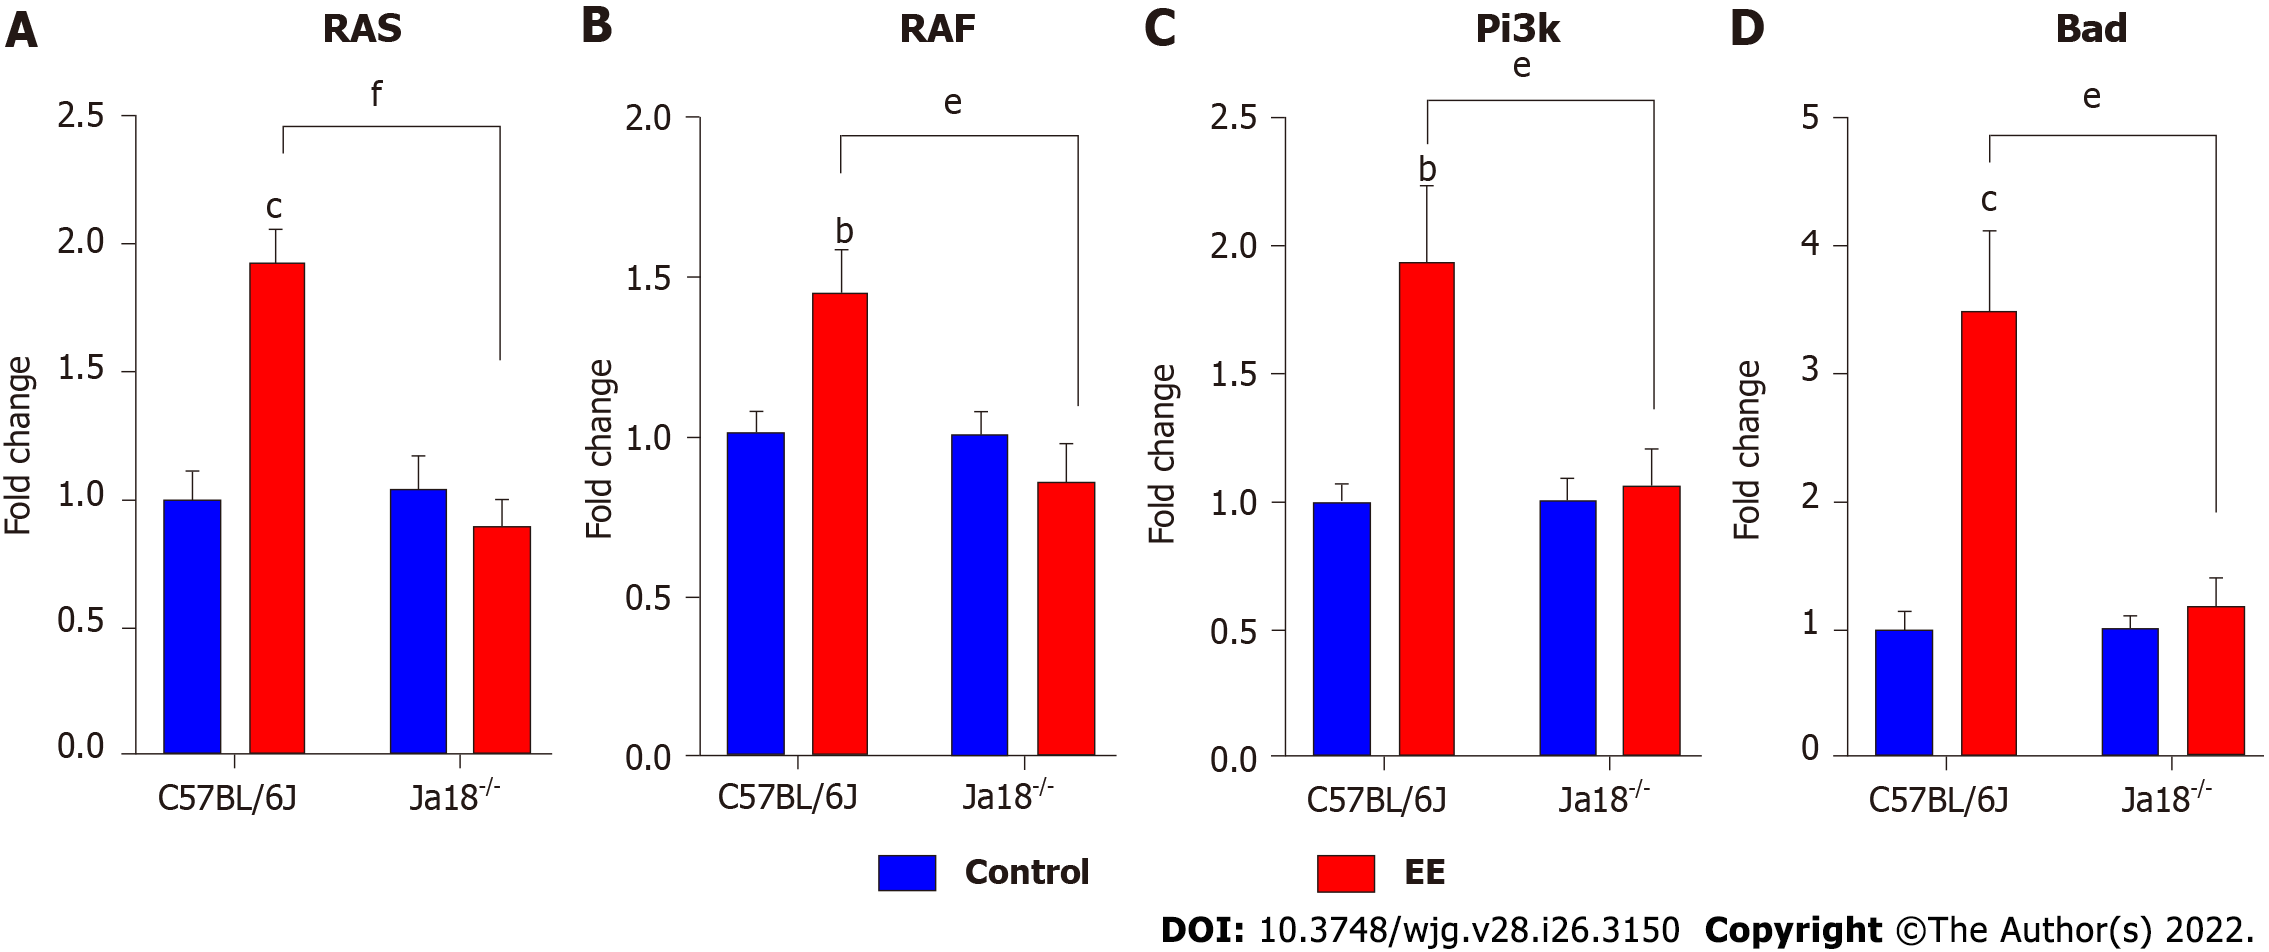
Figure 5 Absence of invariant natural killer T cells alters the expression of Ras/Raf and PI3K/Bad signaling pathways.
A-D: Hepatic gene expressions of Ras (A), Raf (B), Pi3k (C) and Bad (D) were determined and compared. All values are the means ± SE (n = 4-6), bP < 0.01, cP < 0.001 vs control; eP < 0.01, fP < 0.001 vs C57BL/6J group.
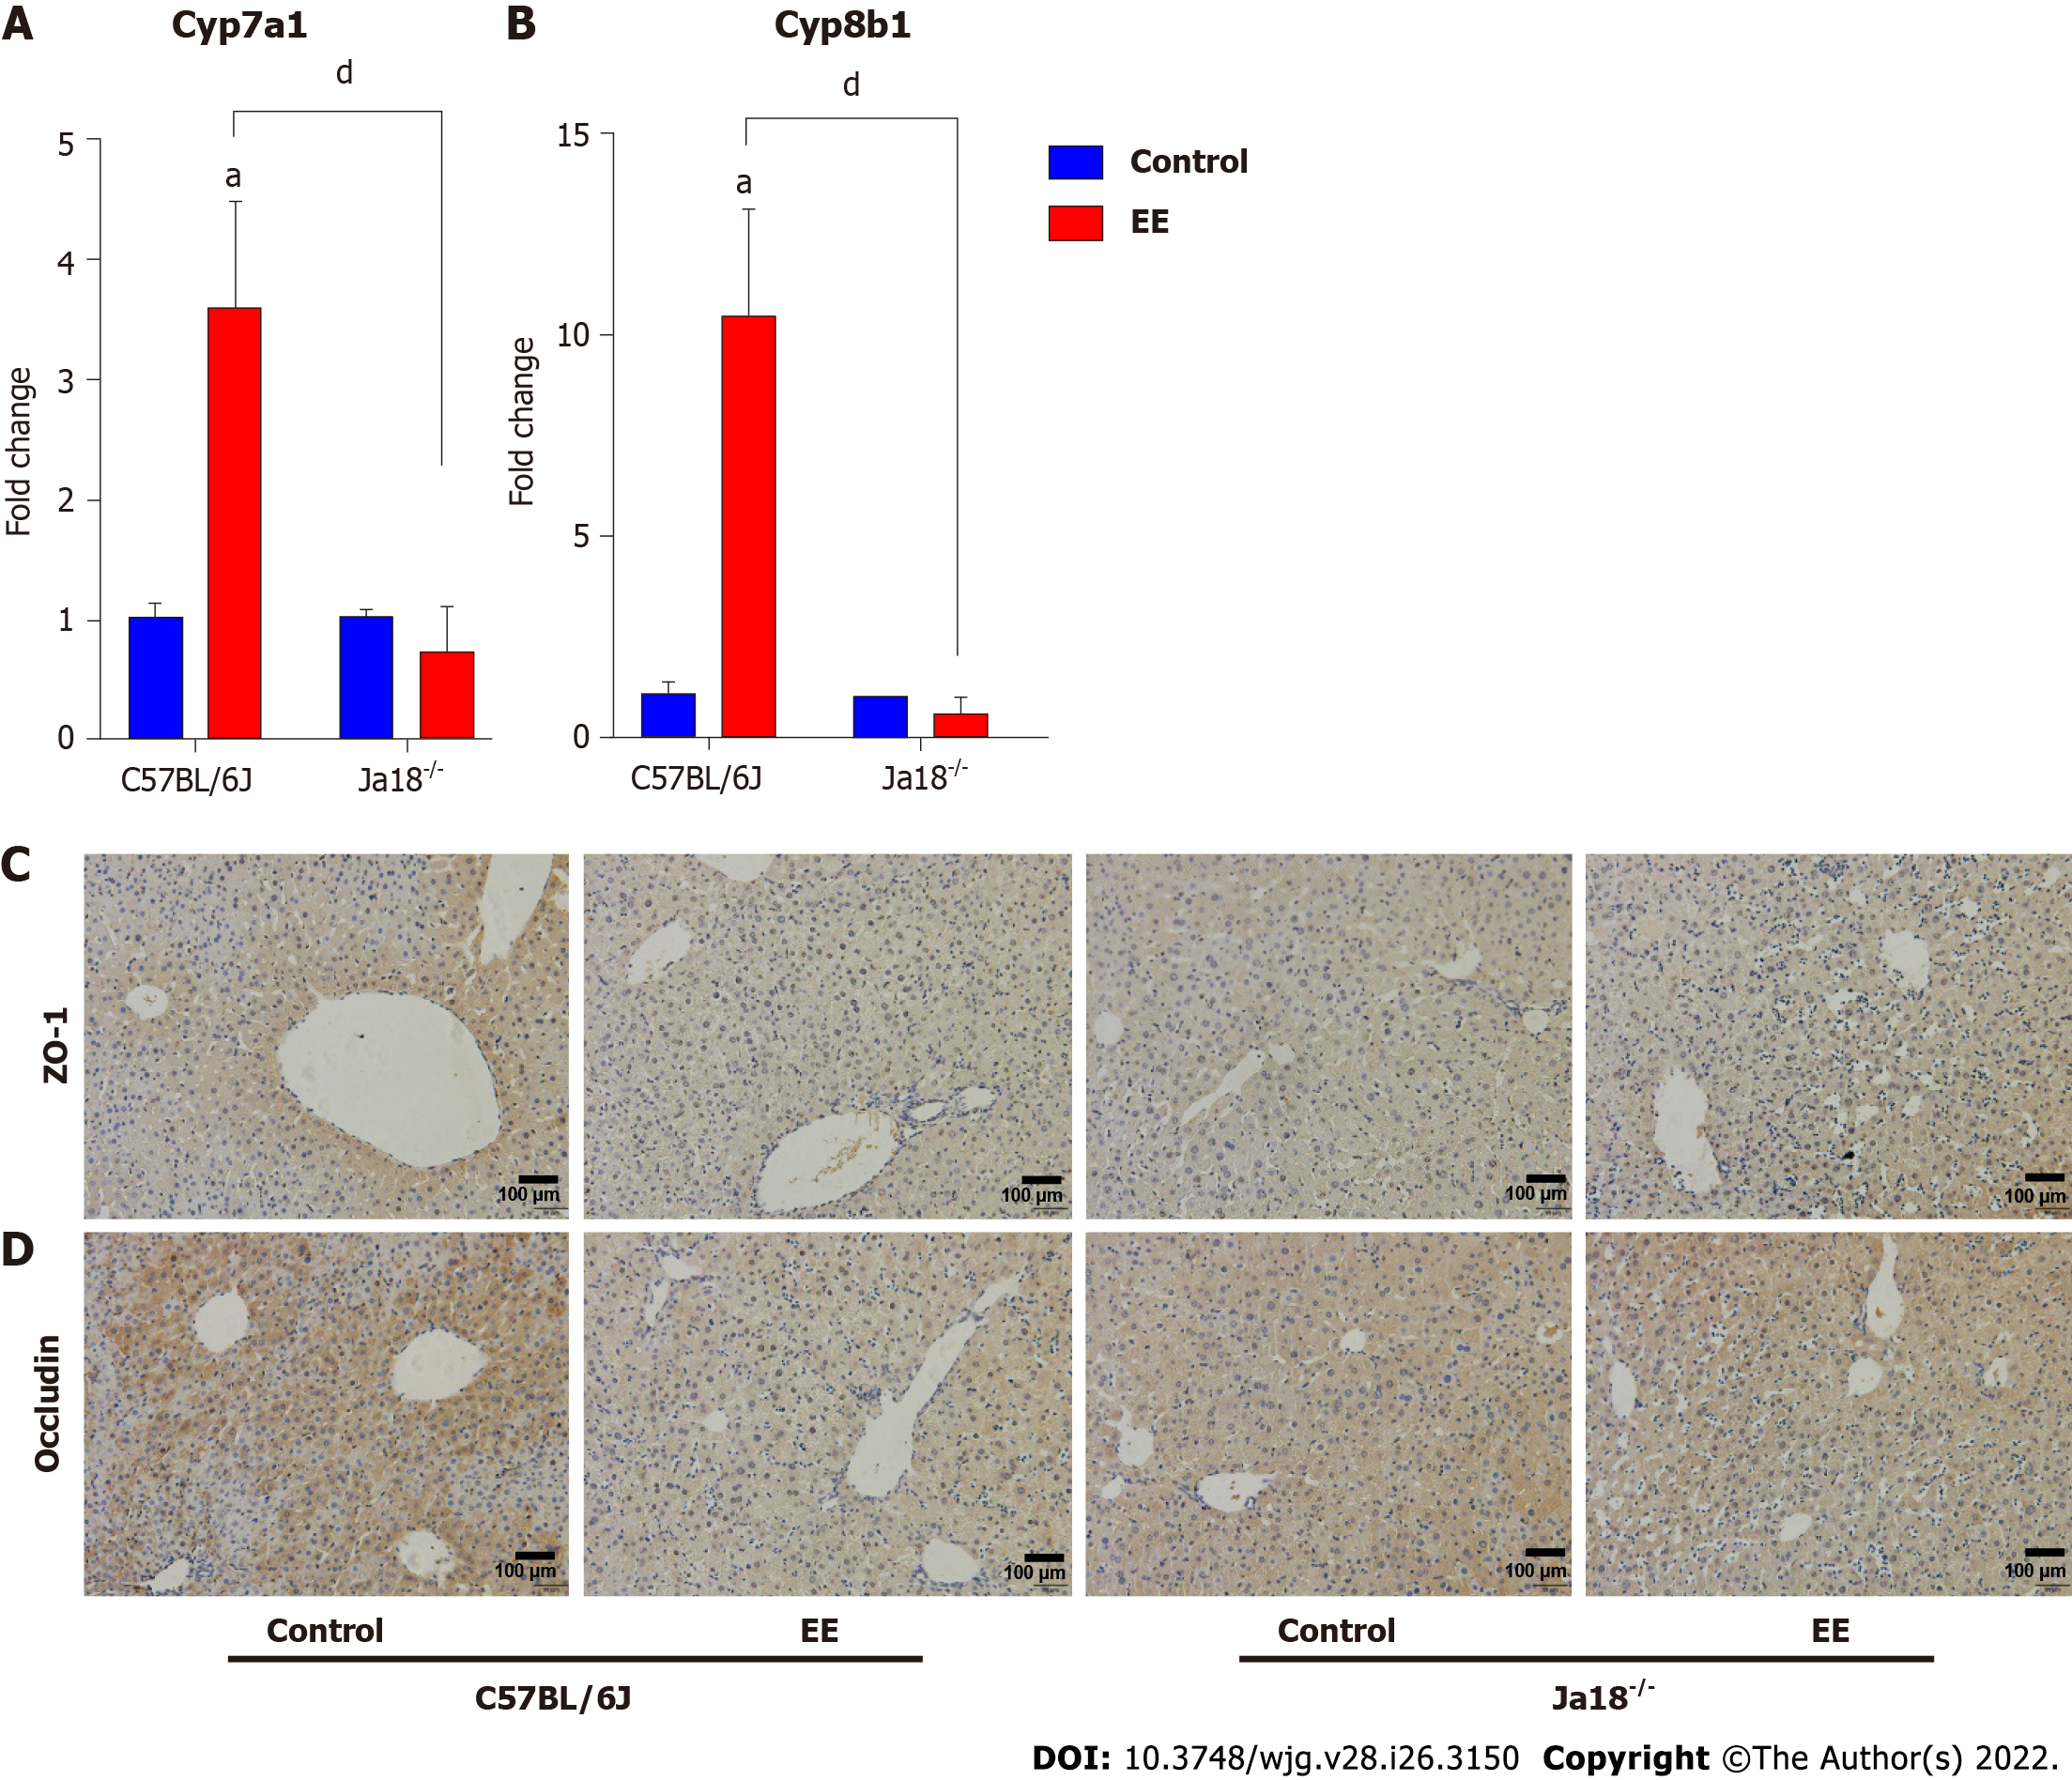
Figure 6 Knockout of invariant natural killer T cells may inhibit the synthesis of bile acid and weaken the inhibition of hepatocyte polarity.
A and B: Hepatic gene levels of bile acid synthase Cyp7a1 (A) and Cyp8b1 (B) were determined and compared; C and D: Changes in the protein expressions of tight junction Zo-1 (C) and Occludin (D) were determined by immunohistochemistry. All values are the means ± SE (n = 6), aP < 0.05 vs control; dP < 0.05 vs C57BL/6J group.
- Citation: Zou MZ, Kong WC, Cai H, Xing MT, Yu ZX, Chen X, Zhang LY, Wang XZ. Activation of natural killer T cells contributes to Th1 bias in the murine liver after 14 d of ethinylestradiol exposure. World J Gastroenterol 2022; 28(26): 3150-3163
- URL: https://www.wjgnet.com/1007-9327/full/v28/i26/3150.htm
- DOI: https://dx.doi.org/10.3748/wjg.v28.i26.3150


