Copyright
©The Author(s) 2022.
World J Gastroenterol. Jul 14, 2022; 28(26): 3008-3026
Published online Jul 14, 2022. doi: 10.3748/wjg.v28.i26.3008
Published online Jul 14, 2022. doi: 10.3748/wjg.v28.i26.3008
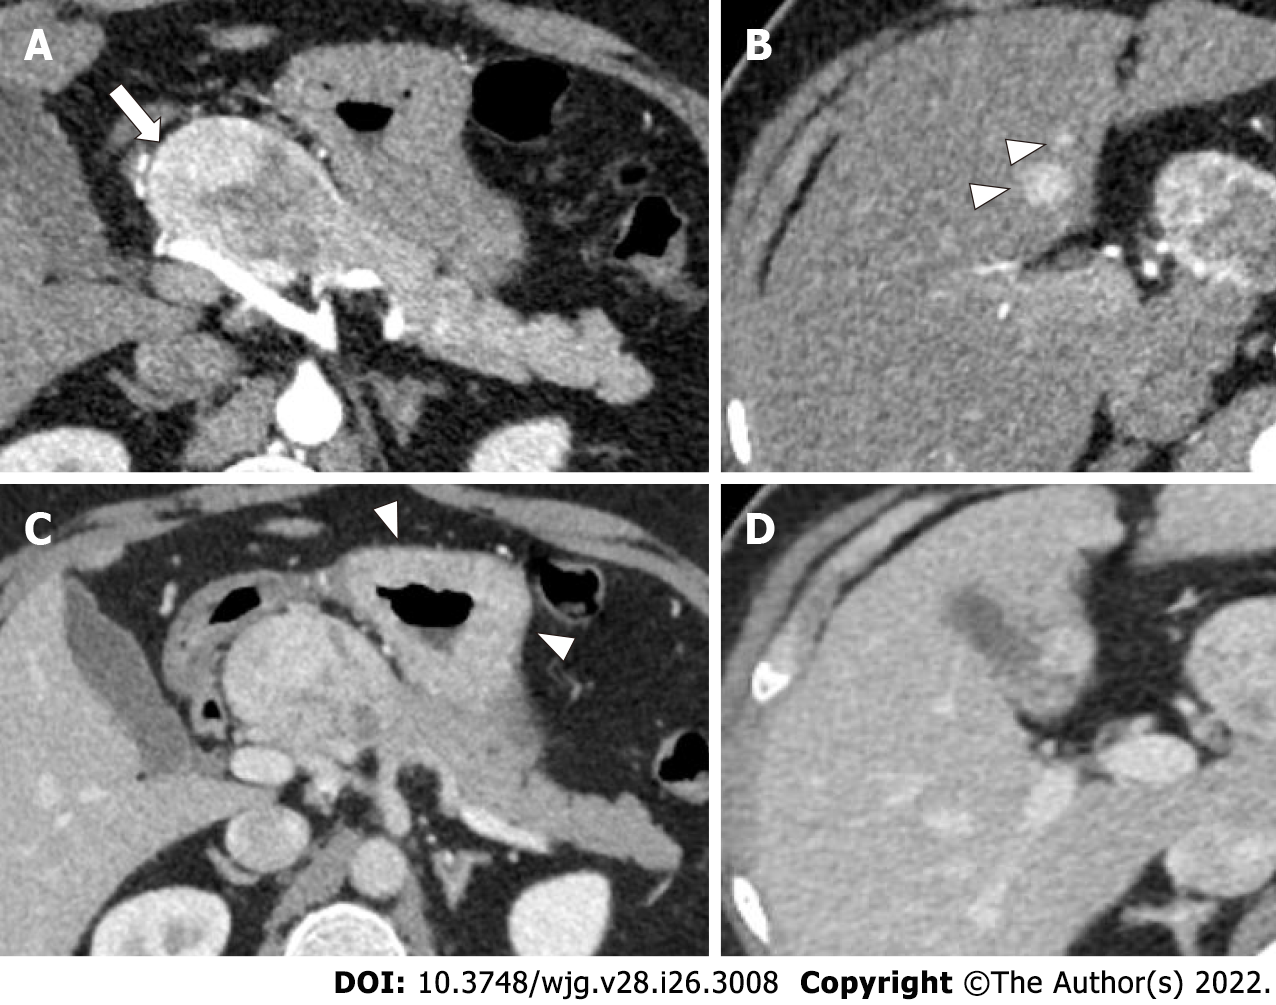
Figure 1 49-year-old man with epigastric pain and raised serum gastrin levels.
A and B: Axial contrast enhanced pancreatic phase computed tomography (CT) images show a well-defined hyperenhancing mass (arrow in A) in the head and neck of pancreas, abutting the proper hepatic artery along with two hyperenhancing focal lesions in the liver (arrowheads in B), indicating hepatic metastases; C and D: Axial portal venous phase CT images show retention of contrast in the lesions in both locations. Thickened gastric mucosal folds is also noted (arrowheads in C).
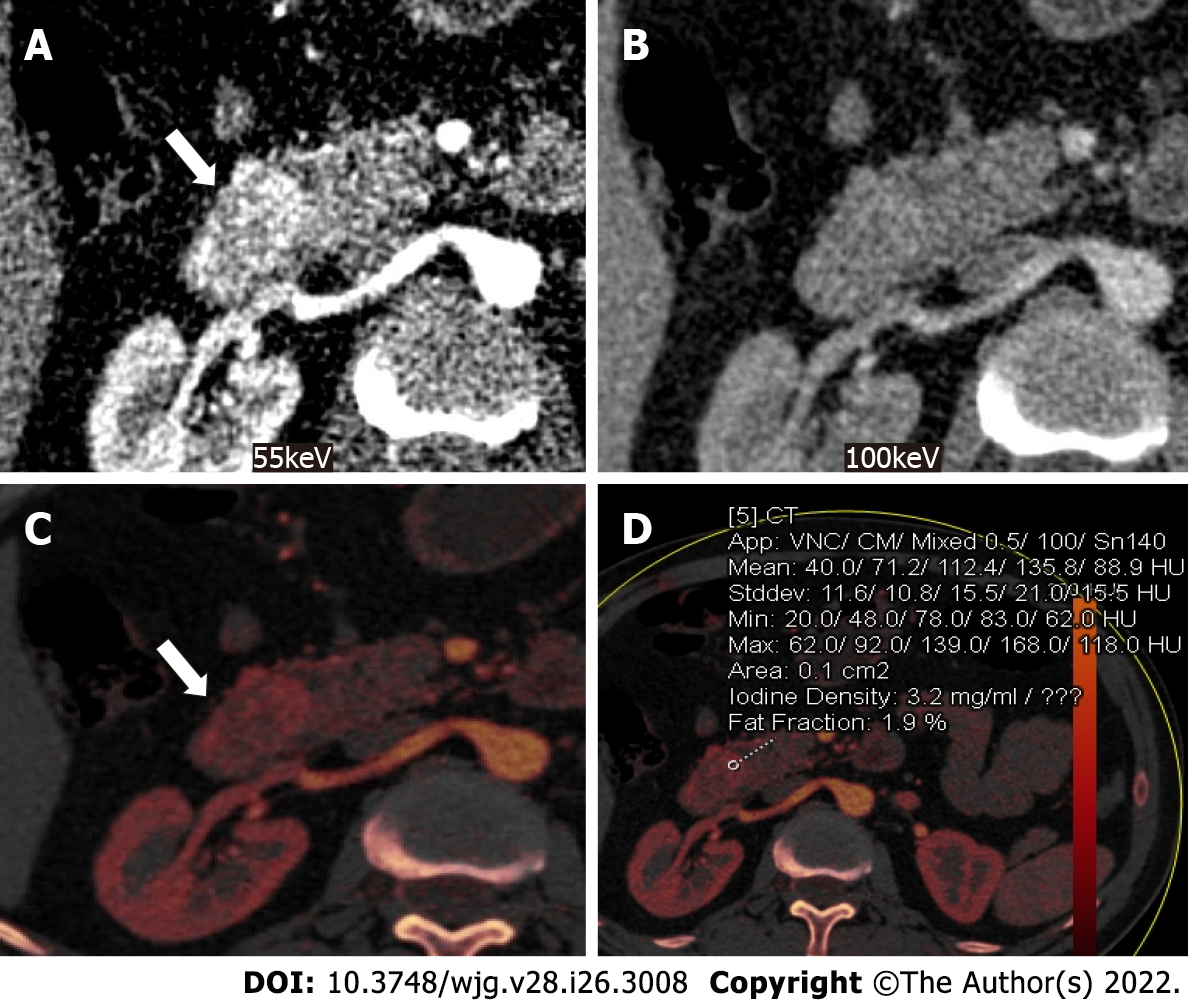
Figure 2 Dual-energy computed tomography images of a 46-year-old man presenting with melena.
A: Axial monochromatic computed tomography (CT) image at 55 keV in pancreatic phase shows a hyperenhancing well-defined mass (arrow) arising from the duodenal wall; B: Enhancement of the same lesion (arrow) appears subtle on the axial 100 keV monochromatic CT image; C and D: Iodine overlay maps show bright areas (arrow) suggesting contrast uptake (C), with iodine concentration of 3.2 mg/mL in areas of uptake (D). Iodine concentration of normal pancreas was 0.5 mg/mL.
Figure 3 Dual-energy computed tomography in grading the pancreatic neuroendocrine neoplasms.
A: Iodine overlay dual-energy computed tomography (CT) map of a 40-year-old woman with low-grade (grade 2) pancreatic neuroendocrine neoplasms (PNEN) in head of pancreas shows hyperenhancement of the tumor with an iodine concentration of 5.1 mg/mL; B and C: Iodine overlay dual energy CT maps of a 29-year-old man with grade 3 PNEN (outlined in B) shows large hypoenhancing areas with low iodine concentration (0.9 mg/mL) and peripheral bright areas with iodine concentration of 4.3 mg/mL (C). Measuring iodine concentration helps in objectively assessing the grade of the tumor.
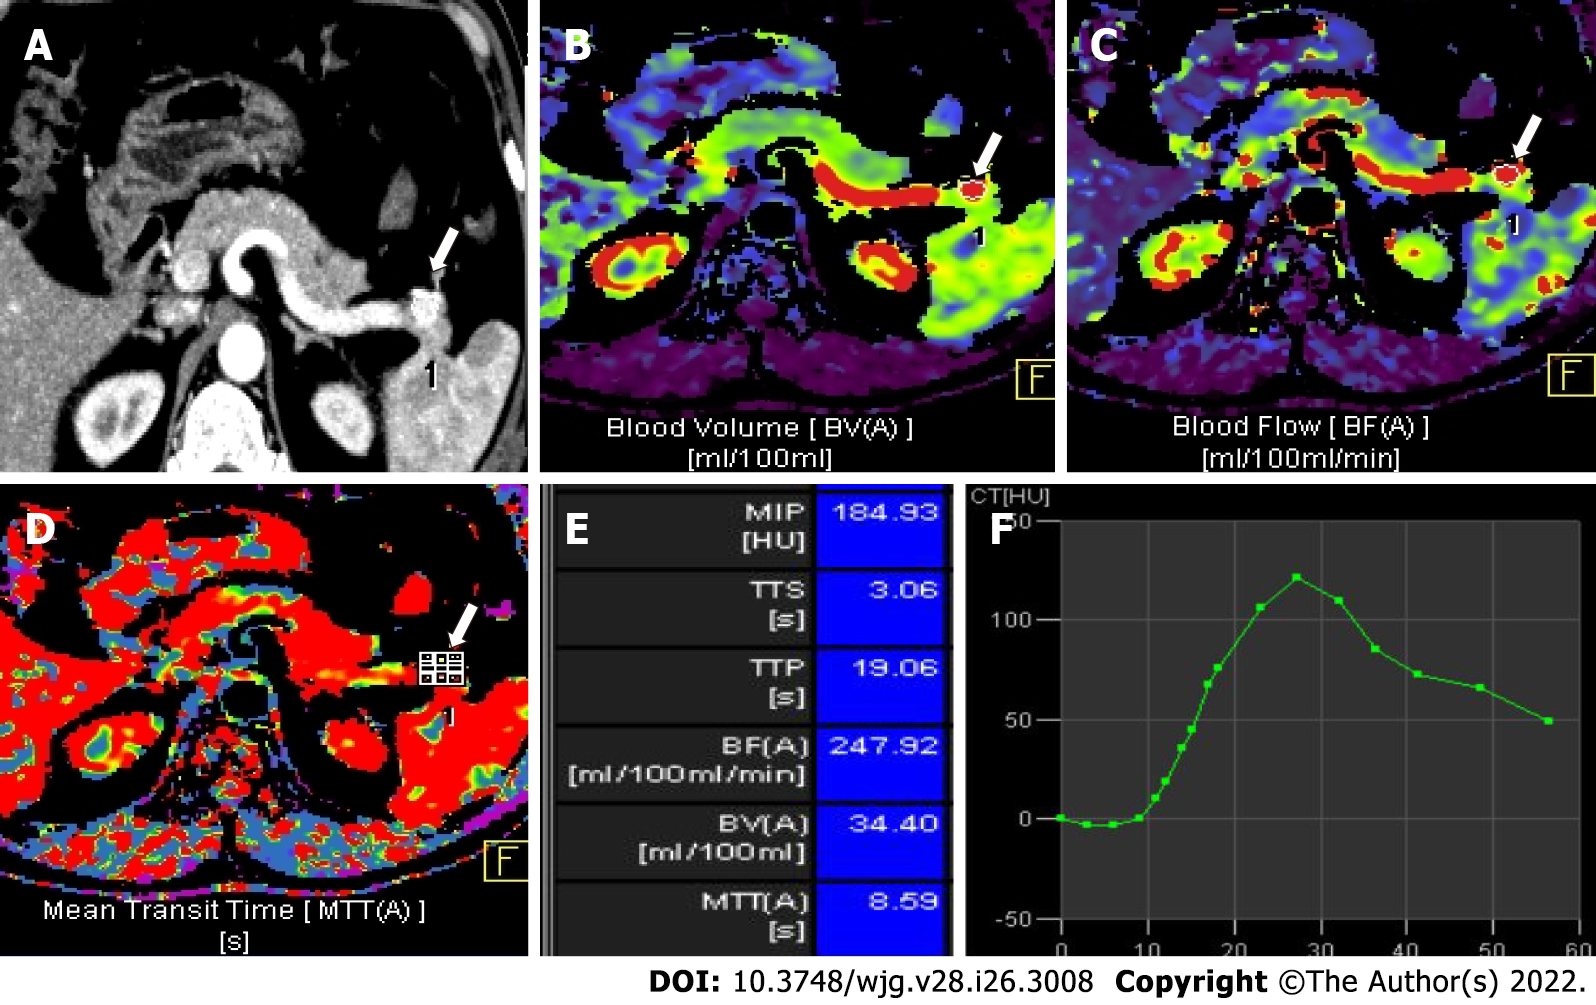
Figure 4 Volume perfusion computed tomography images of a 56-year-old man with recurrent hyperinsulinemic hypoglycemia.
A: Axial pancreatic phase computed tomography image shows a hyperenhancing lesion in the pancreatic tail (arrow); B-D: Color-coded parametric maps for blood volume (B), blood flow (C) and mean transit time (D) of the tumor (arrow) and normal pancreatic tissue; E: Chart shows mean value of each perfusion parameter of the tumor. Blood flow in the tumor was higher (247 mL/100 mL/min) compared to normal pancreatic parenchyma (72 mL/100 mL/min); F: Time attenuation curve shows dynamic enhancement pattern of the tumor corresponding to transient hyperenhancement. Histopathology after enucleation proved the tumor to be grade 1 insulinoma.
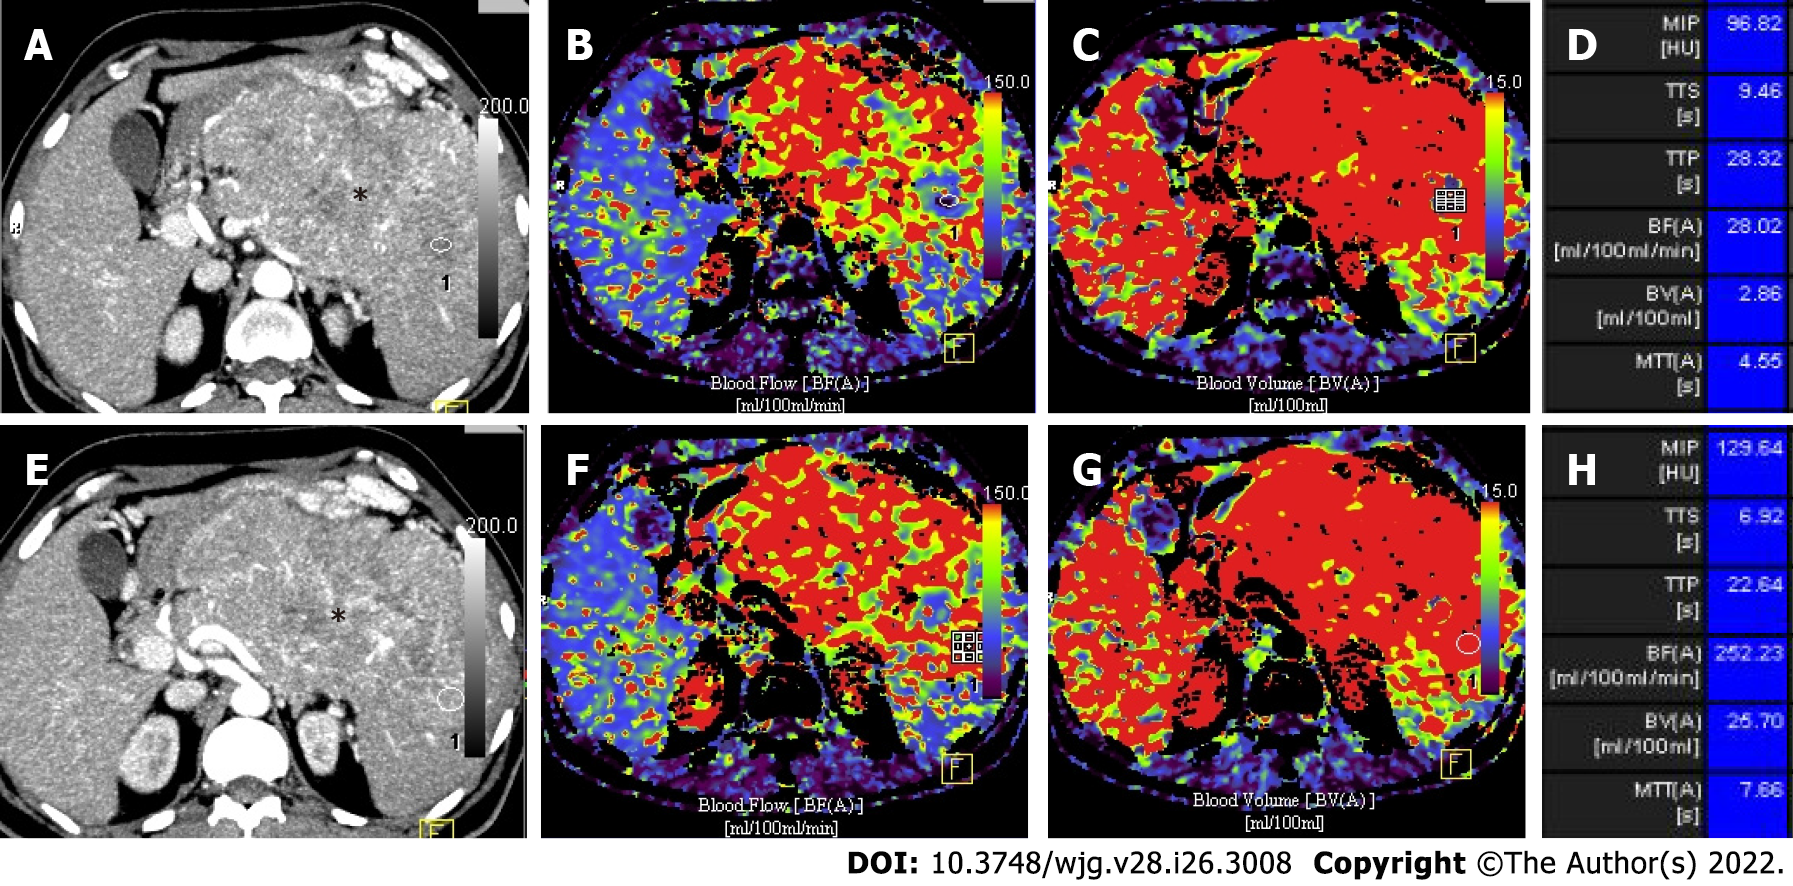
Figure 5 Volume perfusion computed tomography images of a 67-year-old man with a large grade 3 neuroendocrine neoplasm involving body and tail of pancreas.
A and B: Axial arterial phase computed tomography images with circular regions of interest placed at two different locations in the lesion (*); C-H: Parametric maps for blood flow (C and D) and blood volume (E and F) with mean value of each perfusion parameter (G and H) are shown. Lower values of mean blood flow, mean blood volume and mean transit time are features of high grade neuroendocrine neoplasm.
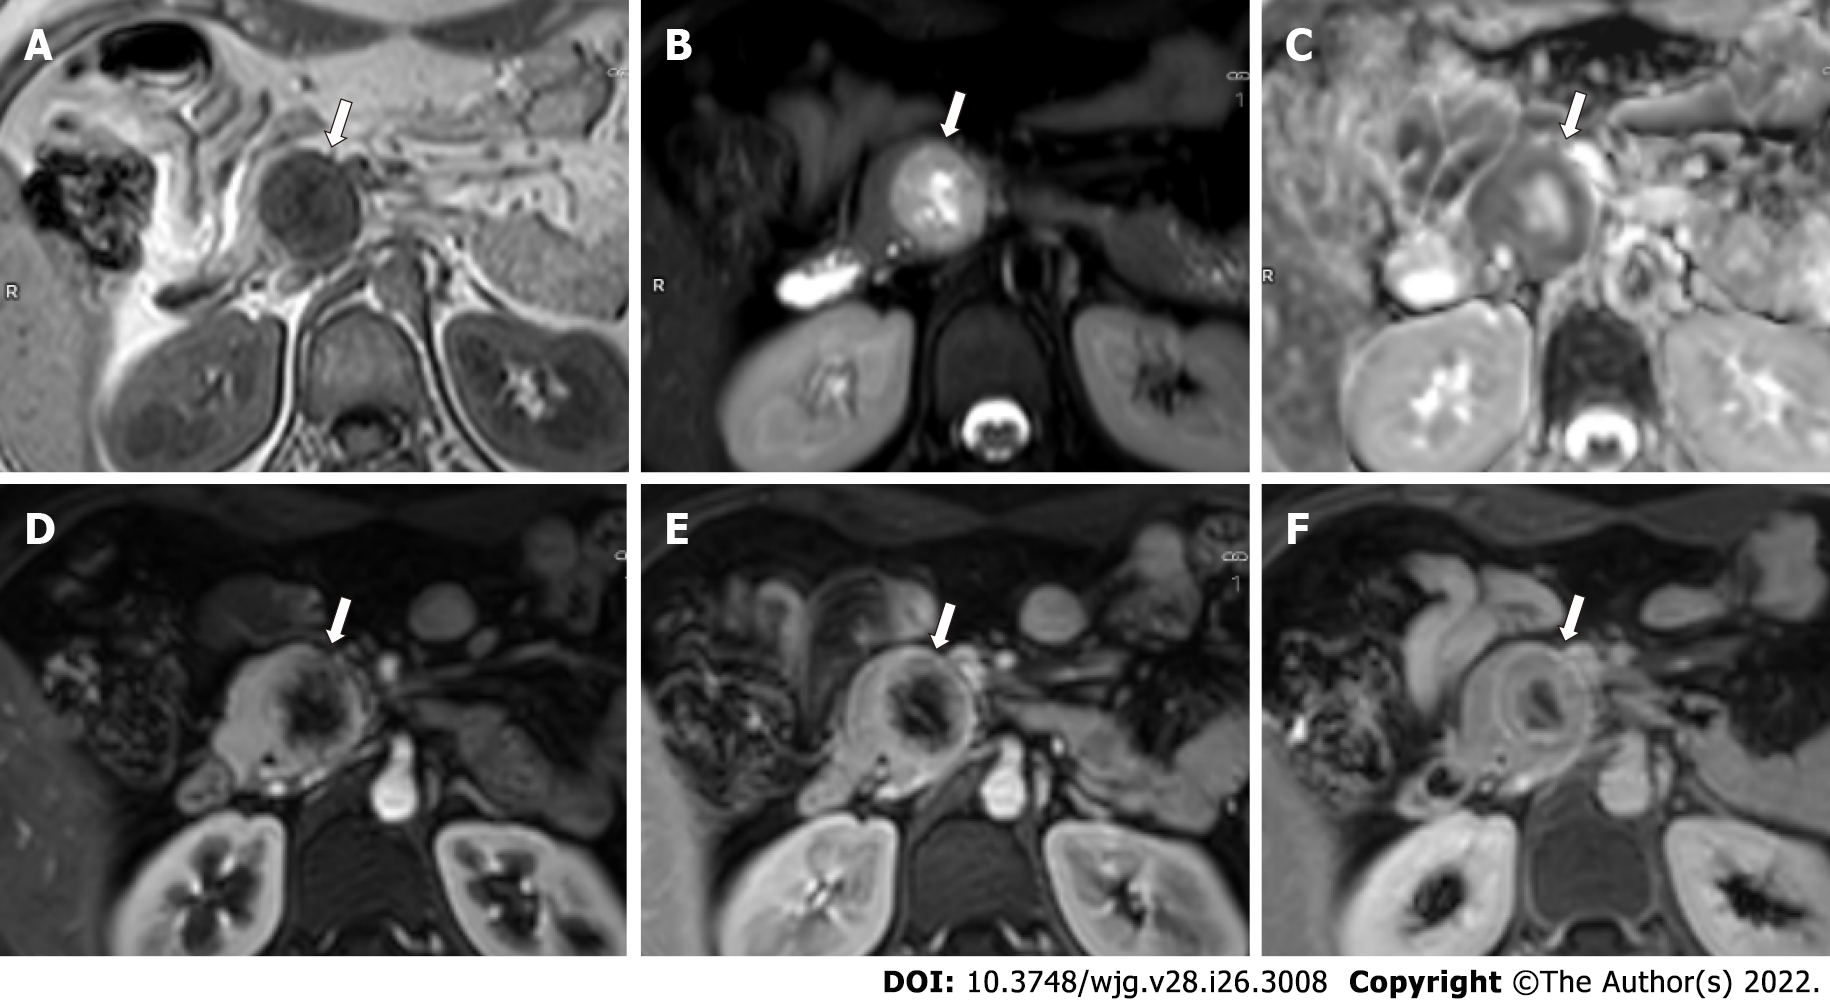
Figure 6 Magnetic resonance images of a 24-year-old woman with multiple endocrine neoplasia-type 1 syndrome and pancreatic neuroendocrine neoplasm.
A-C: Axial magnetic resonance images through the head of pancreas show a round heterogeneous mass (arrow) which appears hypointense on T1-weighted image (A), hyperintense on T2-weighted image with central cystic / necrotic change (B) and shows peripheral hypointensity on apparent diffusion coefficient (ADC) image (C) suggesting diffusion restriction along the periphery (ADC = 0.93 × 103 mm2/s); D-F: Axial dynamic contrast enhanced T1-weighted images show hyperenhancement of the tumor along the periphery in pancreatic phase (D), with contrast retention in venous (E) and delayed (F) phase images. The patient also had bilateral inferior parathyroid and left superior parathyroid adenomas.
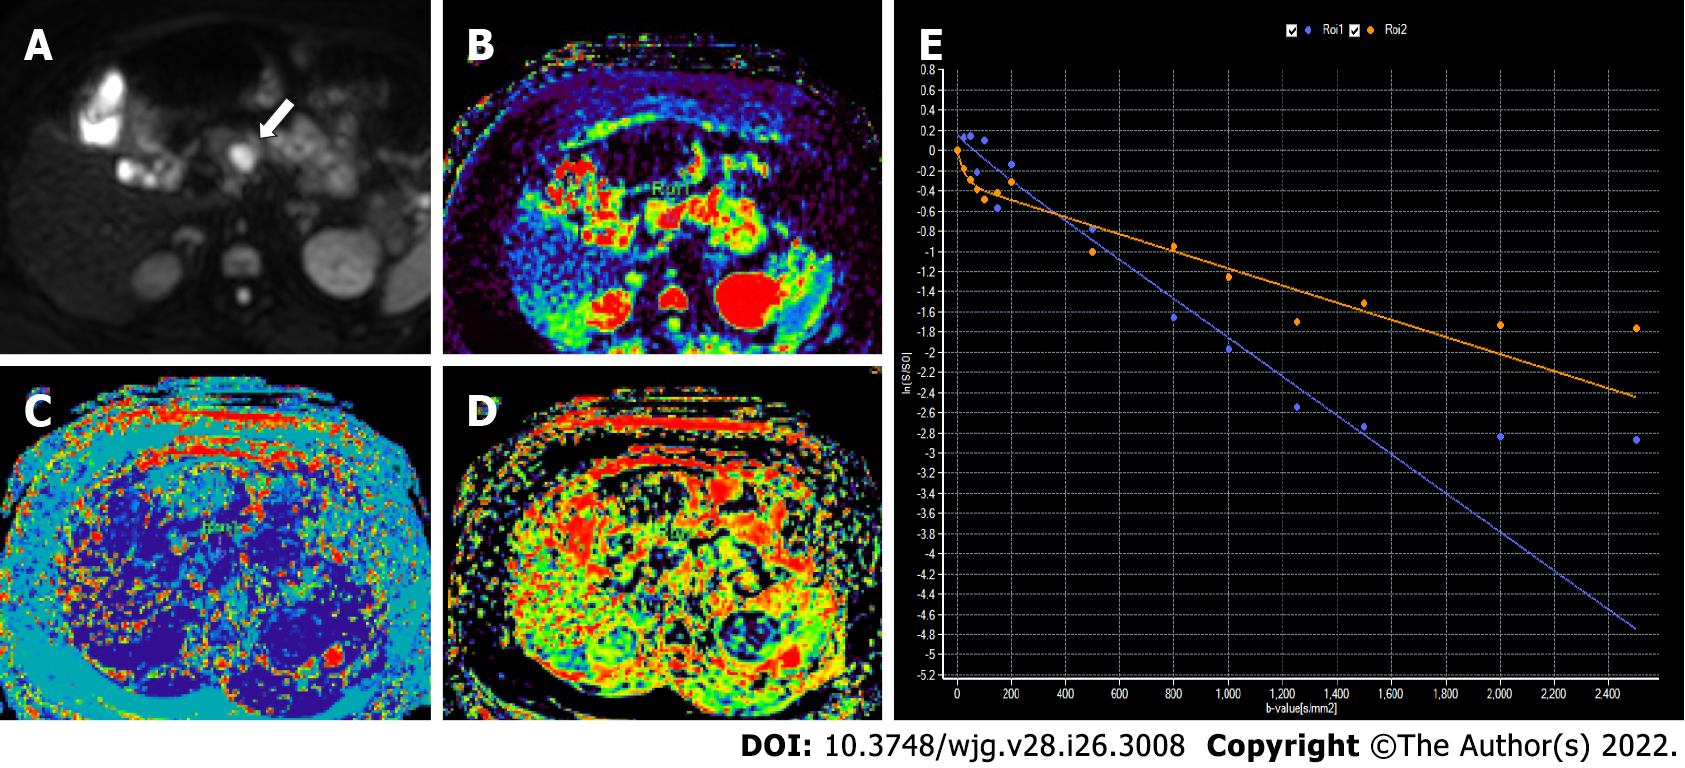
Figure 7 Intravoxel incoherent motion diffusion-weighted imaging in a 46-year-old woman with proven grade 1 pancreatic neuroe
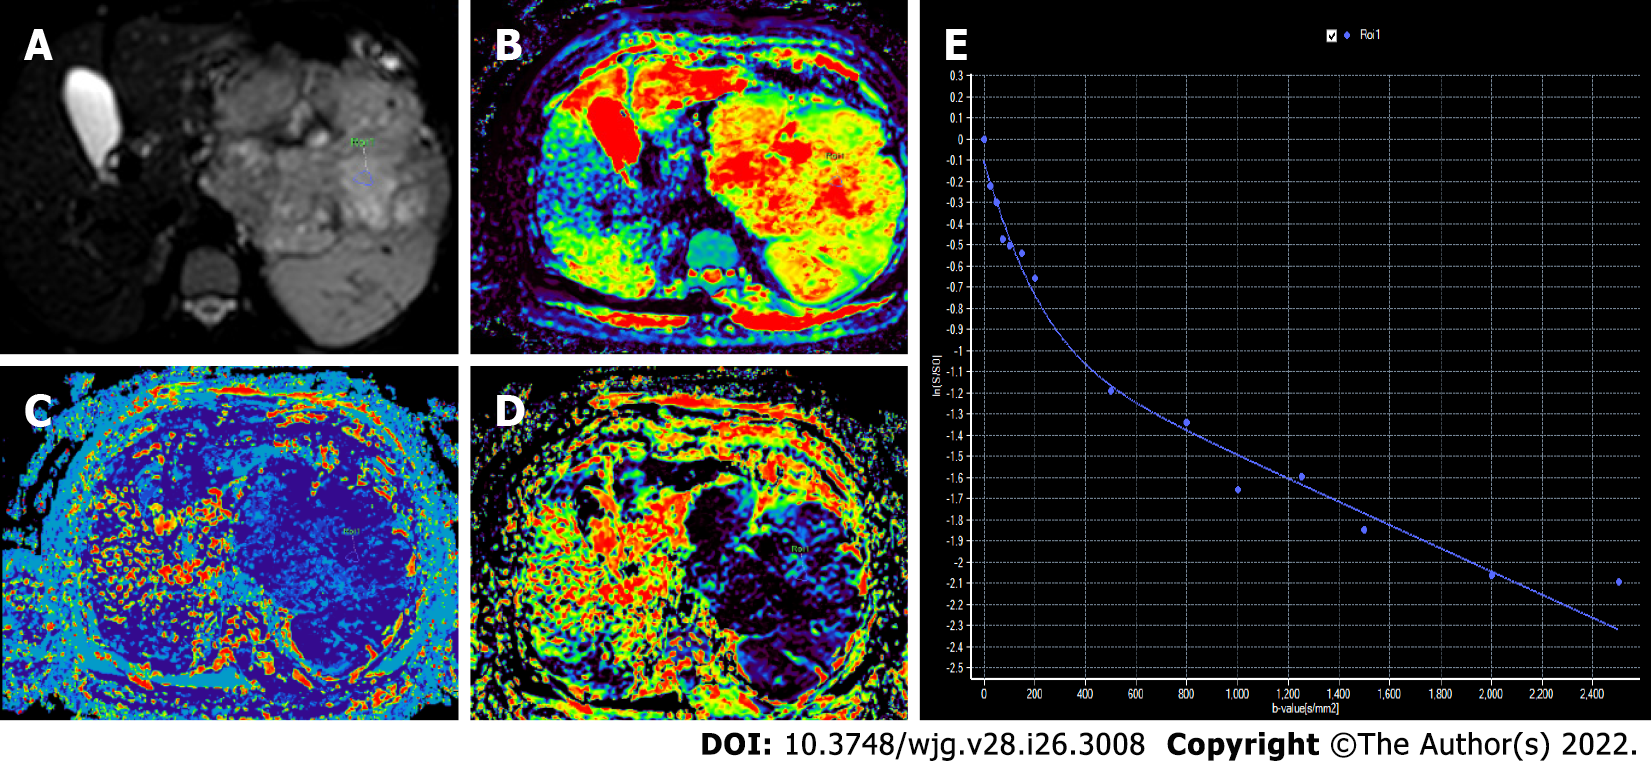
Figure 8 Intravoxel incoherent motion diffusion-weighted imaging in a 67-year-old man with grade 3 pancreatic neuroendocrine neoplasm.
A: Axial diffusion weighted image (b = 200 s/mm2) with circular region of interest in the tumor; B: Color-coded diffusion map shows true diffusion coefficient, D = 0.84 × 103 mm2/s; C: Color-coded perfusion map shows pseudodiffusion coefficient, D* = 5.01 × 103 mm2/s); D: Color-coded perfusion fraction map shows a value, f = 4.5%; E: Signal decay curve shows steeper decay at low b values and continued fall at higher b values [in comparison to grade 1 pancreatic neuroendocrine neoplasm (PNEN) (Figure 7), true diffusion coefficient is lower in grade 3 PNENs].
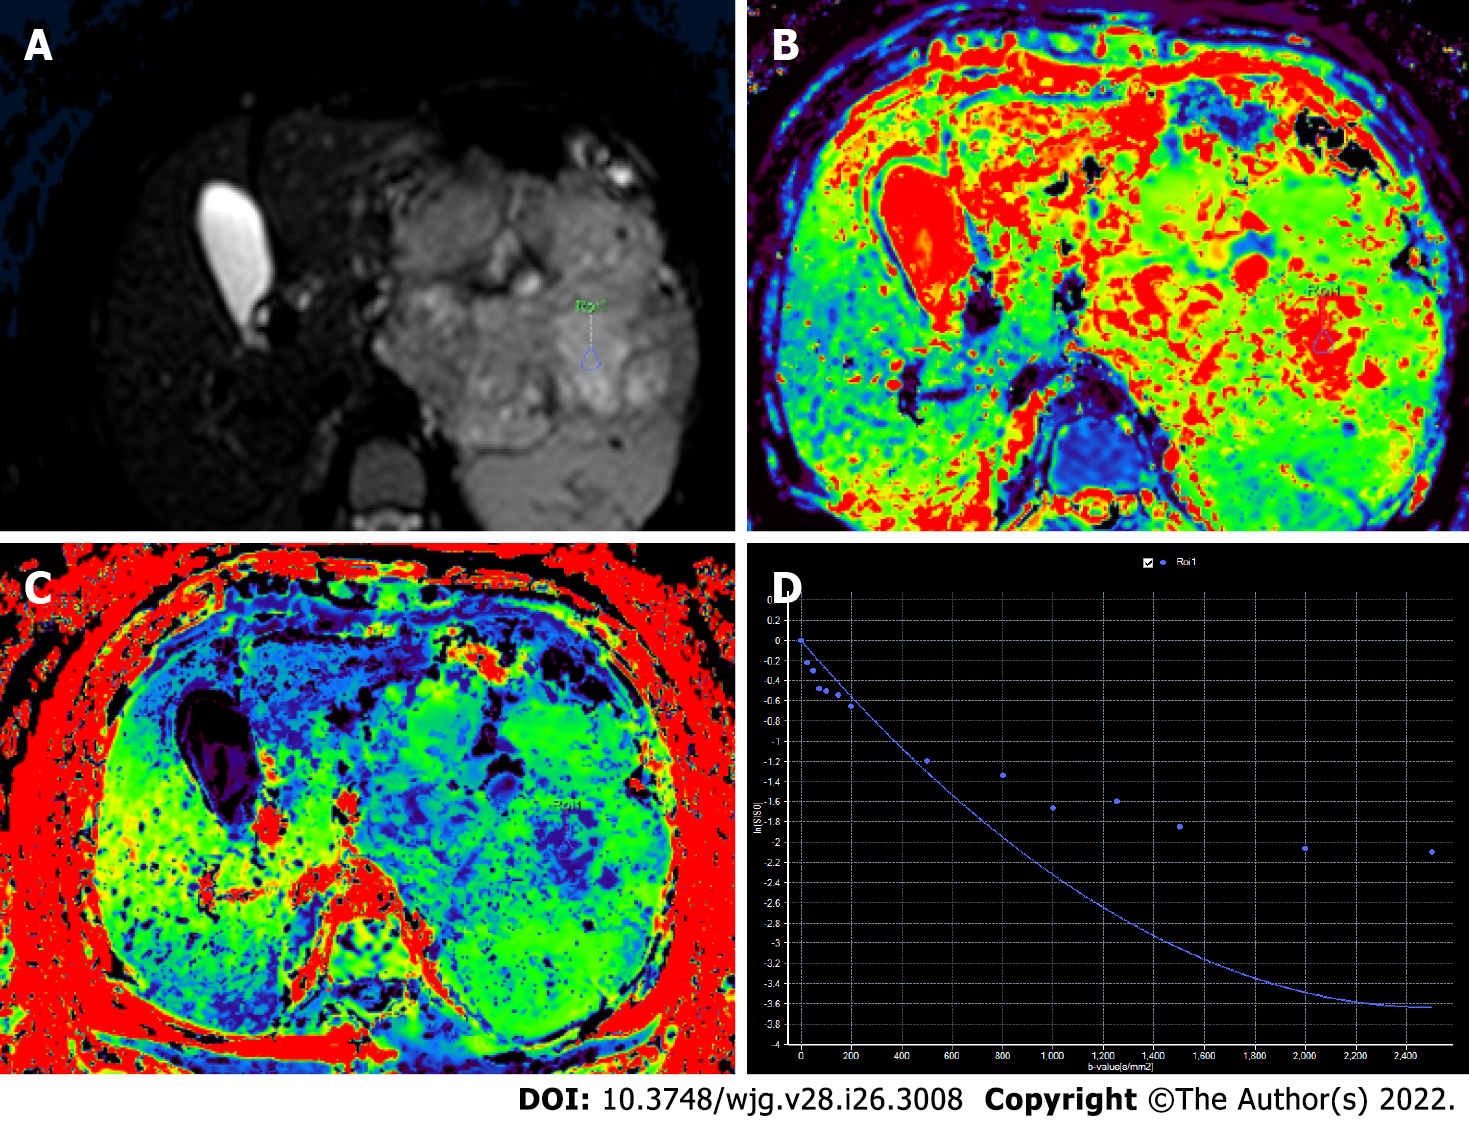
Figure 9 Diffusion kurtosis of the lesion same as in Figure 8.
A: Axial diffusion-weighted image (b = 200 s/mm2) with region of interest marked; B: Diffusion map (D = 3 × 103 mm2/s); C: Kurtosis map (k = 0.40); D: Signal decay curve shows non-Gaussian diffusion.
- Citation: Ramachandran A, Madhusudhan KS. Advances in the imaging of gastroenteropancreatic neuroendocrine neoplasms. World J Gastroenterol 2022; 28(26): 3008-3026
- URL: https://www.wjgnet.com/1007-9327/full/v28/i26/3008.htm
- DOI: https://dx.doi.org/10.3748/wjg.v28.i26.3008


