Copyright
©The Author(s) 2022.
World J Gastroenterol. Jun 28, 2022; 28(24): 2758-2774
Published online Jun 28, 2022. doi: 10.3748/wjg.v28.i24.2758
Published online Jun 28, 2022. doi: 10.3748/wjg.v28.i24.2758
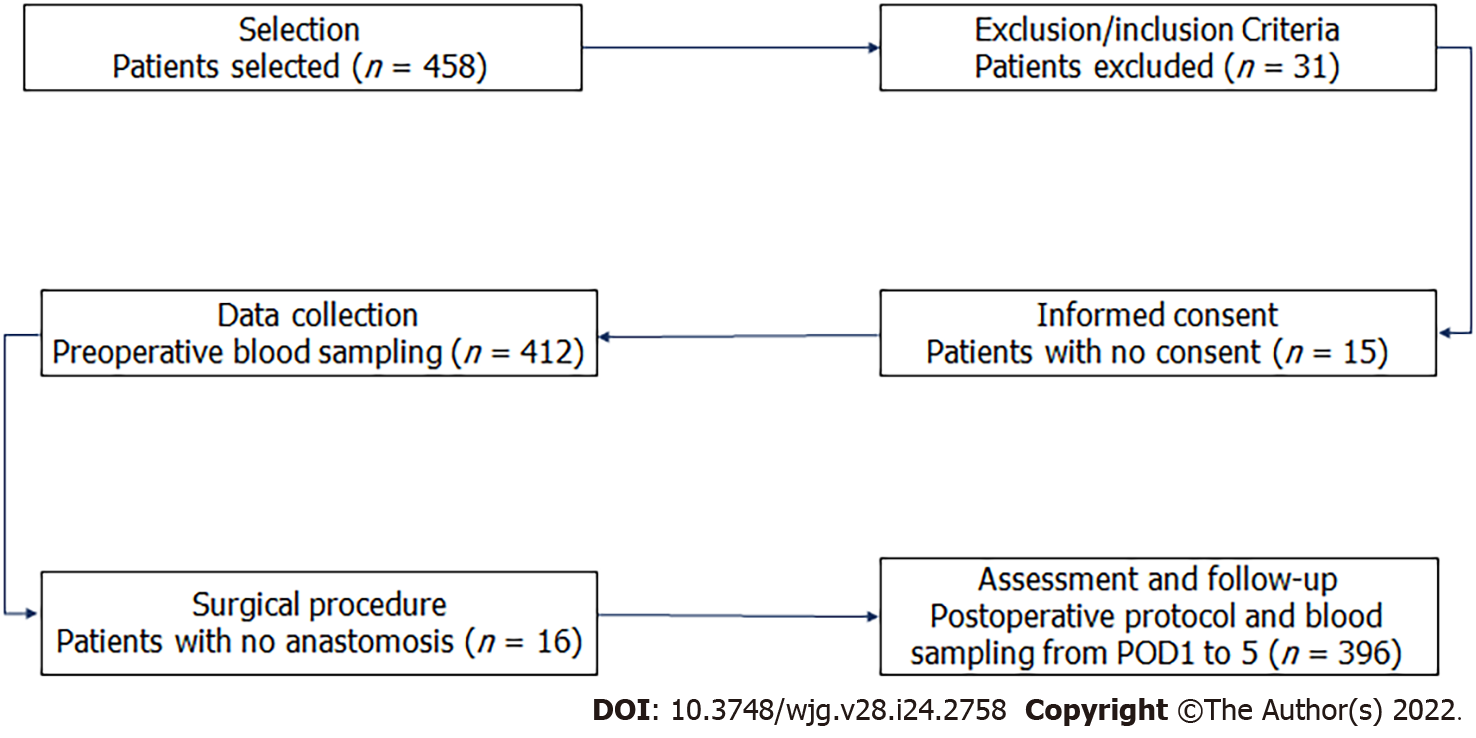
Figure 1 Flow diagram of patients according to the study protocol.
POD1: Postoperative day 1.
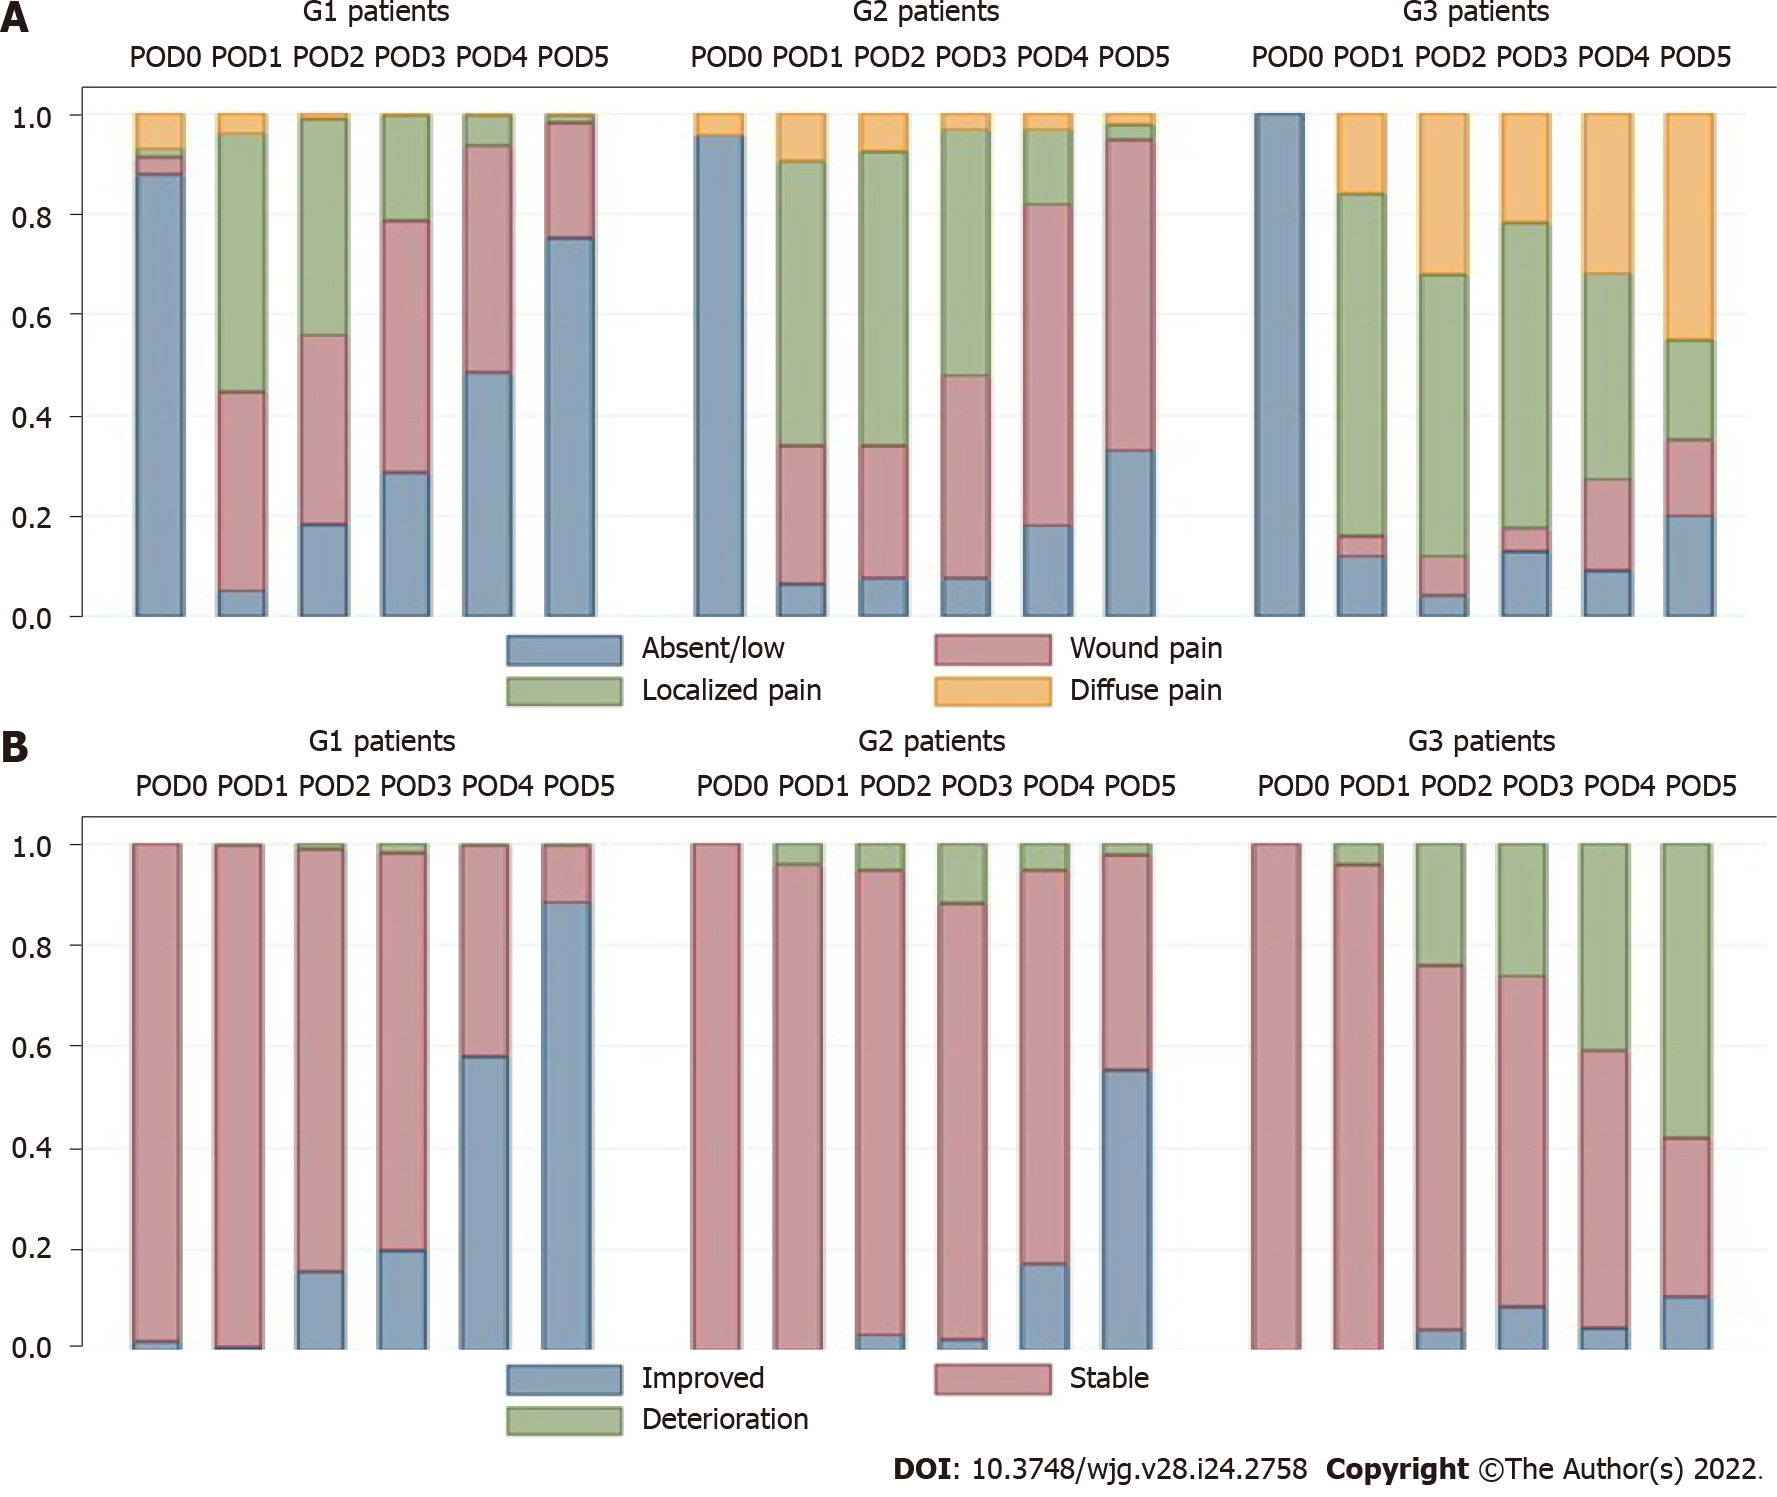
Figure 2 Distribution of rates of abdominal pain (A) and clinical condition (B).
G1: No complications; G2: Complications not related to colorectal anastomotic leakage; G3: CAL. POD: Postoperative day.
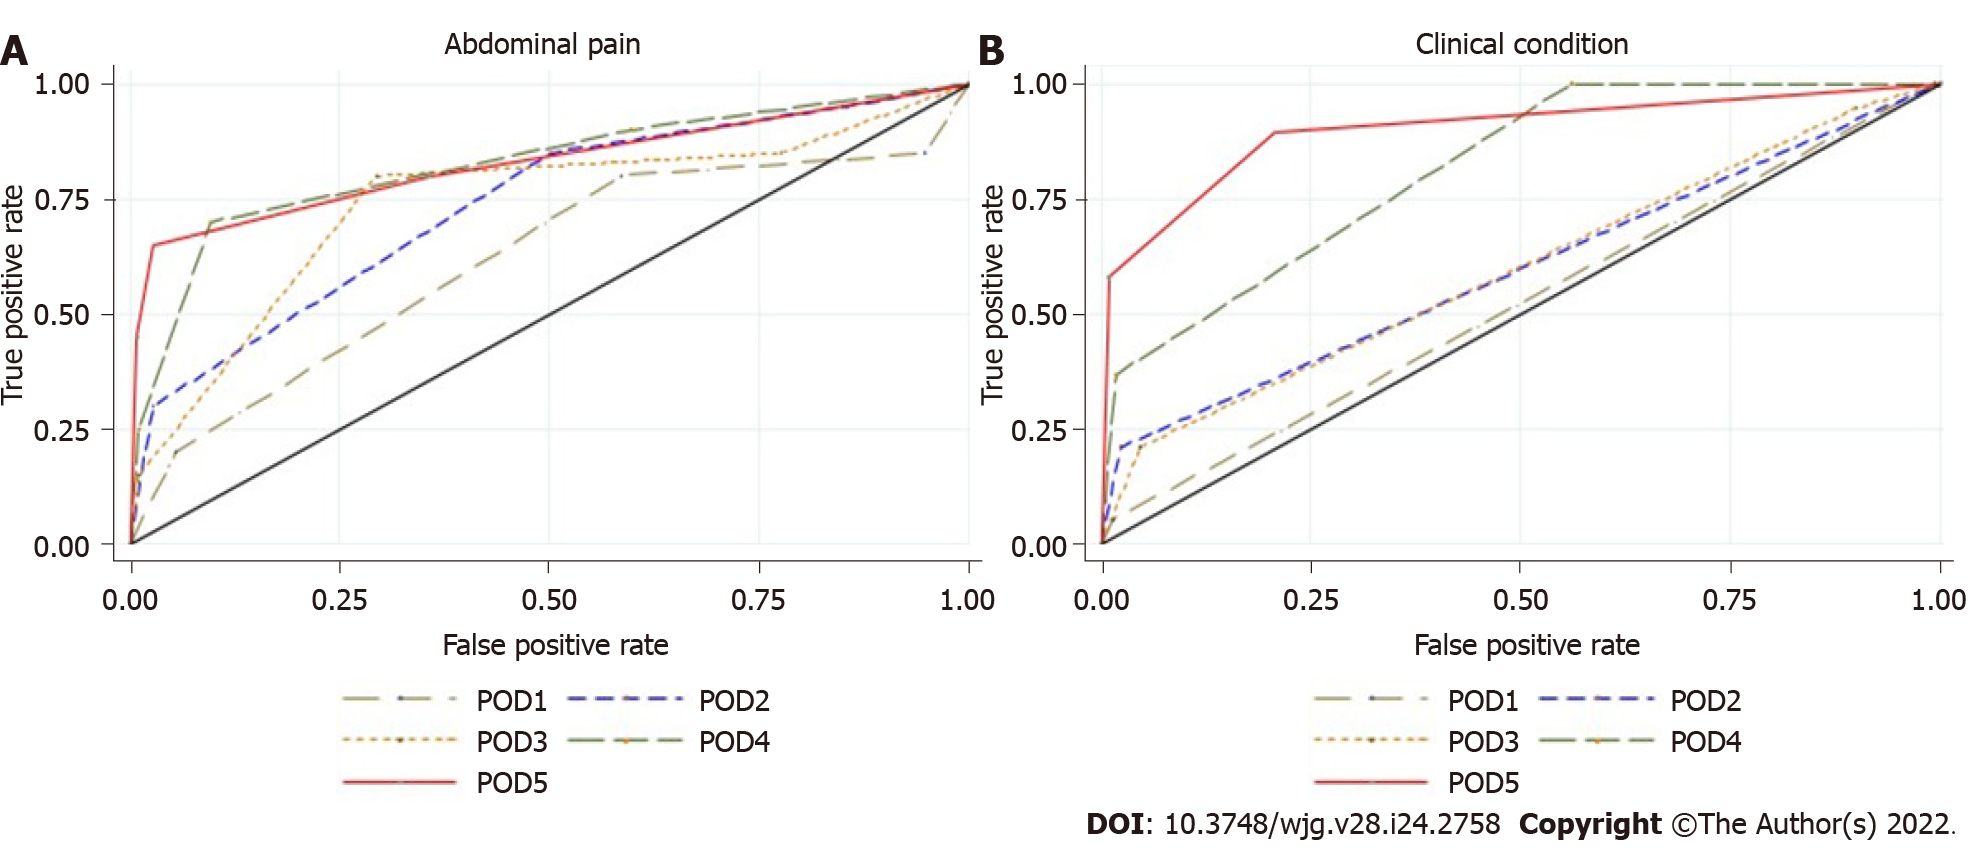
Figure 3 Area under the receiver operating characteristic curve of colorectal anastomotic leakage for clinical criteria.
A: Abdominal pain from postoperative day 1 to postoperative day 5; B: Clinical condition from postoperative day 1 to postoperative day 5. POD: Postoperative day.
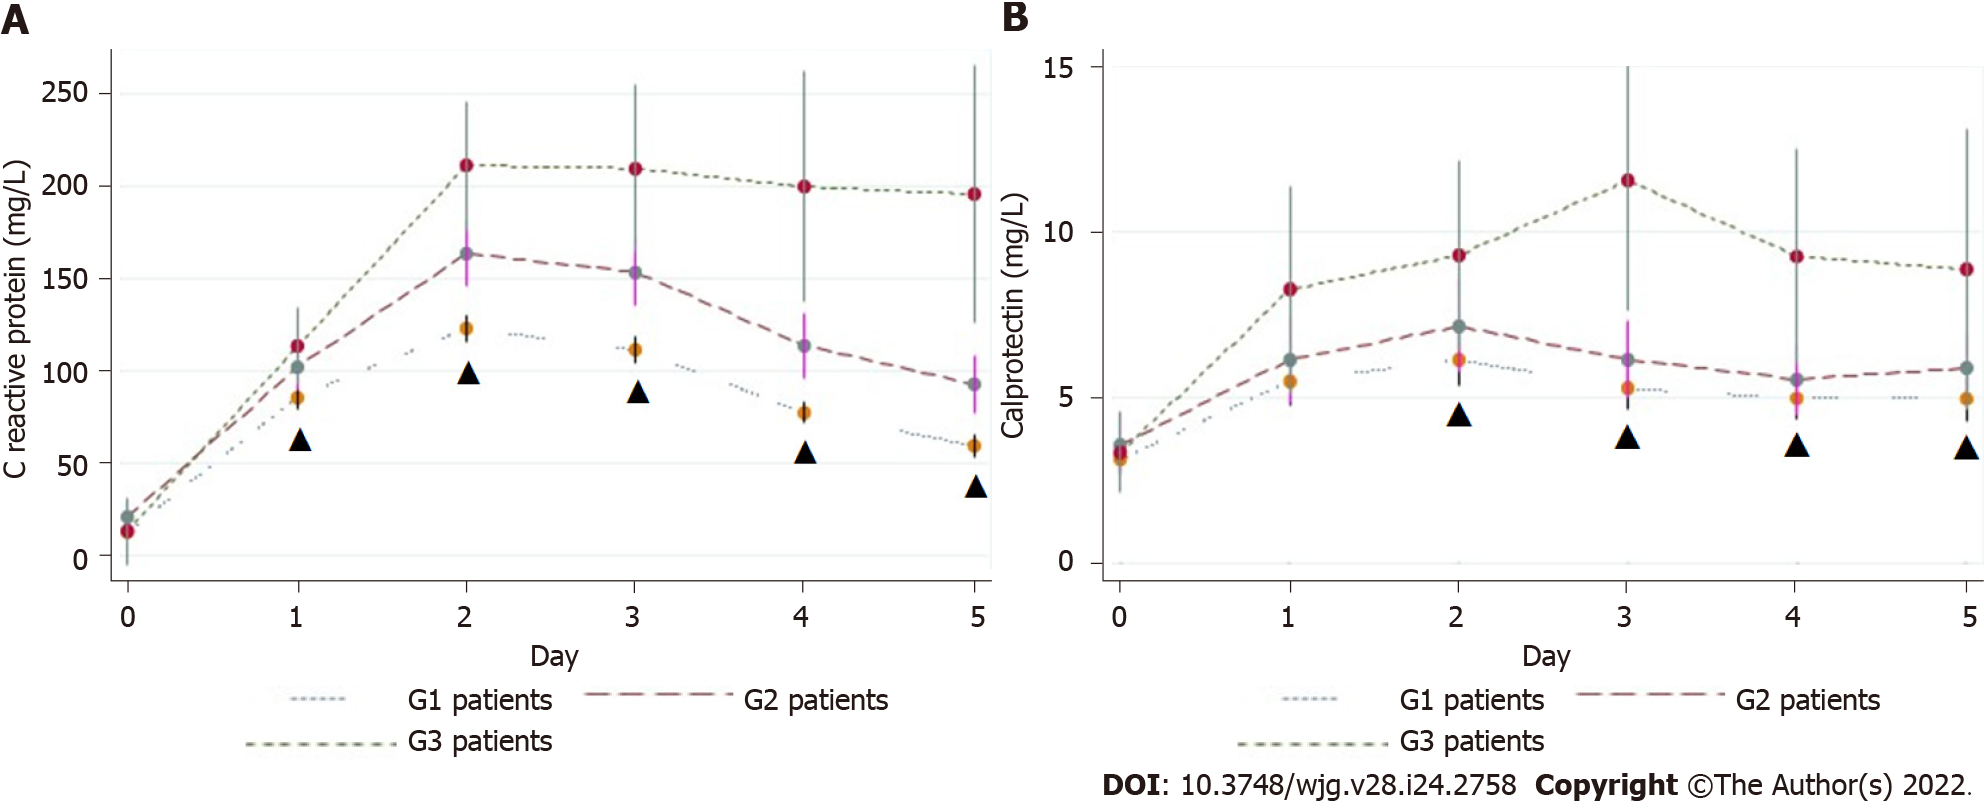
Figure 4 C-reactive protein (A) and calprotectin (B) levels.
Values are the mean ± SE. G1: No complications; G2: Complications not related to colorectal anastomotic leakage; G3: CAL; ▲: P statistically significant (P < 0.05).
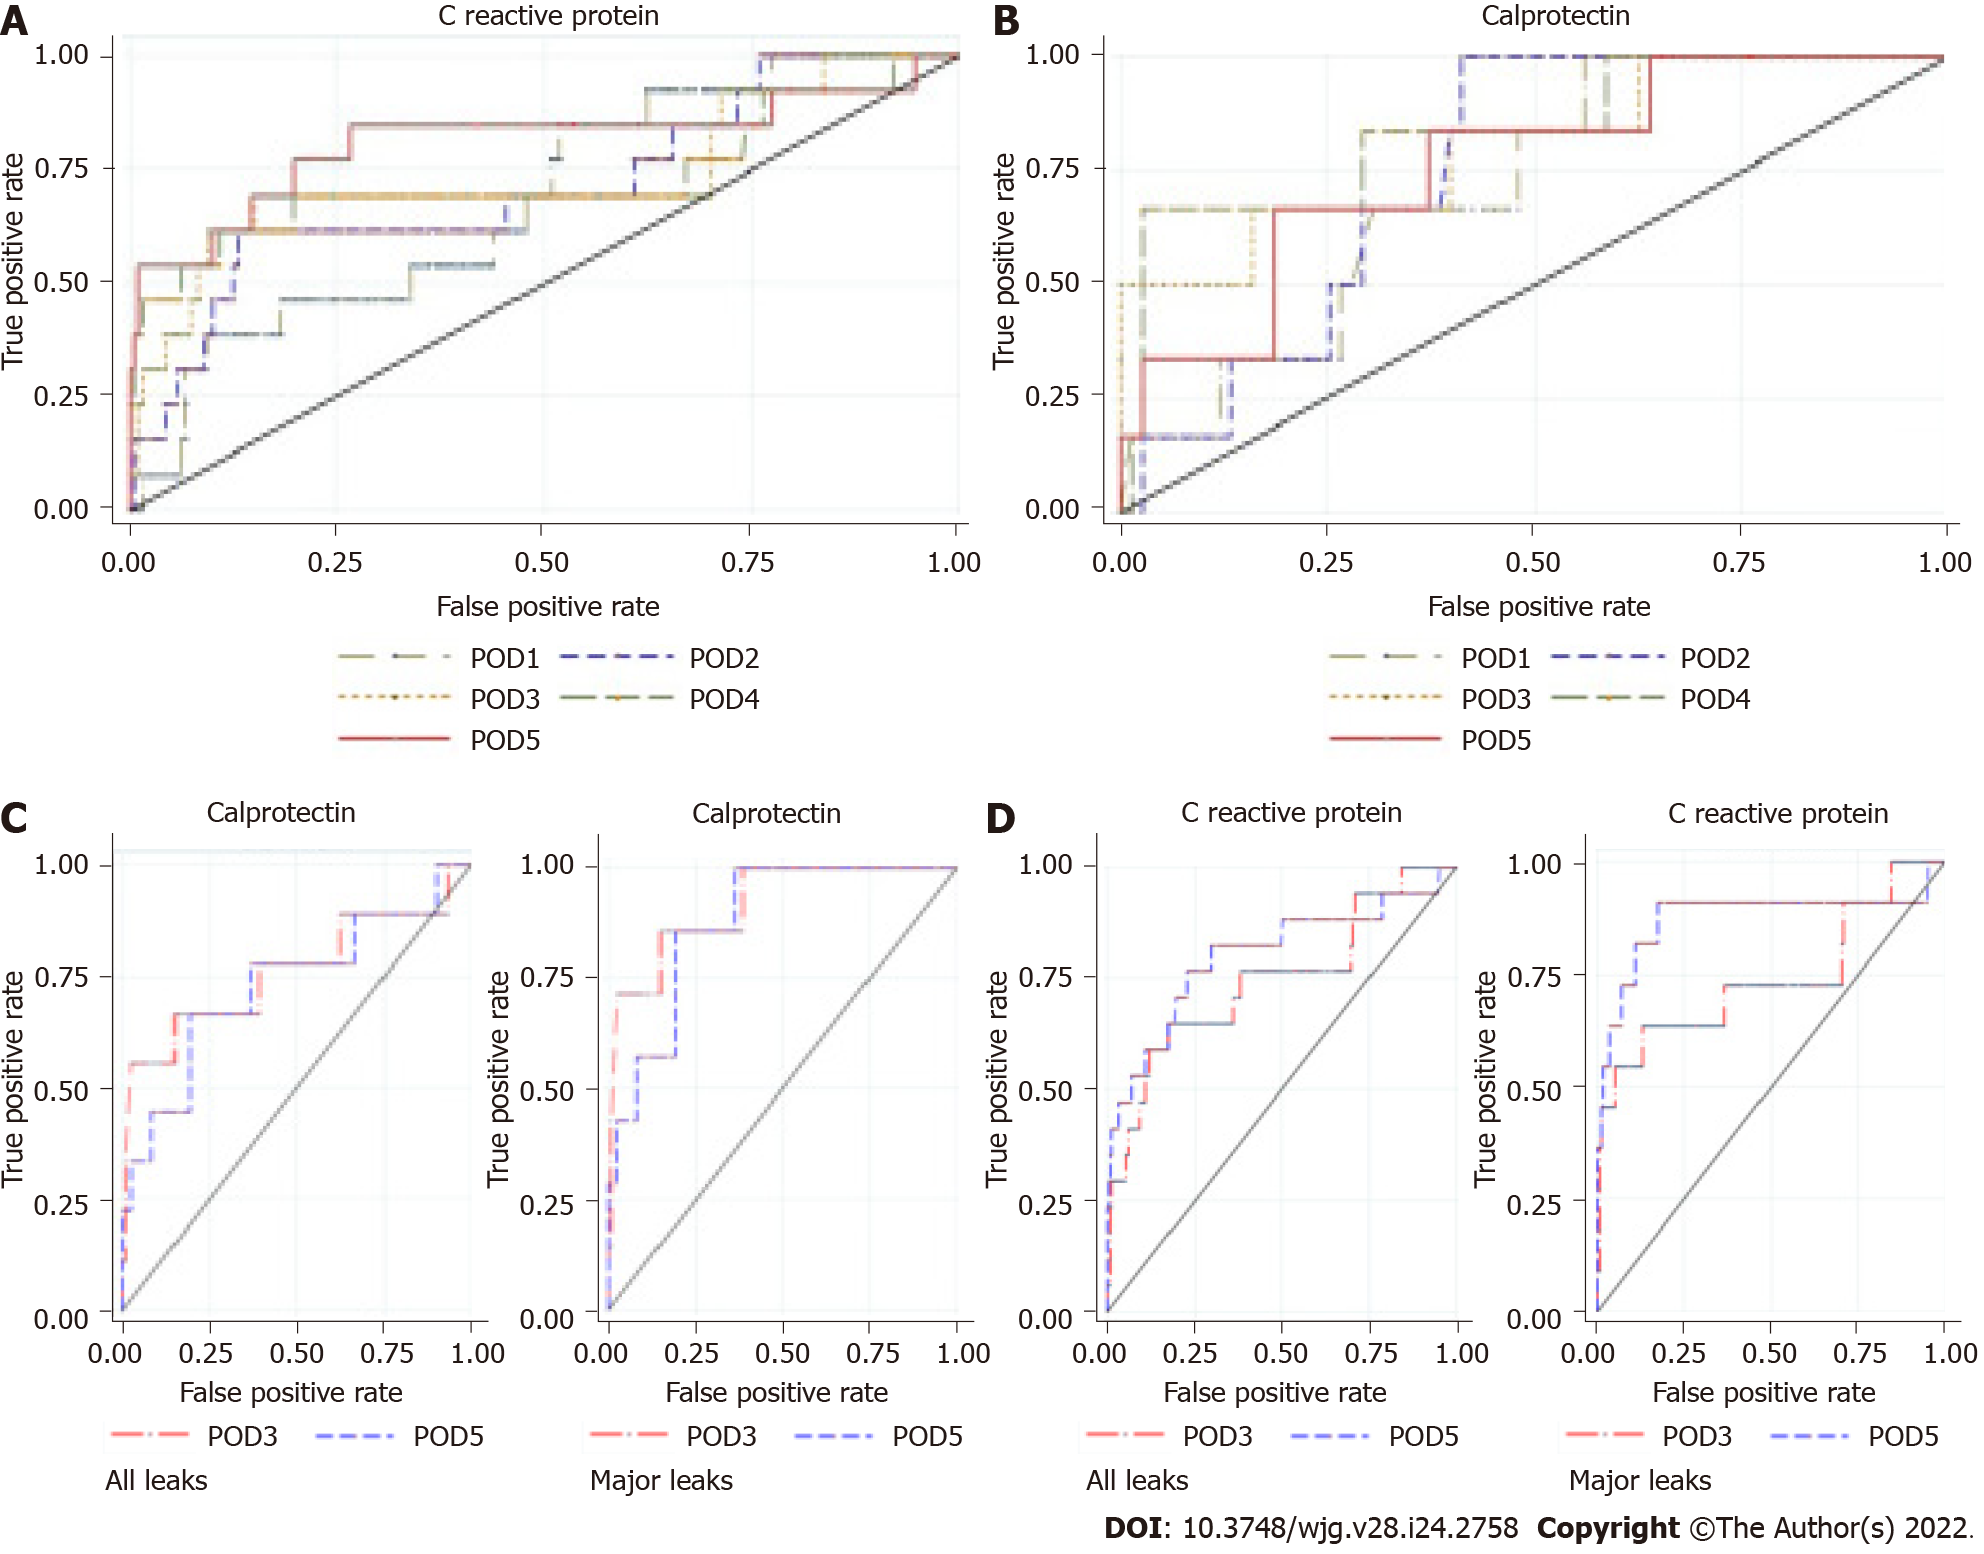
Figure 5 Area under the receiver operating characteristic curve of colorectal anastomotic leakage.
A: For C-reactive protein from postoperative day 1 to postoperative day 5; B: For calprotectin from postoperative day 1 to postoperative day 5; C: For calprotectin from postoperative day 3 to postoperative day 5; D: For C-reactive protein from postoperative day 3 to postoperative day 5. Left: All leaks; Right: Major leaks; POD: Postoperative day.
- Citation: Rama NJG, Lages MCC, Guarino MPS, Lourenço Ó, Motta Lima PC, Parente D, Silva CSG, Castro R, Bento A, Rocha A, Castro-Pocas F, Pimentel J. Usefulness of serum C-reactive protein and calprotectin for the early detection of colorectal anastomotic leakage: A prospective observational study. World J Gastroenterol 2022; 28(24): 2758-2774
- URL: https://www.wjgnet.com/1007-9327/full/v28/i24/2758.htm
- DOI: https://dx.doi.org/10.3748/wjg.v28.i24.2758


