Copyright
©The Author(s) 2022.
World J Gastroenterol. Jun 28, 2022; 28(24): 2733-2747
Published online Jun 28, 2022. doi: 10.3748/wjg.v28.i24.2733
Published online Jun 28, 2022. doi: 10.3748/wjg.v28.i24.2733
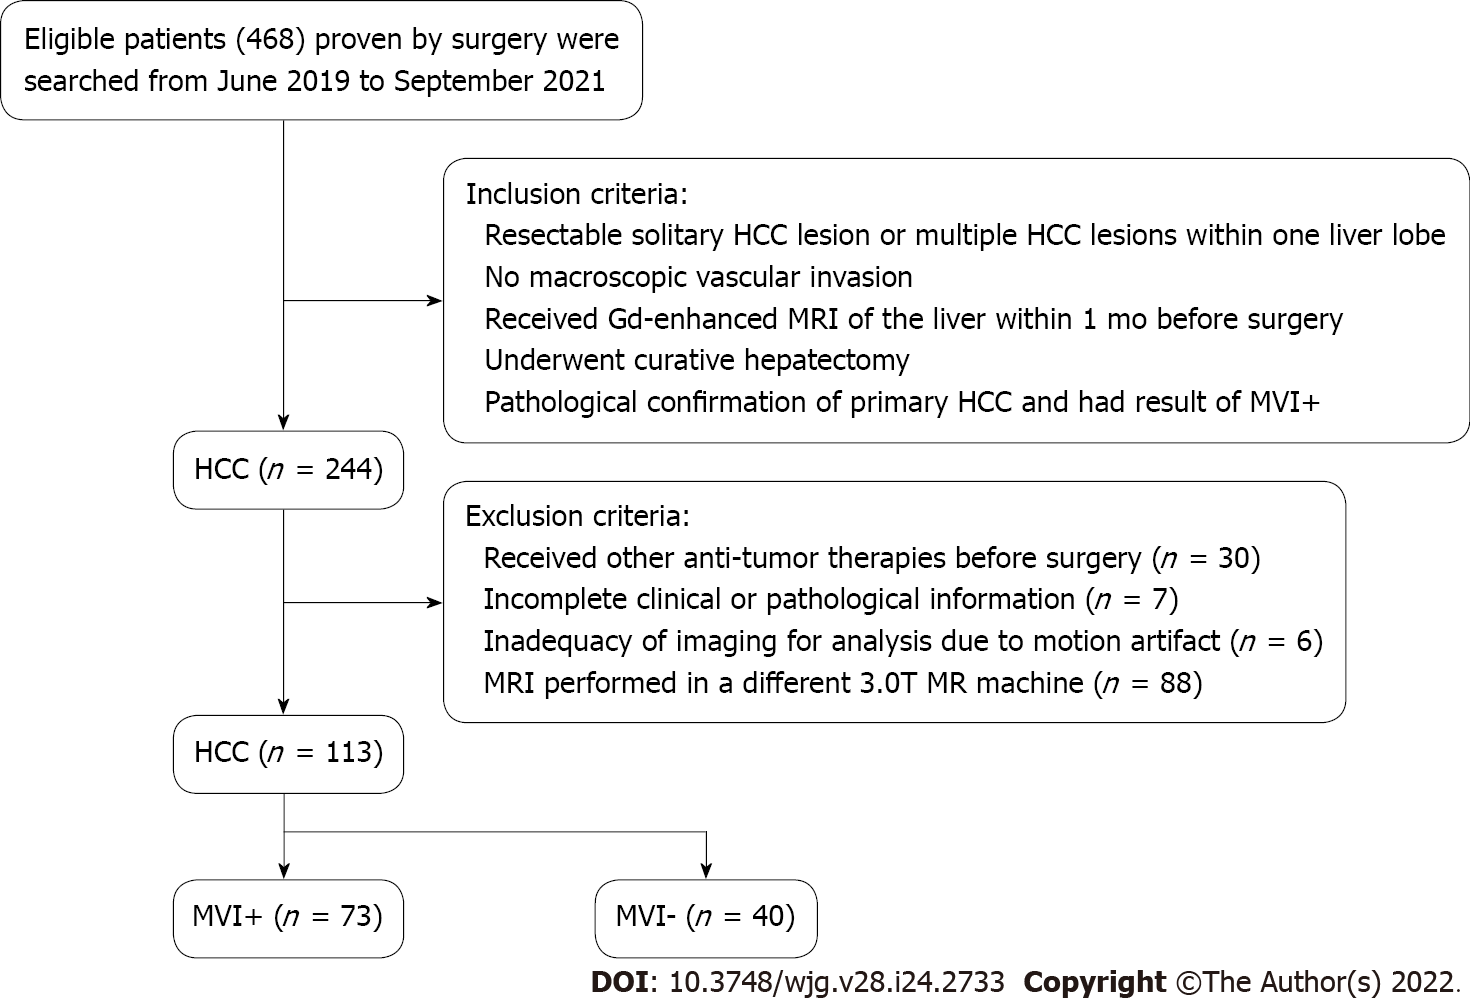
Figure 1 Flowchart of study selection process.
HCC: Hepatocellular carcinoma; MVI: Microvascular invasion.
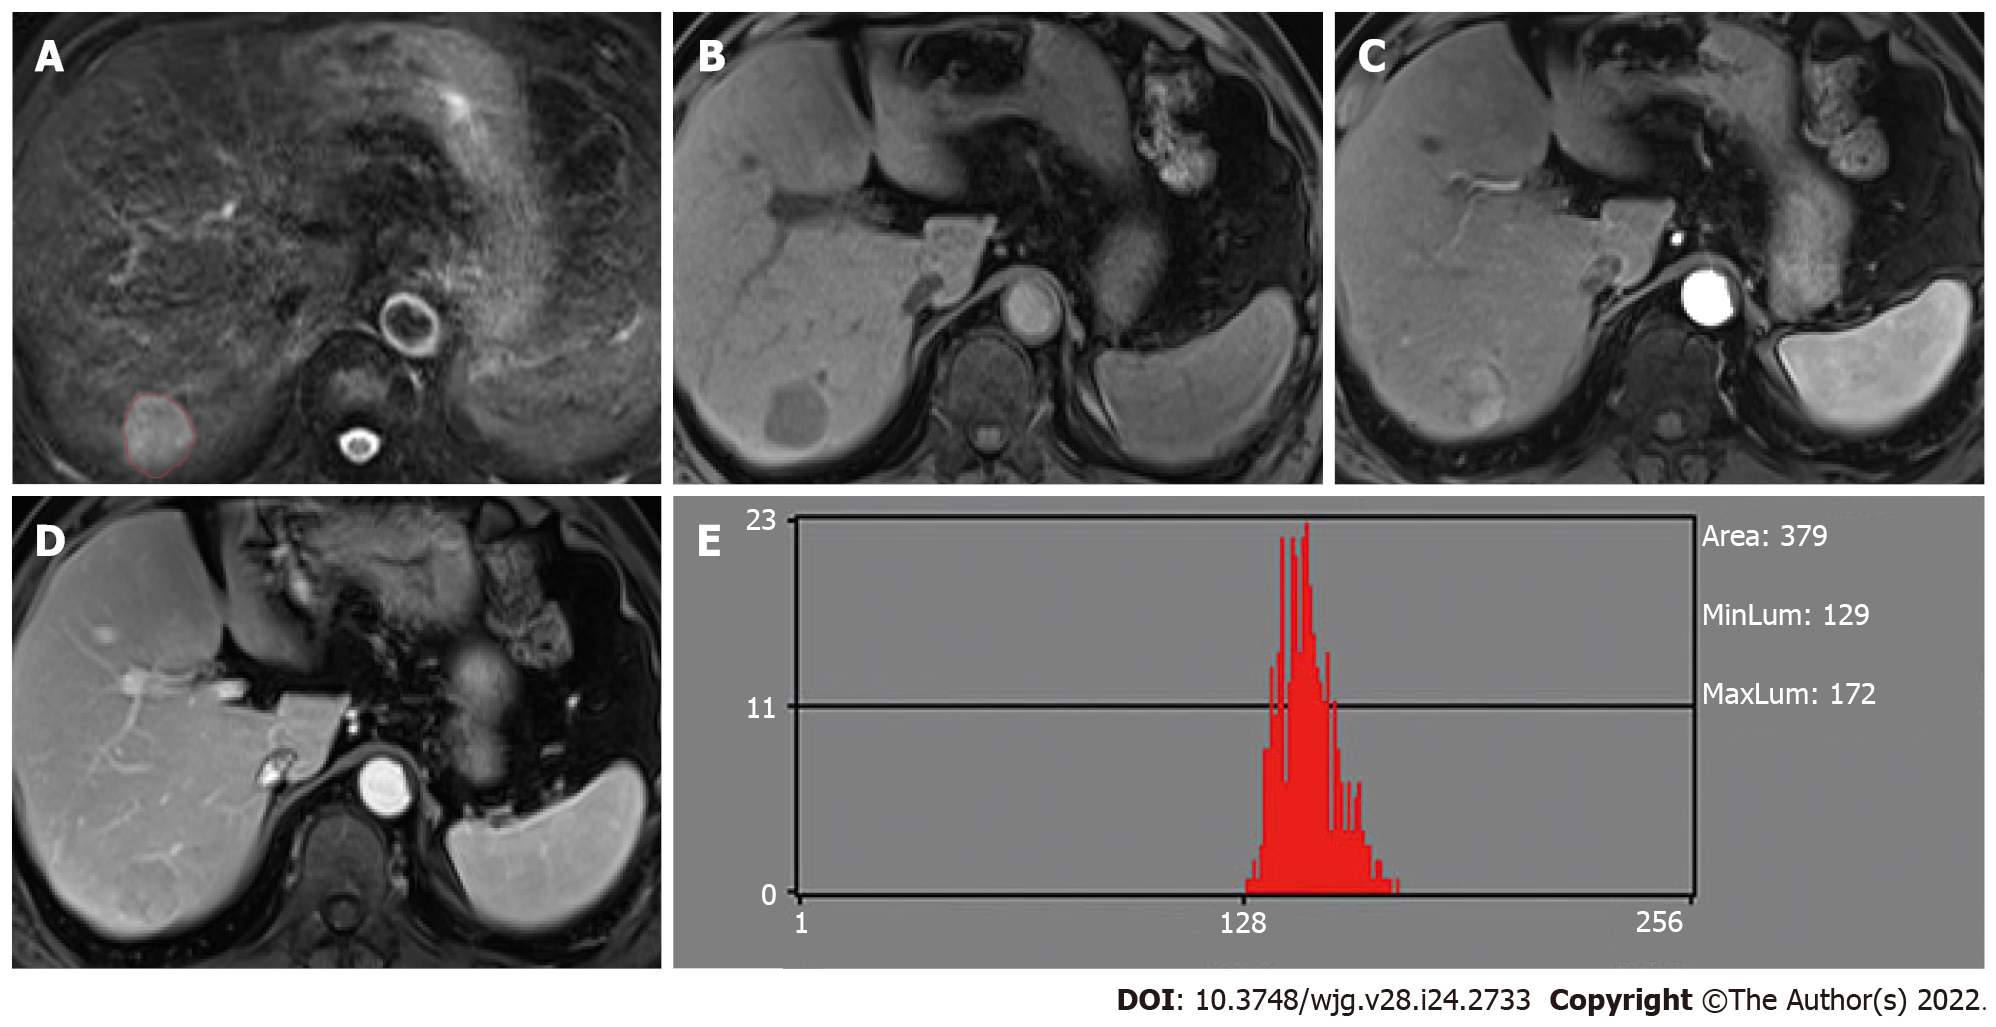
Figure 2 Hepatocellular carcinoma without microvascular invasion in a 60-year-old man.
A: The lesion showed slightly high signal intensity on T2-weighted imaging (T2WI) and was first regions of interest segmented; B: T1WI showed hypointensity; C: Hyper-enhancement in the arterial phase; D: The lesion showed wash-out in the portal venous phase; E: Histogram map derived from the portal venous phase.
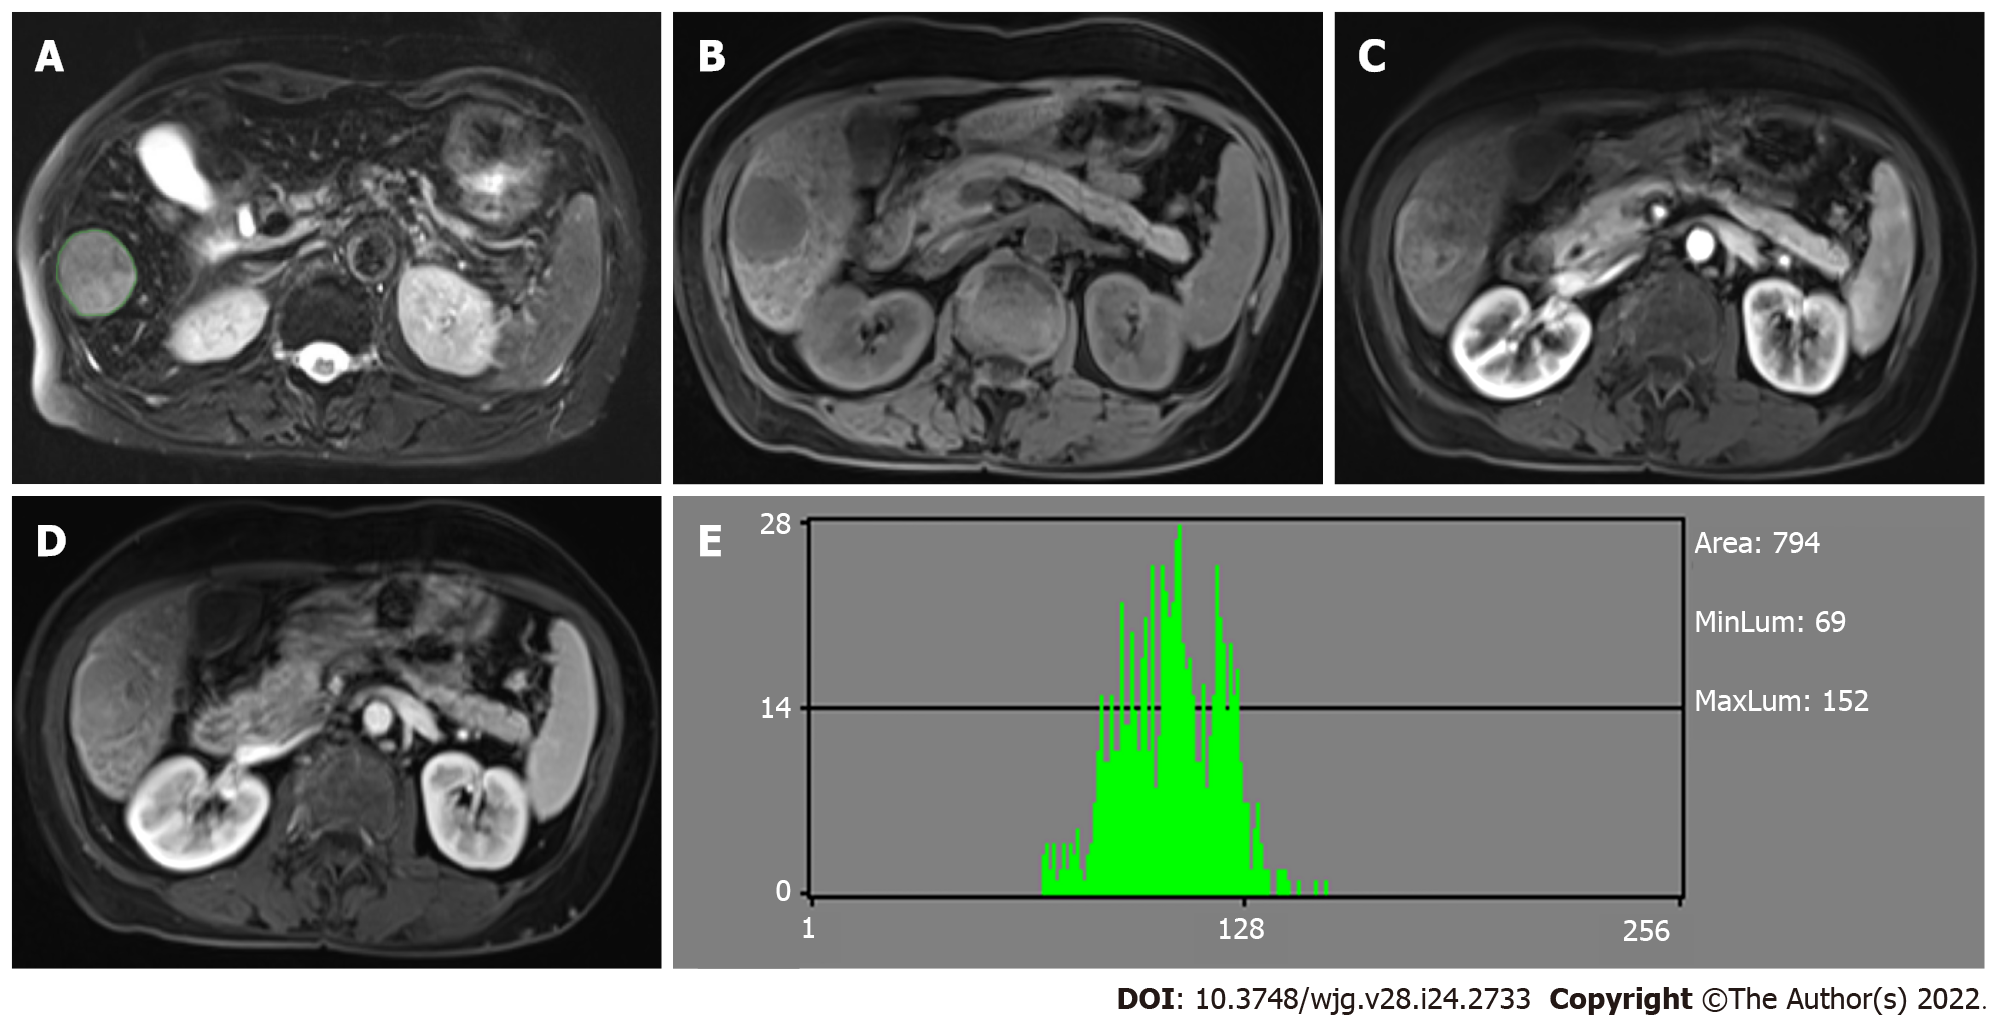
Figure 3 Hepatocellular carcinoma with microvascular invasion in a 68-year-old woman.
A: The lesion also showed slightly high signal intensity on T2-weighted imaging (T2WI) and was segmented; B: T1WI showed hypointensity; C: Hyper-enhancement in the arterial phase; D: The lesion showed wash-out in the portal venous phase; E: Histogram map derived from the portal venous phase indicating that the parameter of histogram was significantly different between the two groups.
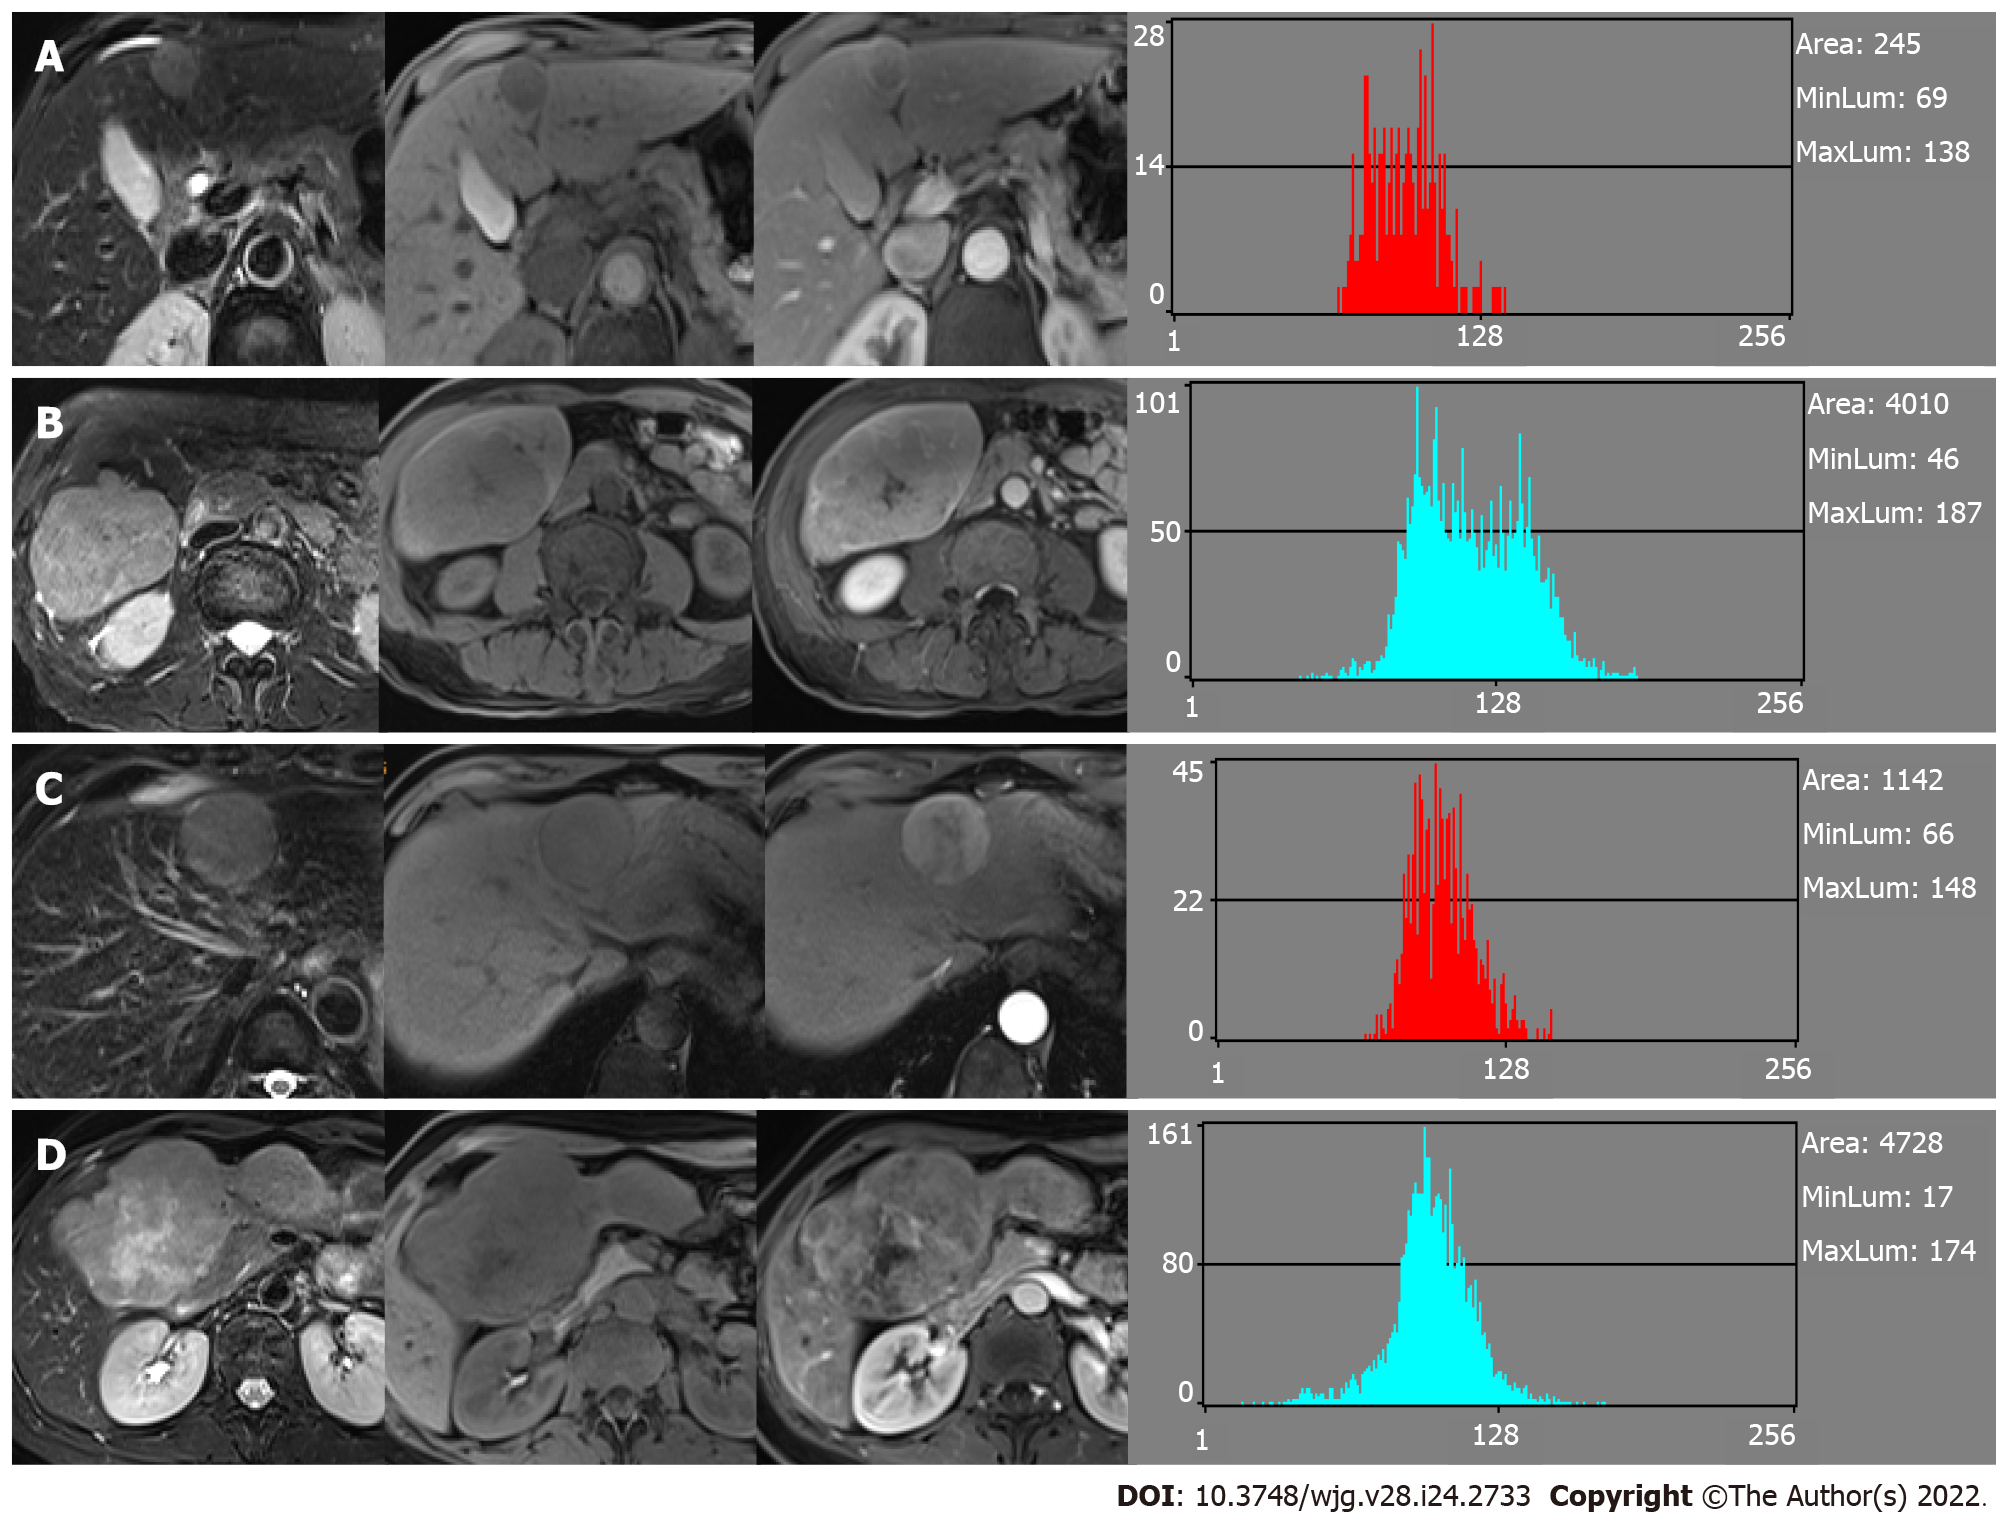
Figure 4 Similar histogram features but different most discriminant factors.
A: Hepatocellular carcinoma without microvascular invasion and the feature derived from the portal venous phase (PVP); B: Hepatocellular carcinoma with microvascular invasion and features derived from the PVP. Case B showed similar histogram features but different most discriminant factors (MDF) compared with case A; C: Hepatocellular carcinoma without microvascular invasion and features derived from the arterial phase (AP); D: Hepatocellular carcinoma with microvascular invasion and features derived from the AP. Case D showed similar histogram features but different MDF compared with case C.
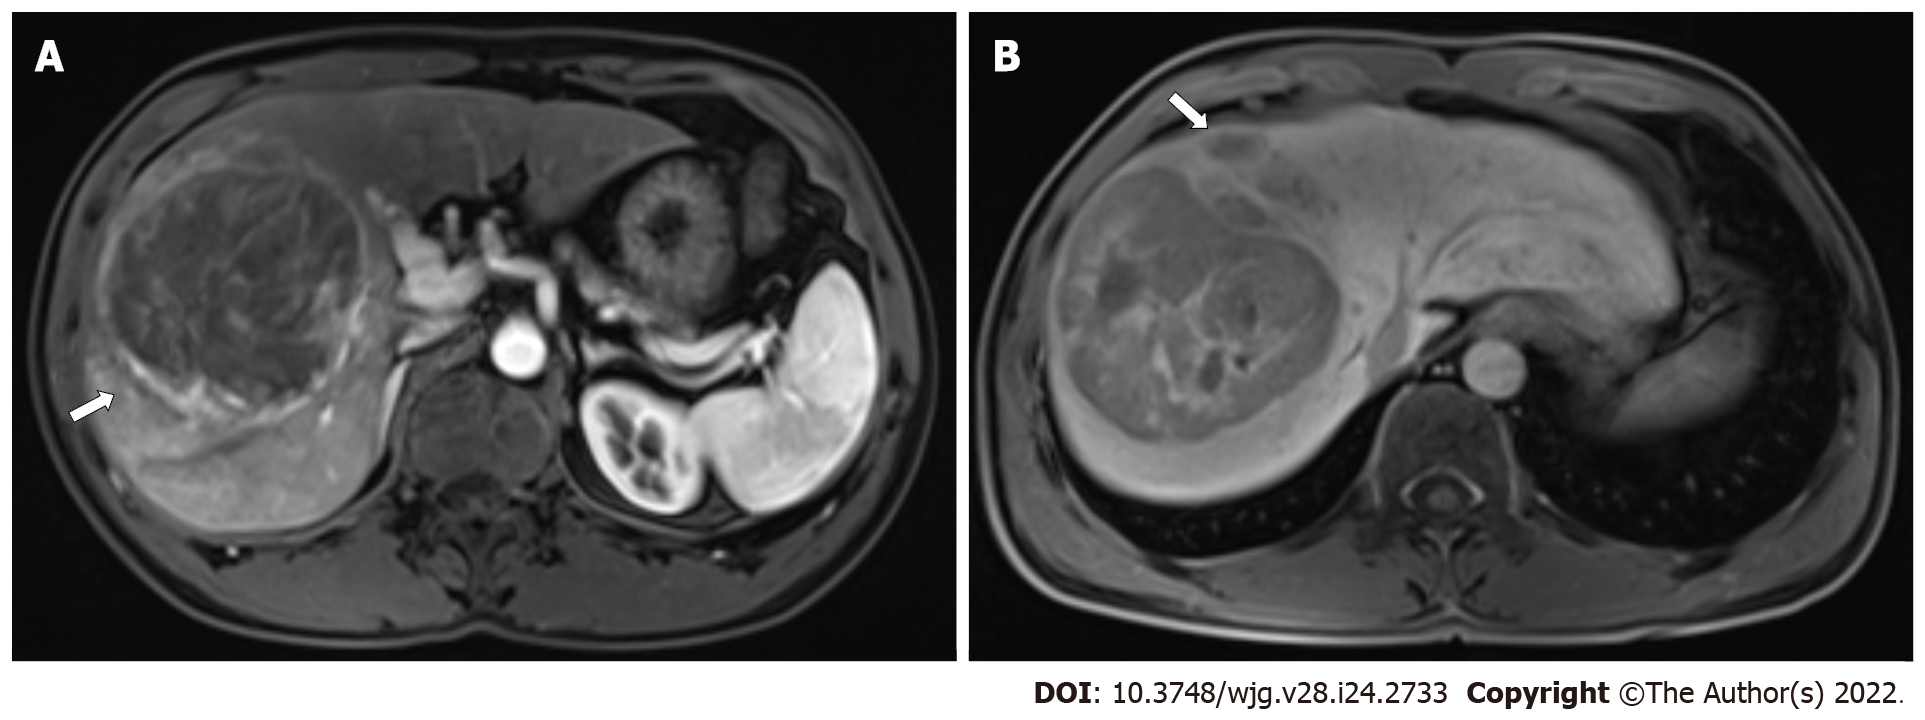
Figure 5 Hepatocellular carcinoma with microvascular invasion in a 47-year-old man.
A: Gd-enhanced arterial phase magnetic resonance imaging showed arterial rim enhancement (arrow); B: Hepatobiliary phase image showing peritumoral hypointensity (arrow).
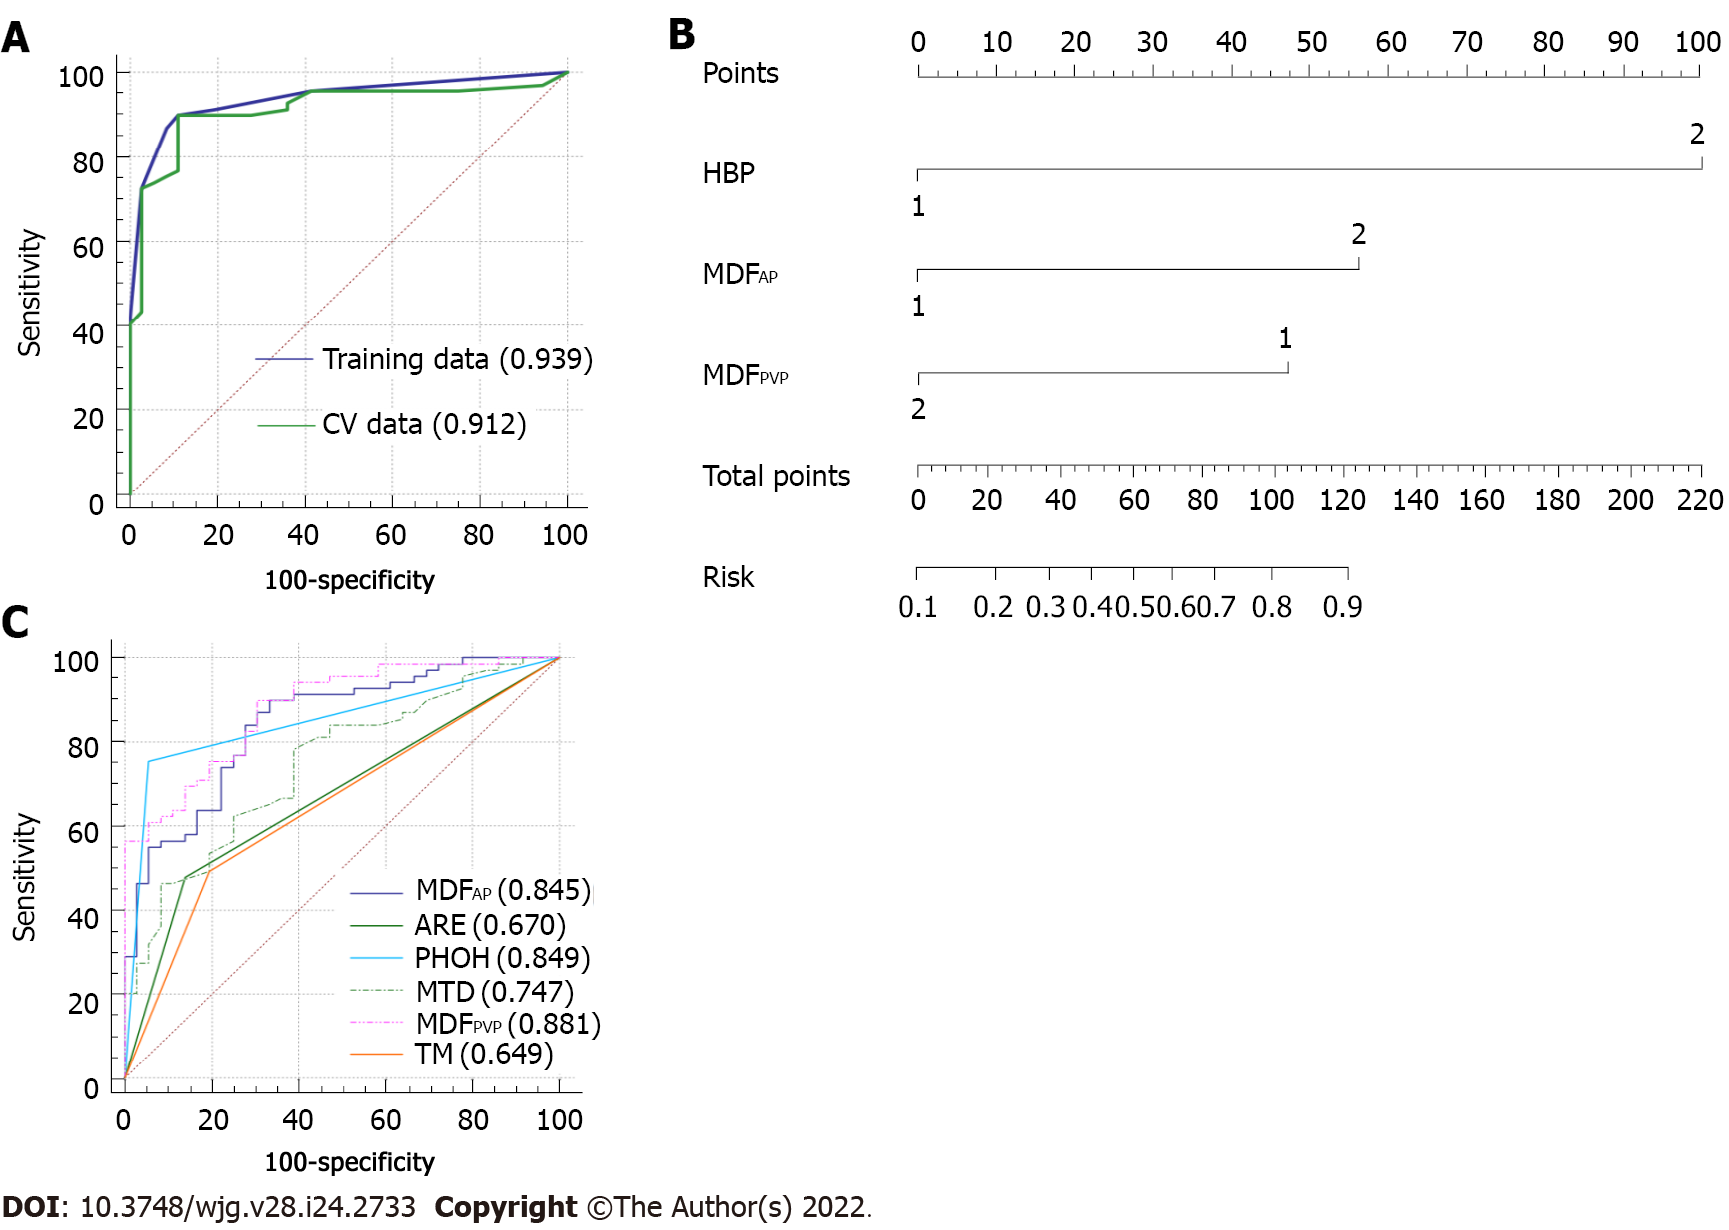
Figure 6 Area under the receiver operating characteristic curve of the final model.
A: Receiver operating characteristic (ROC) curves of the selected model and the ROC curve of the 5-fold cross-validation; B: Nomogram of the integrated model. Hepatobiliary phase (HBP) means peritumoral hypointensity in the HBP, most discriminant factor (MDF)AP means the MDF of the arterial phase, and MDFPVP means the MDF of the portal venous phase; C: Comparison of ROC curves for prediction of microvascular invasion. The area under the ROC curve (AUC) was largest for the MDFPVP alone (AUC = 0.881). ARE: Arterial rim enhancement; MTD: Maximum tumor diameter; PHOH: Peritumoral hypointensity in the HBP; TM: Tumor margin.
- Citation: Li YM, Zhu YM, Gao LM, Han ZW, Chen XJ, Yan C, Ye RP, Cao DR. Radiomic analysis based on multi-phase magnetic resonance imaging to predict preoperatively microvascular invasion in hepatocellular carcinoma. World J Gastroenterol 2022; 28(24): 2733-2747
- URL: https://www.wjgnet.com/1007-9327/full/v28/i24/2733.htm
- DOI: https://dx.doi.org/10.3748/wjg.v28.i24.2733


