Copyright
©The Author(s) 2022.
World J Gastroenterol. Jun 21, 2022; 28(23): 2609-2624
Published online Jun 21, 2022. doi: 10.3748/wjg.v28.i23.2609
Published online Jun 21, 2022. doi: 10.3748/wjg.v28.i23.2609
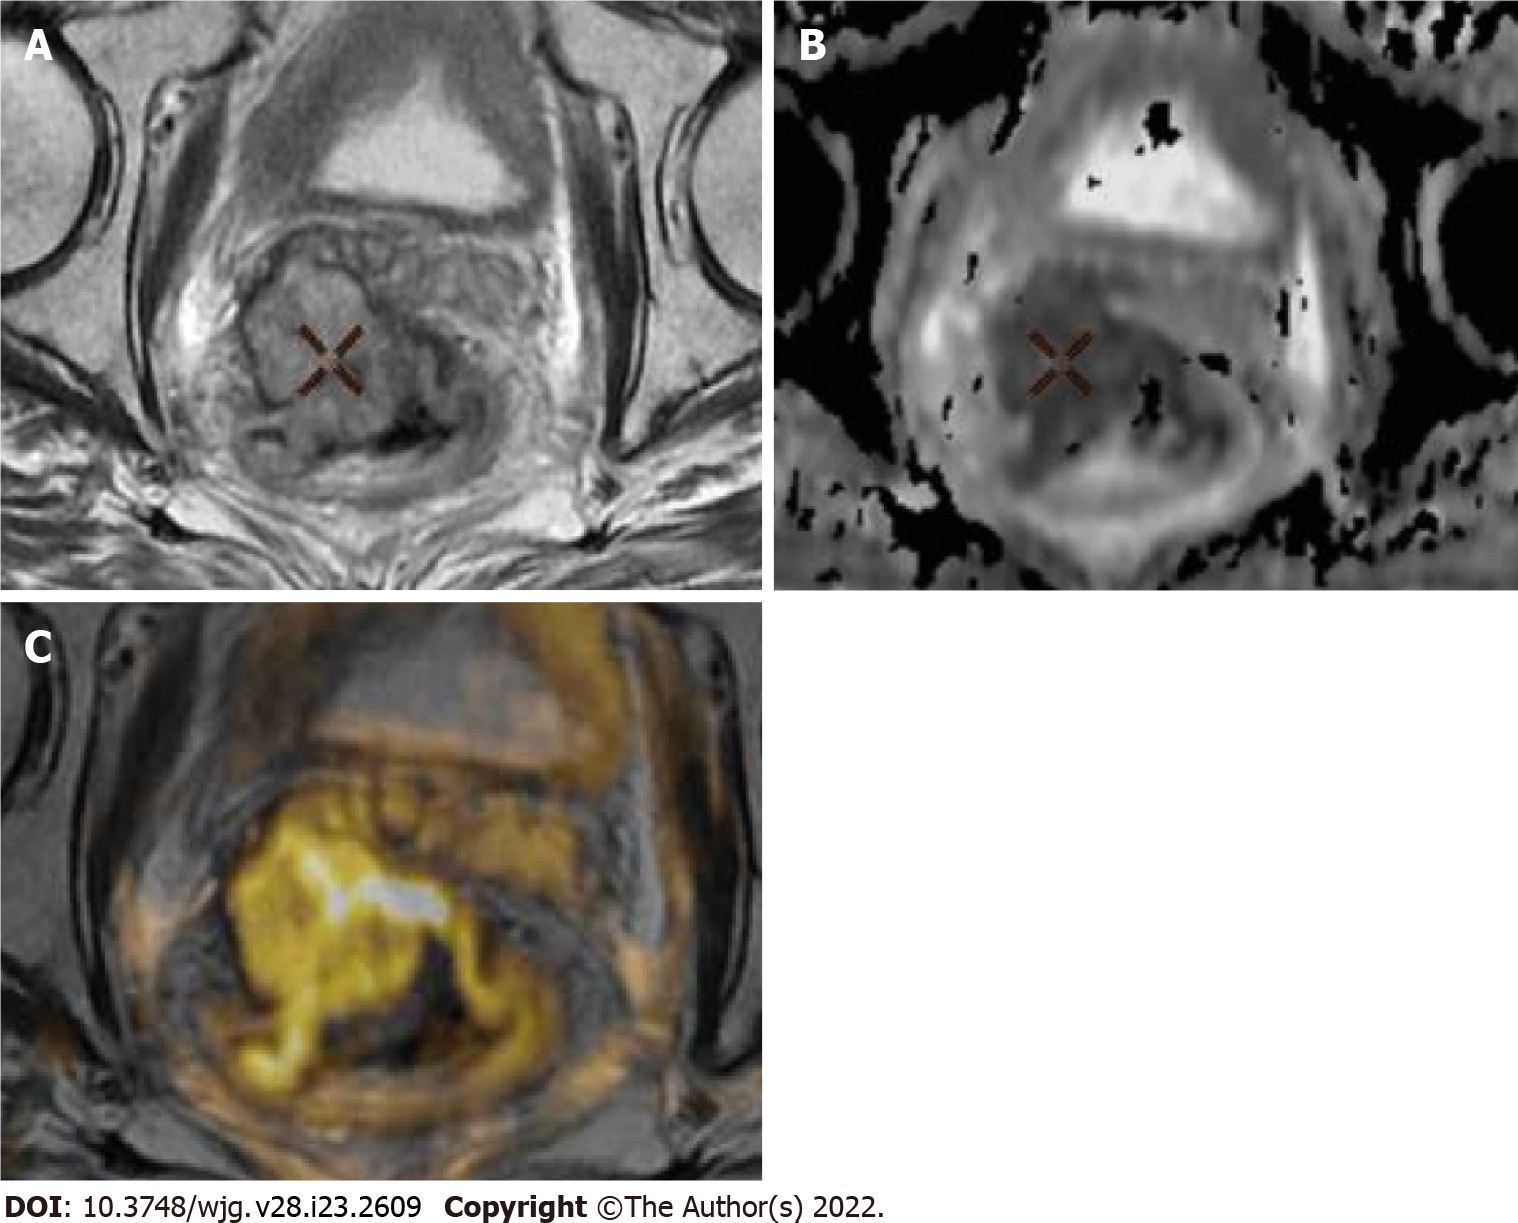
Figure 1 Representative images of magnetic resonance imaging protocol.
A-C: Axial T2 (A), apparent diffusion coefficient (ADC) map and T2 fusion ADC map color (B) and images of bulky tumor (C), showing tumor extending more than 5 mm into the mesorectal fat and invading the mesorectal fascia.
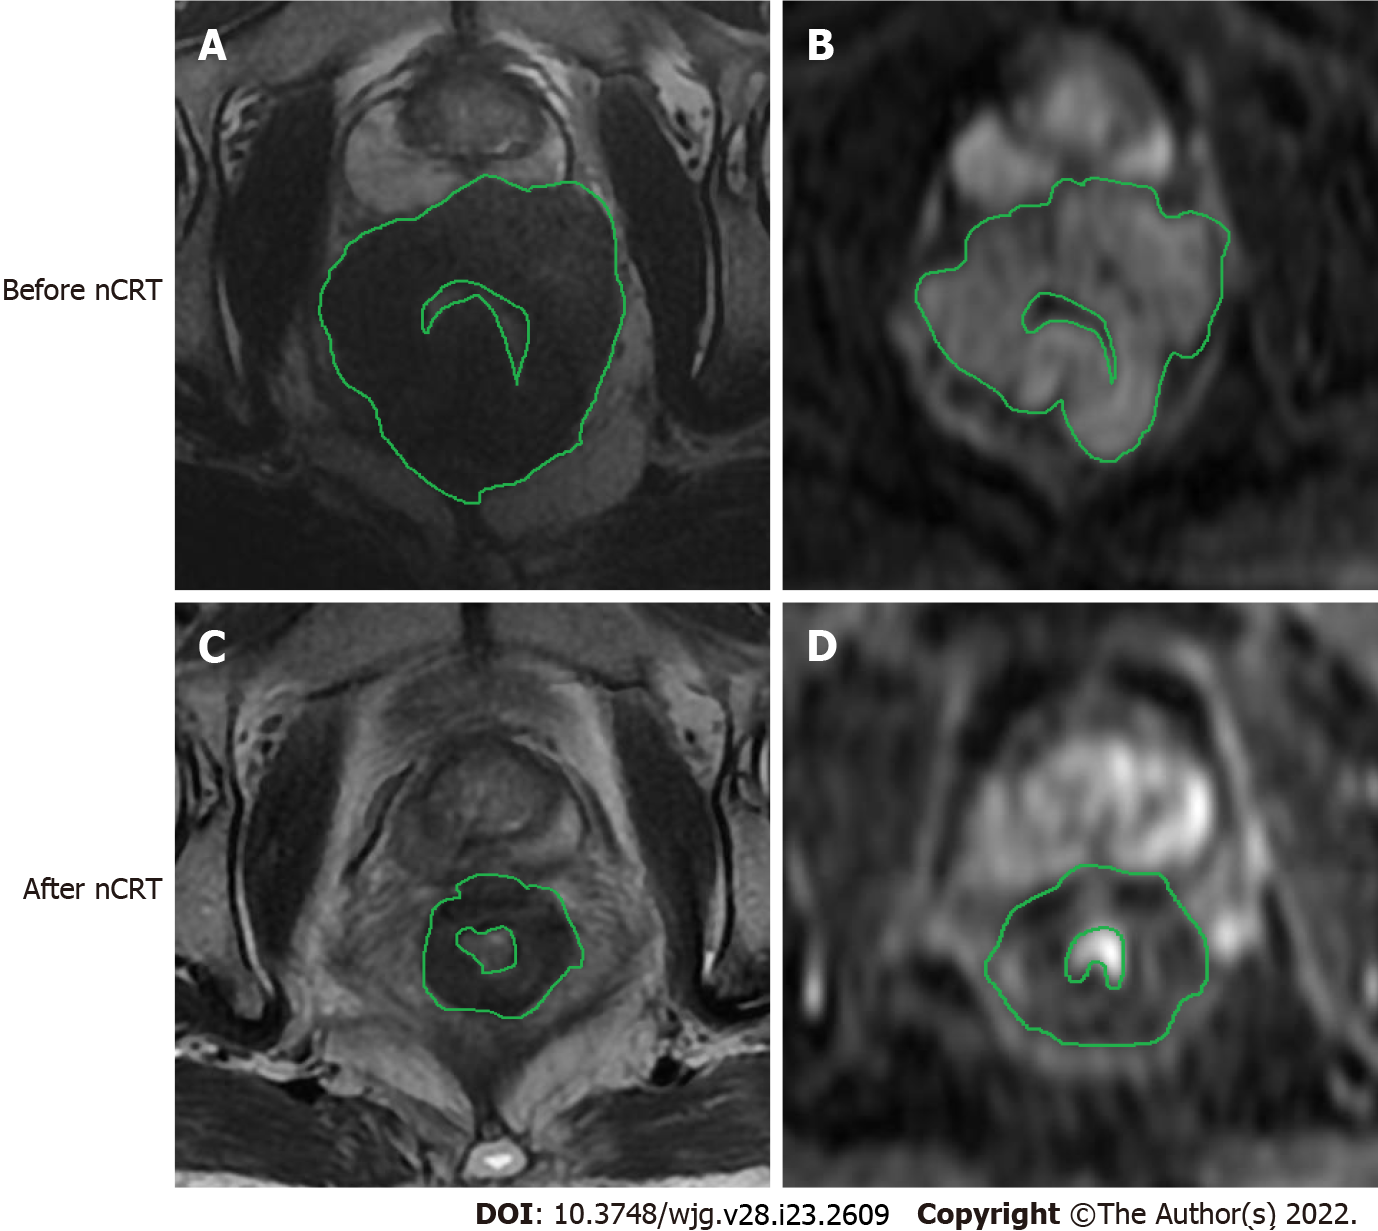
Figure 2 Images of rectal tumor before and after neoadjuvant chemoradiation therapy.
A, C: T2-weighted magnetic resonance images obtained in 67-year-old man with a rectal tumor (histopathologic response Ryan 1) to evaluate tumor volume; B, D: Diffusion-weighted images (DWI) that were obtained from the same case. As we can see in the present case, regions of interest were drawn manually slice by slice on DWI images along the edge of the lesion to cover as much tumor area as possible without excluding cystic or necrotic areas. nCRT: Neoadjuvant chemoradiation therapy.
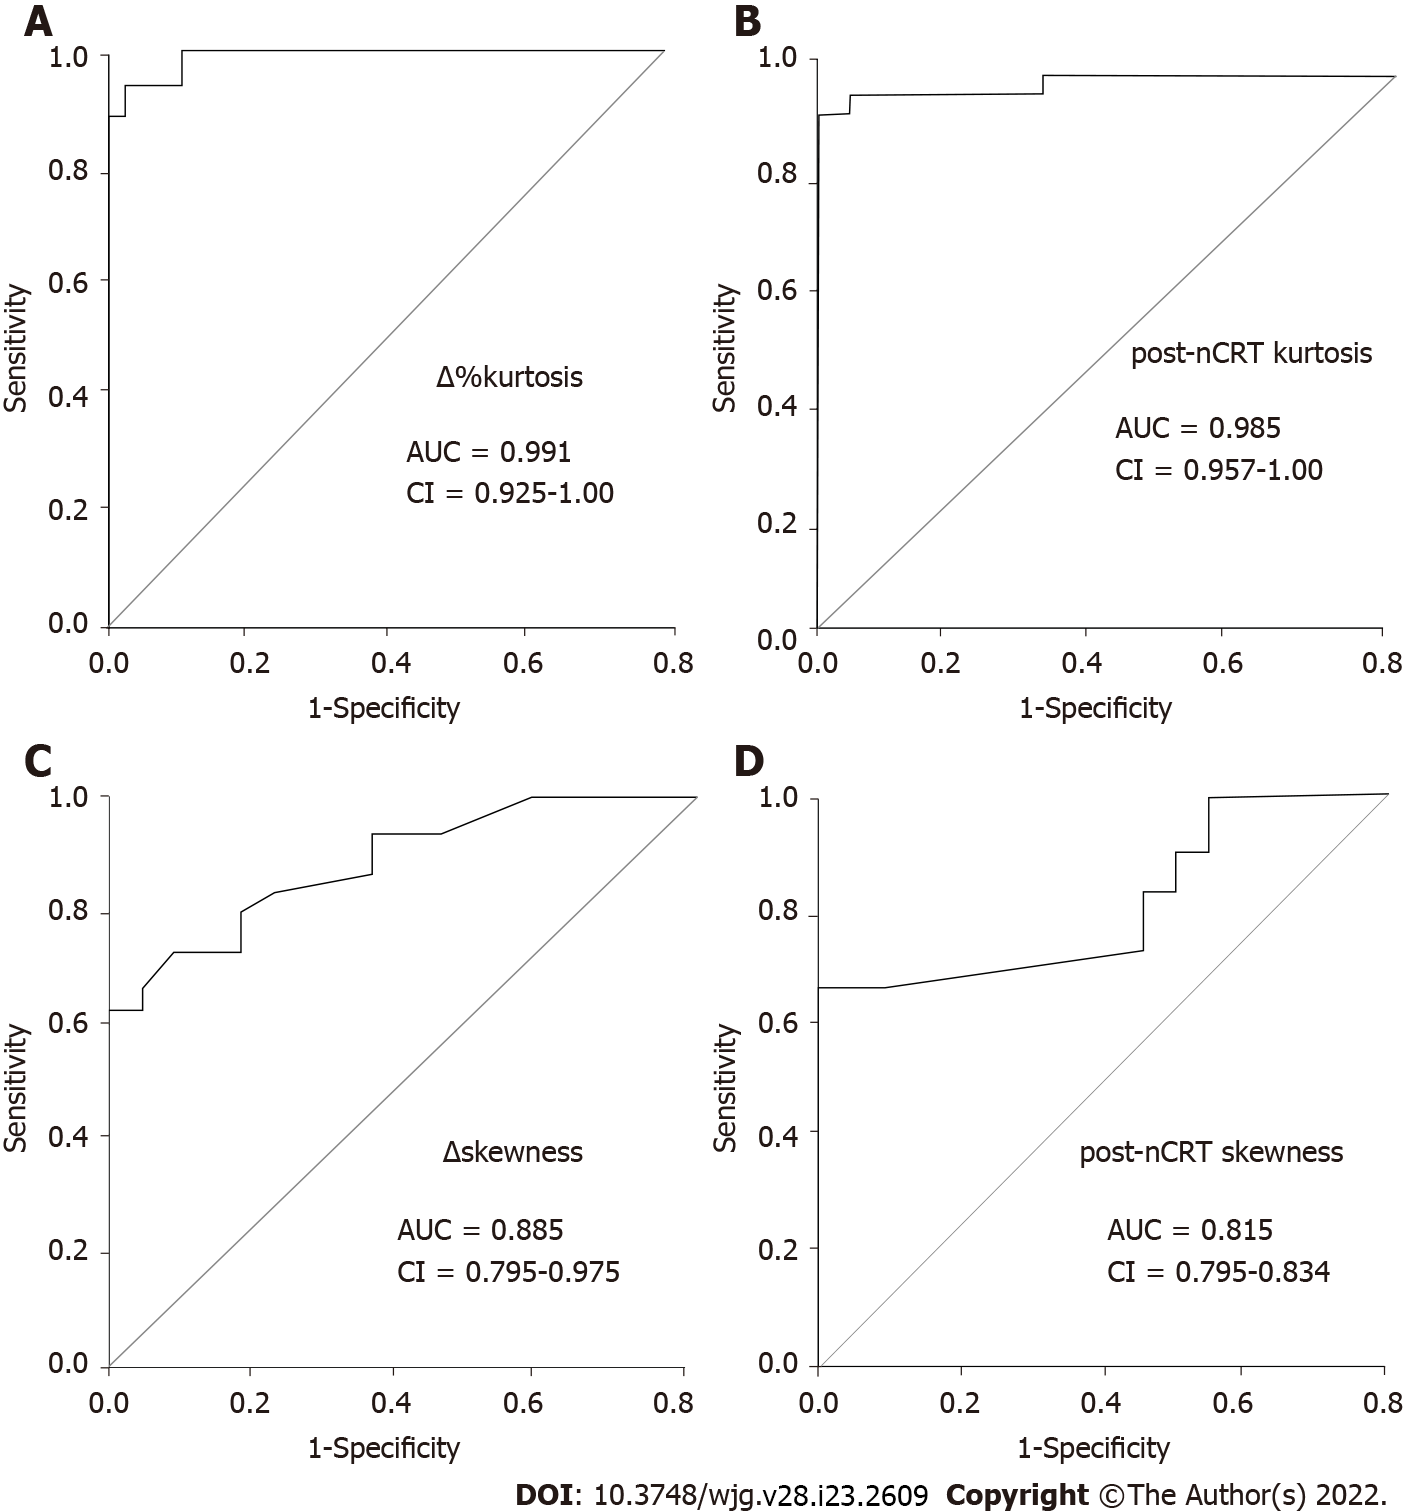
Figure 3 Receiver operating characteristic curves displaying the diagnostic performances of the four histogram parameters derived from apparent diffusion coefficient values with the highest accuracy.
A: ∆%kurtosis; B: Post-neoadjuvant chemoradiation therapy (nCRT) kurtosis; C: ∆skewness; D: Post-nCRT skewness. AUC: Area under the receiver operating characteristic curve.
- Citation: Jiménez de los Santos ME, Reyes-Pérez JA, Domínguez Osorio V, Villaseñor-Navarro Y, Moreno-Astudillo L, Vela-Sarmiento I, Sollozo-Dupont I. Whole lesion histogram analysis of apparent diffusion coefficient predicts therapy response in locally advanced rectal cancer. World J Gastroenterol 2022; 28(23): 2609-2624
- URL: https://www.wjgnet.com/1007-9327/full/v28/i23/2609.htm
- DOI: https://dx.doi.org/10.3748/wjg.v28.i23.2609


