Copyright
©The Author(s) 2022.
World J Gastroenterol. Jun 14, 2022; 28(22): 2468-2481
Published online Jun 14, 2022. doi: 10.3748/wjg.v28.i22.2468
Published online Jun 14, 2022. doi: 10.3748/wjg.v28.i22.2468
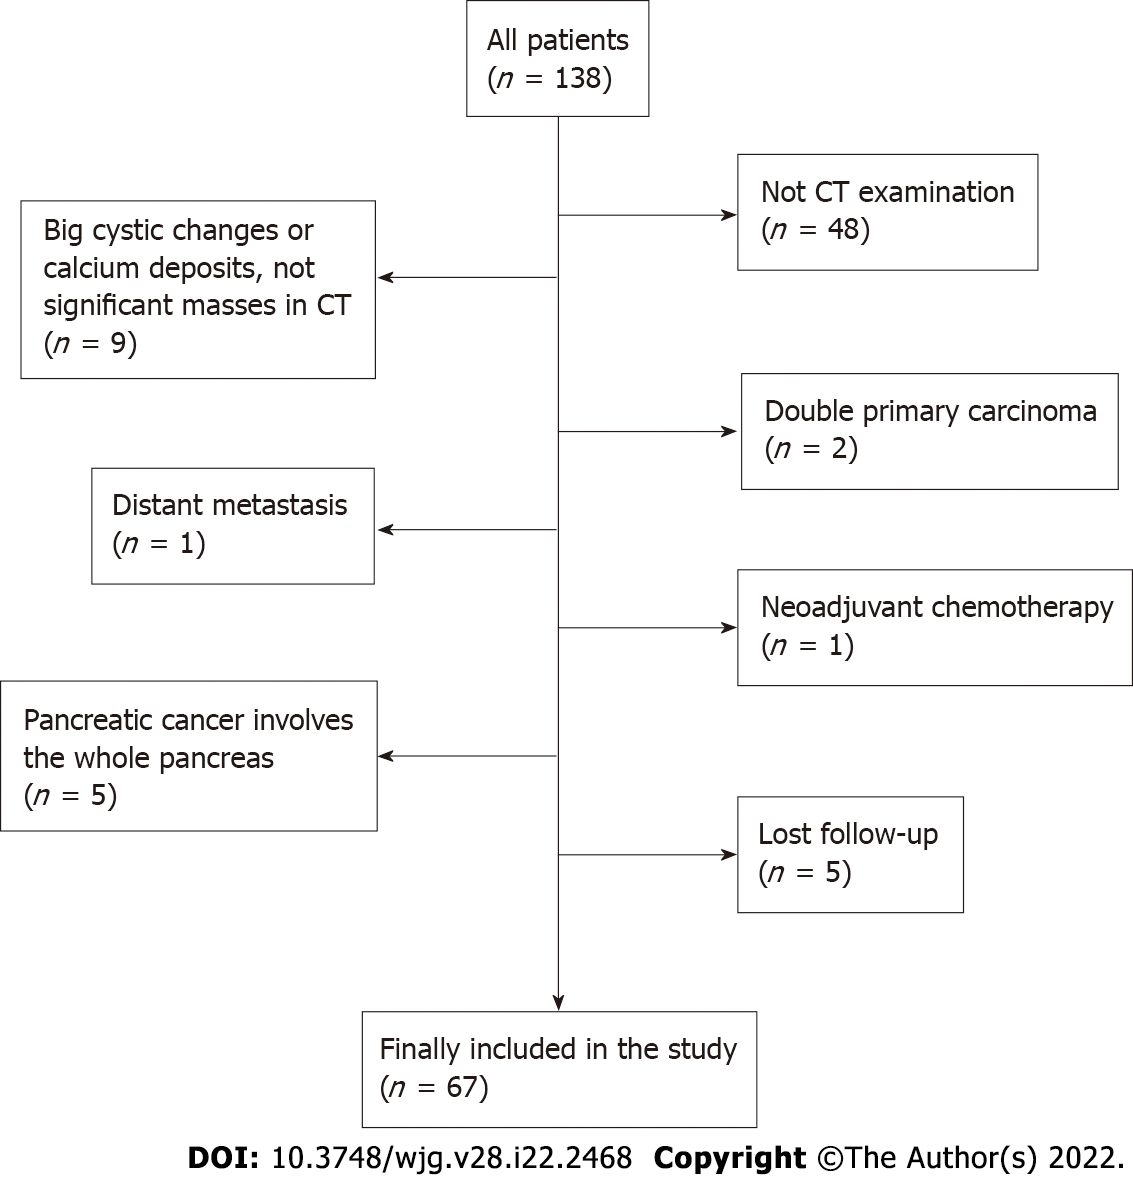
Figure 1 The study flowchart for patient selection.
CT: Computed tomography.
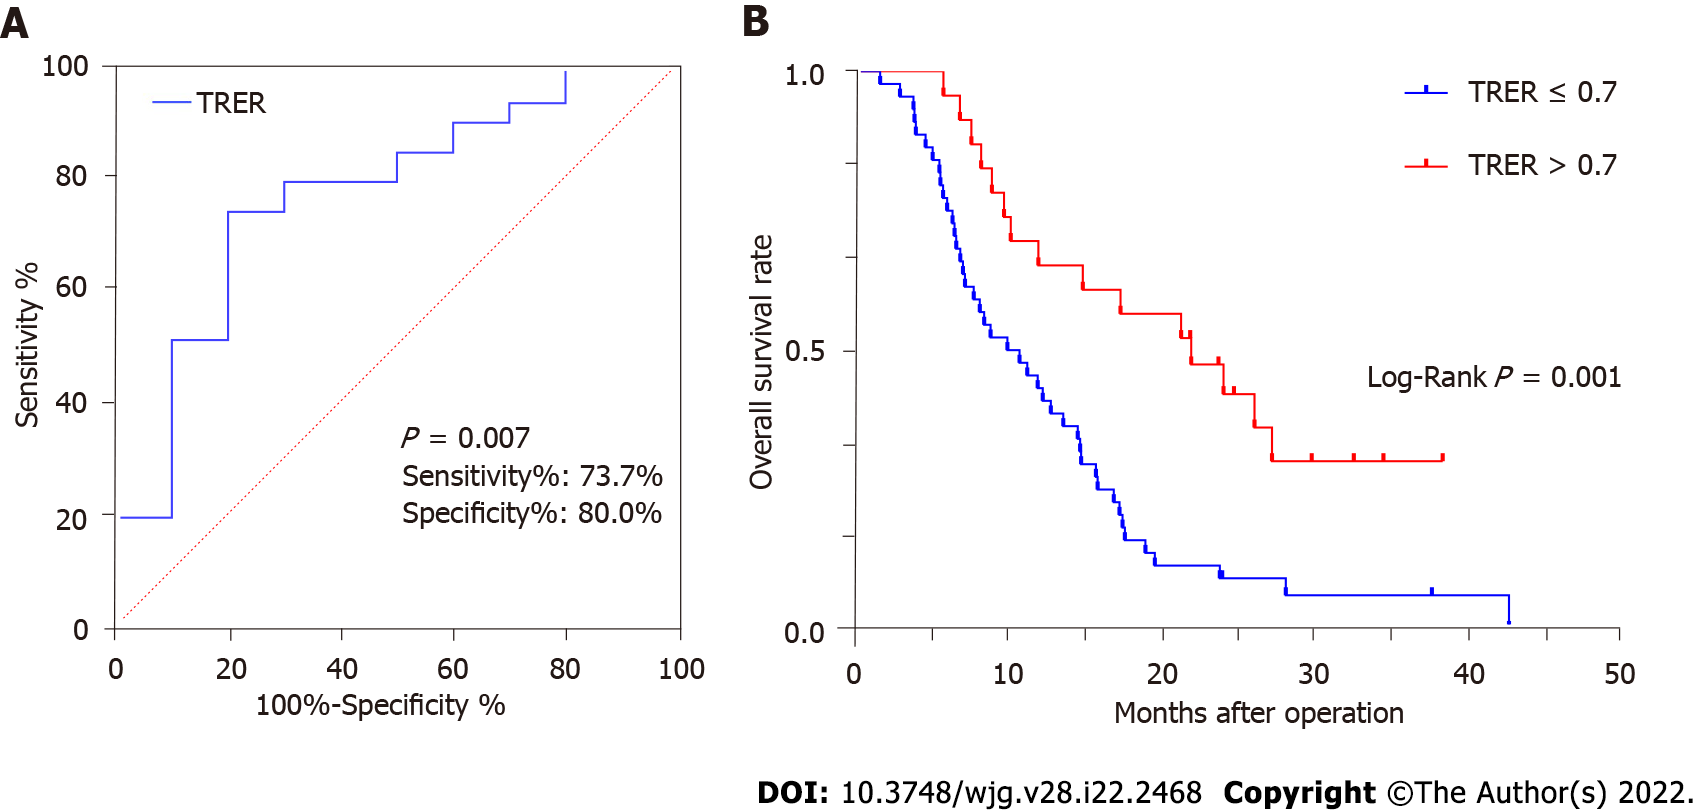
Figure 2 The receiver operating characteristic curve and Kaplan-Meier survival curve analysis.
A: The receiver operating characteristic curve of tumour relative enhancement ratio (TRER) for patients with pancreatic ductal adenocarcinoma. The area under the curve was 0.768 (P = 0.007). The cut-off value was 0.7; B: Kaplan-Meier survival curve of postoperative overall survival for low-TRER patients and high-TRER patients. TRER: Tumour relative enhancement ratio.
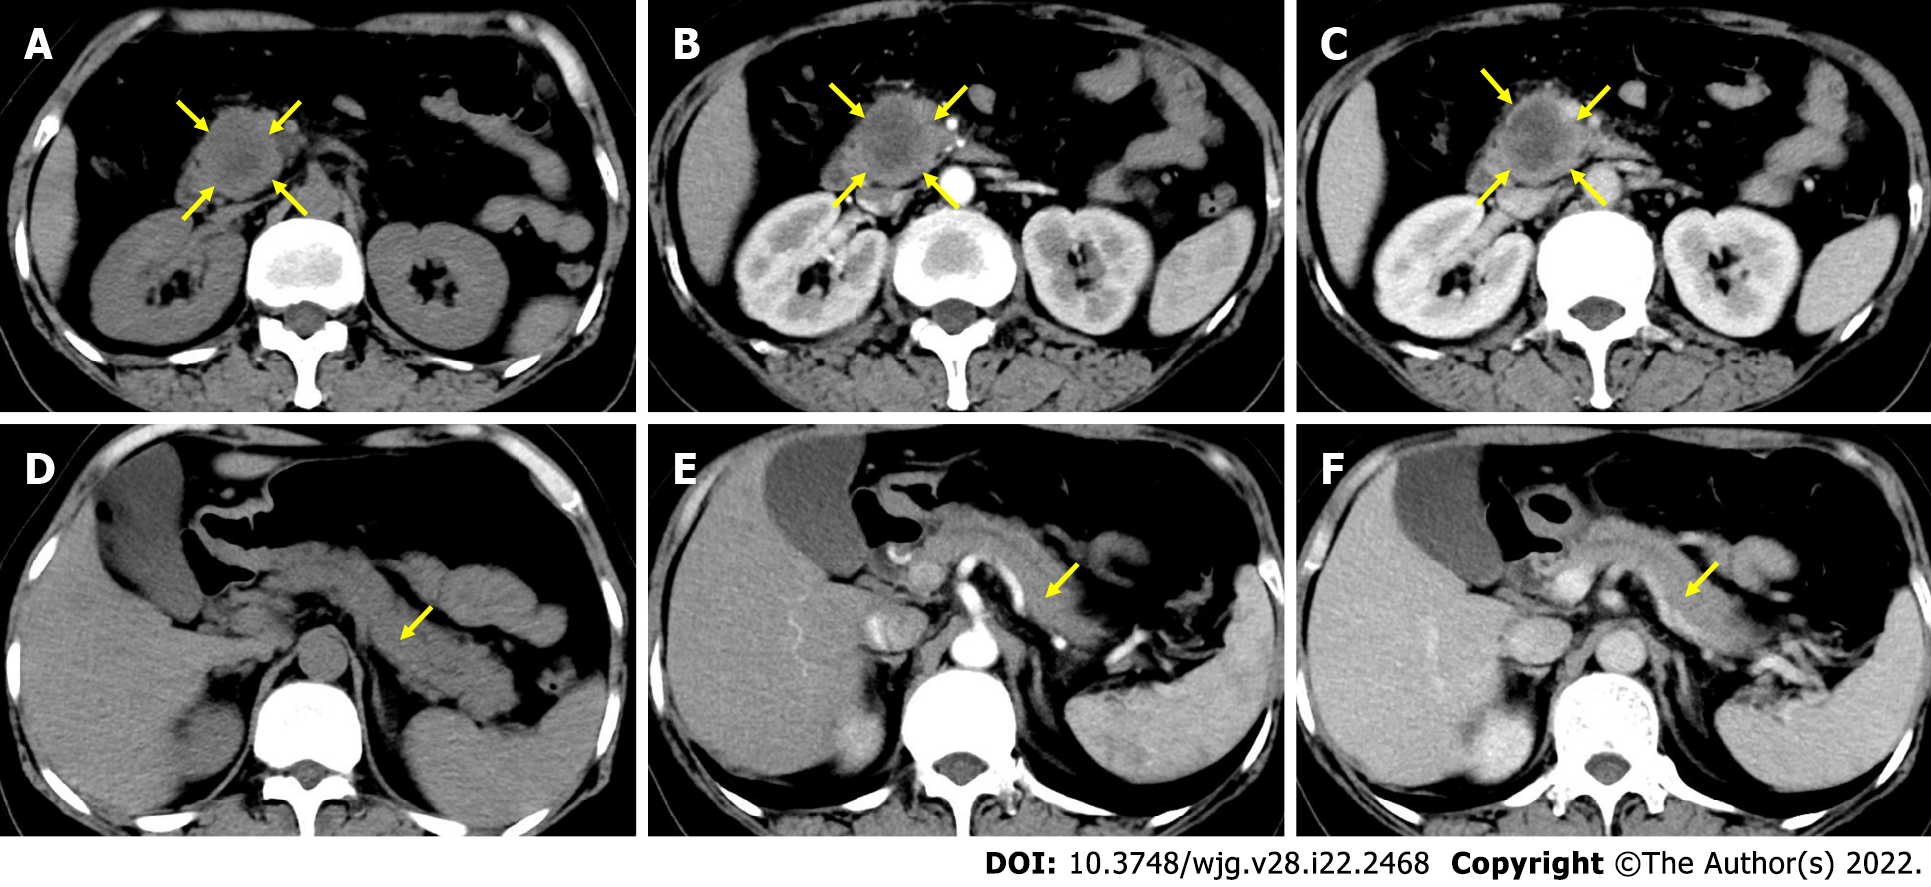
Figure 3 A 61-year-old woman with a mass in the head of the pancreas.
A-C: The nonenhancement phase (A), pancreatic parenchymal (PP) phase (B) and portal venous (PV) phase (C) of region of the overall tumour, respectively; D-F: The nonenhancement phase (D), PP phase (E) and PV phase (F) of pancreatic tissue outside the tumour, respectively. Tumour relative enhancement ratio ≤ 0.7, and the postoperative overall survival was 5.5 mo.
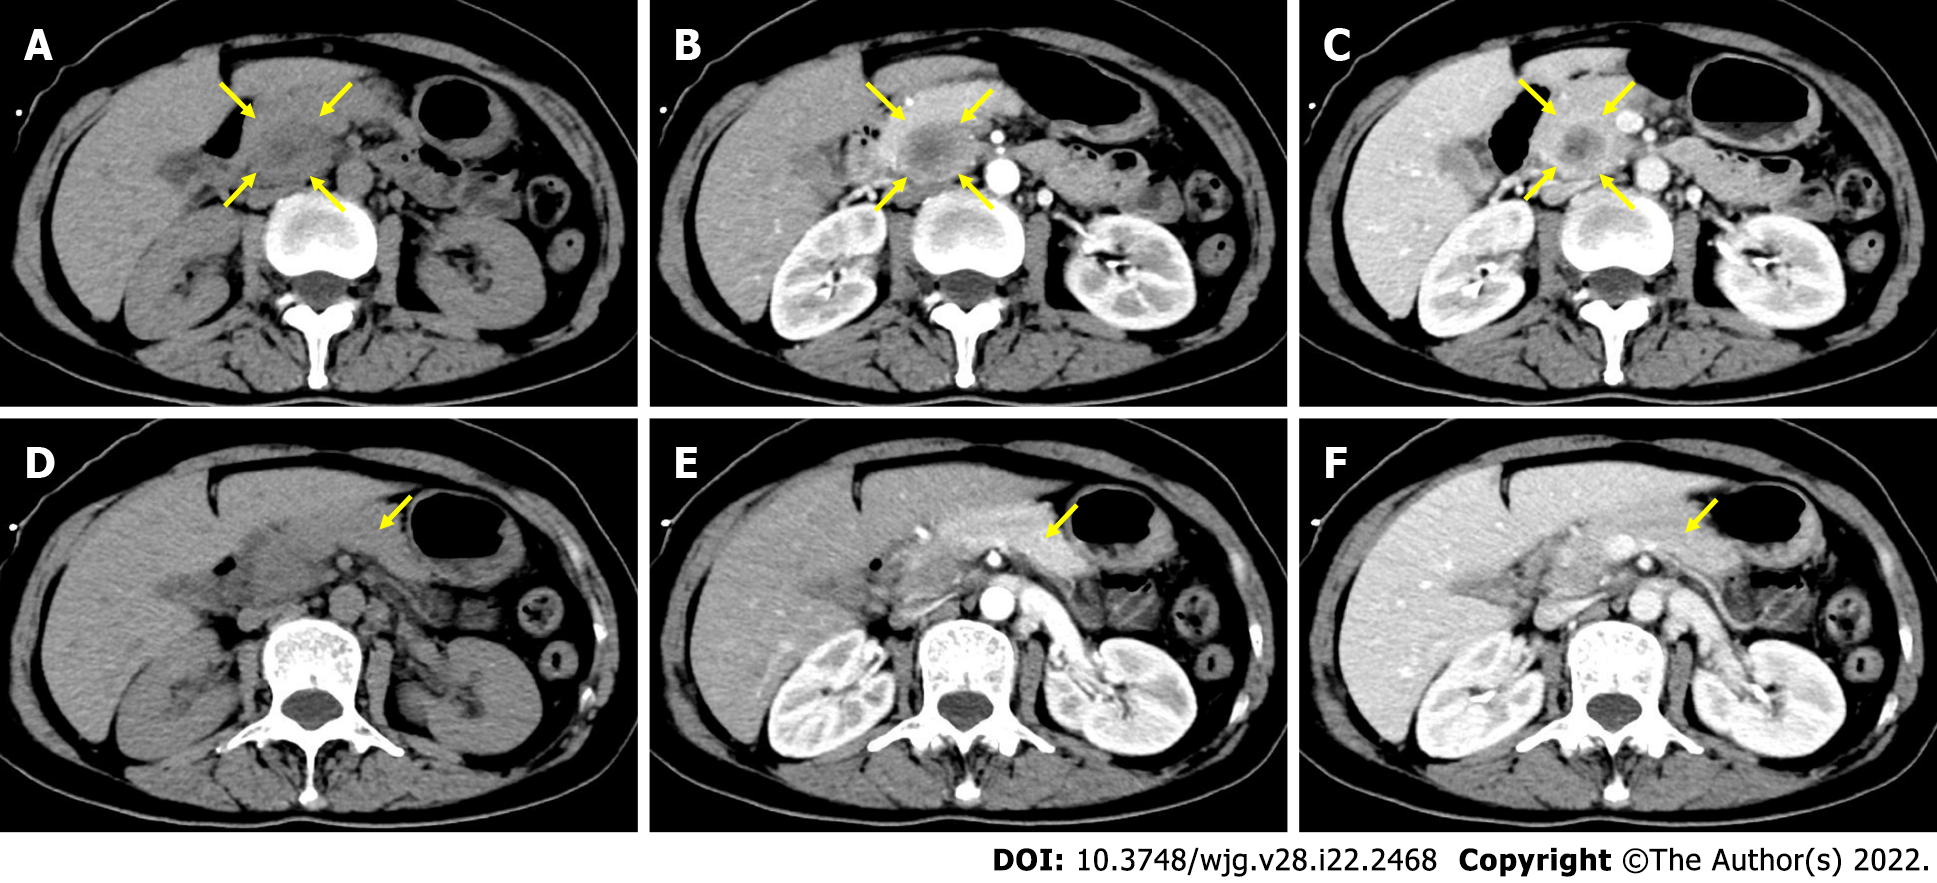
Figure 4 A 54-year-old woman with a mass in the head of the pancreas.
A-C: The nonenhancement phase (A), pancreatic parenchymal (PP) phase (B) and portal venous (PV) phase (C) of region of the overall tumour, respectively; D-F: The nonenhancement phase (D), PP phase (E) and PV phase (F) of pancreatic tissue outside the tumour, respectively. Tumour relative enhancement ratio > 0.7, and the postoperative overall survival was 27.3 mo.
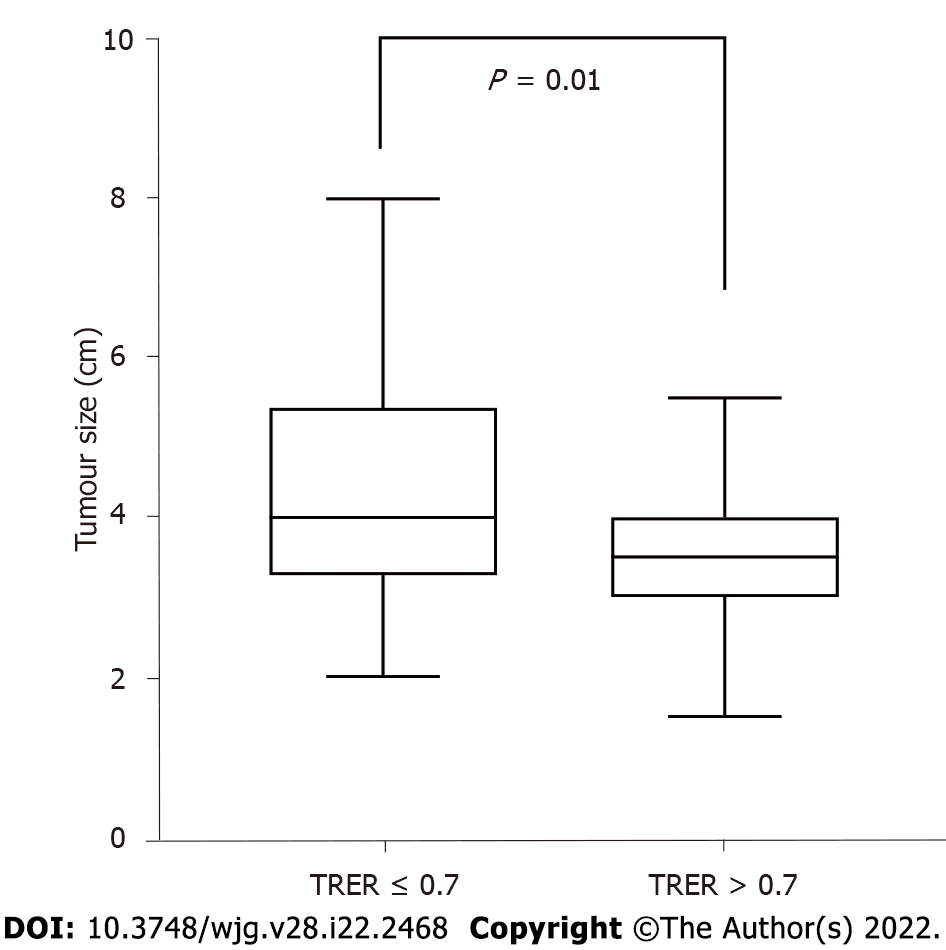
Figure 5 Correlation analysis between tumour size and tumour relative enhancement ratio.
TRER: Tumour relative enhancement ratio.
- Citation: Gao JF, Pan Y, Lin XC, Lu FC, Qiu DS, Liu JJ, Huang HG. Prognostic value of preoperative enhanced computed tomography as a quantitative imaging biomarker in pancreatic cancer. World J Gastroenterol 2022; 28(22): 2468-2481
- URL: https://www.wjgnet.com/1007-9327/full/v28/i22/2468.htm
- DOI: https://dx.doi.org/10.3748/wjg.v28.i22.2468


