Copyright
©The Author(s) 2022.
World J Gastroenterol. Jun 14, 2022; 28(22): 2437-2456
Published online Jun 14, 2022. doi: 10.3748/wjg.v28.i22.2437
Published online Jun 14, 2022. doi: 10.3748/wjg.v28.i22.2437
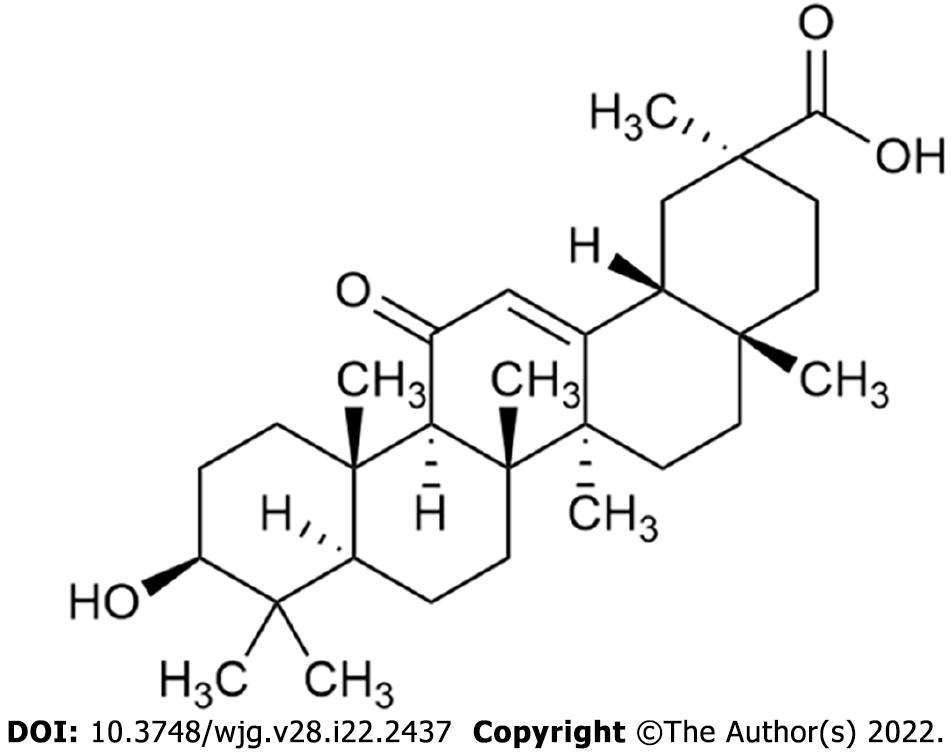
Figure 1 Structure of 18β-glycyrrhetinic acid.
The molecular formula for 18β-glycyrrhetinic acid is C30H46O4, and the molecular weight is 470.68.
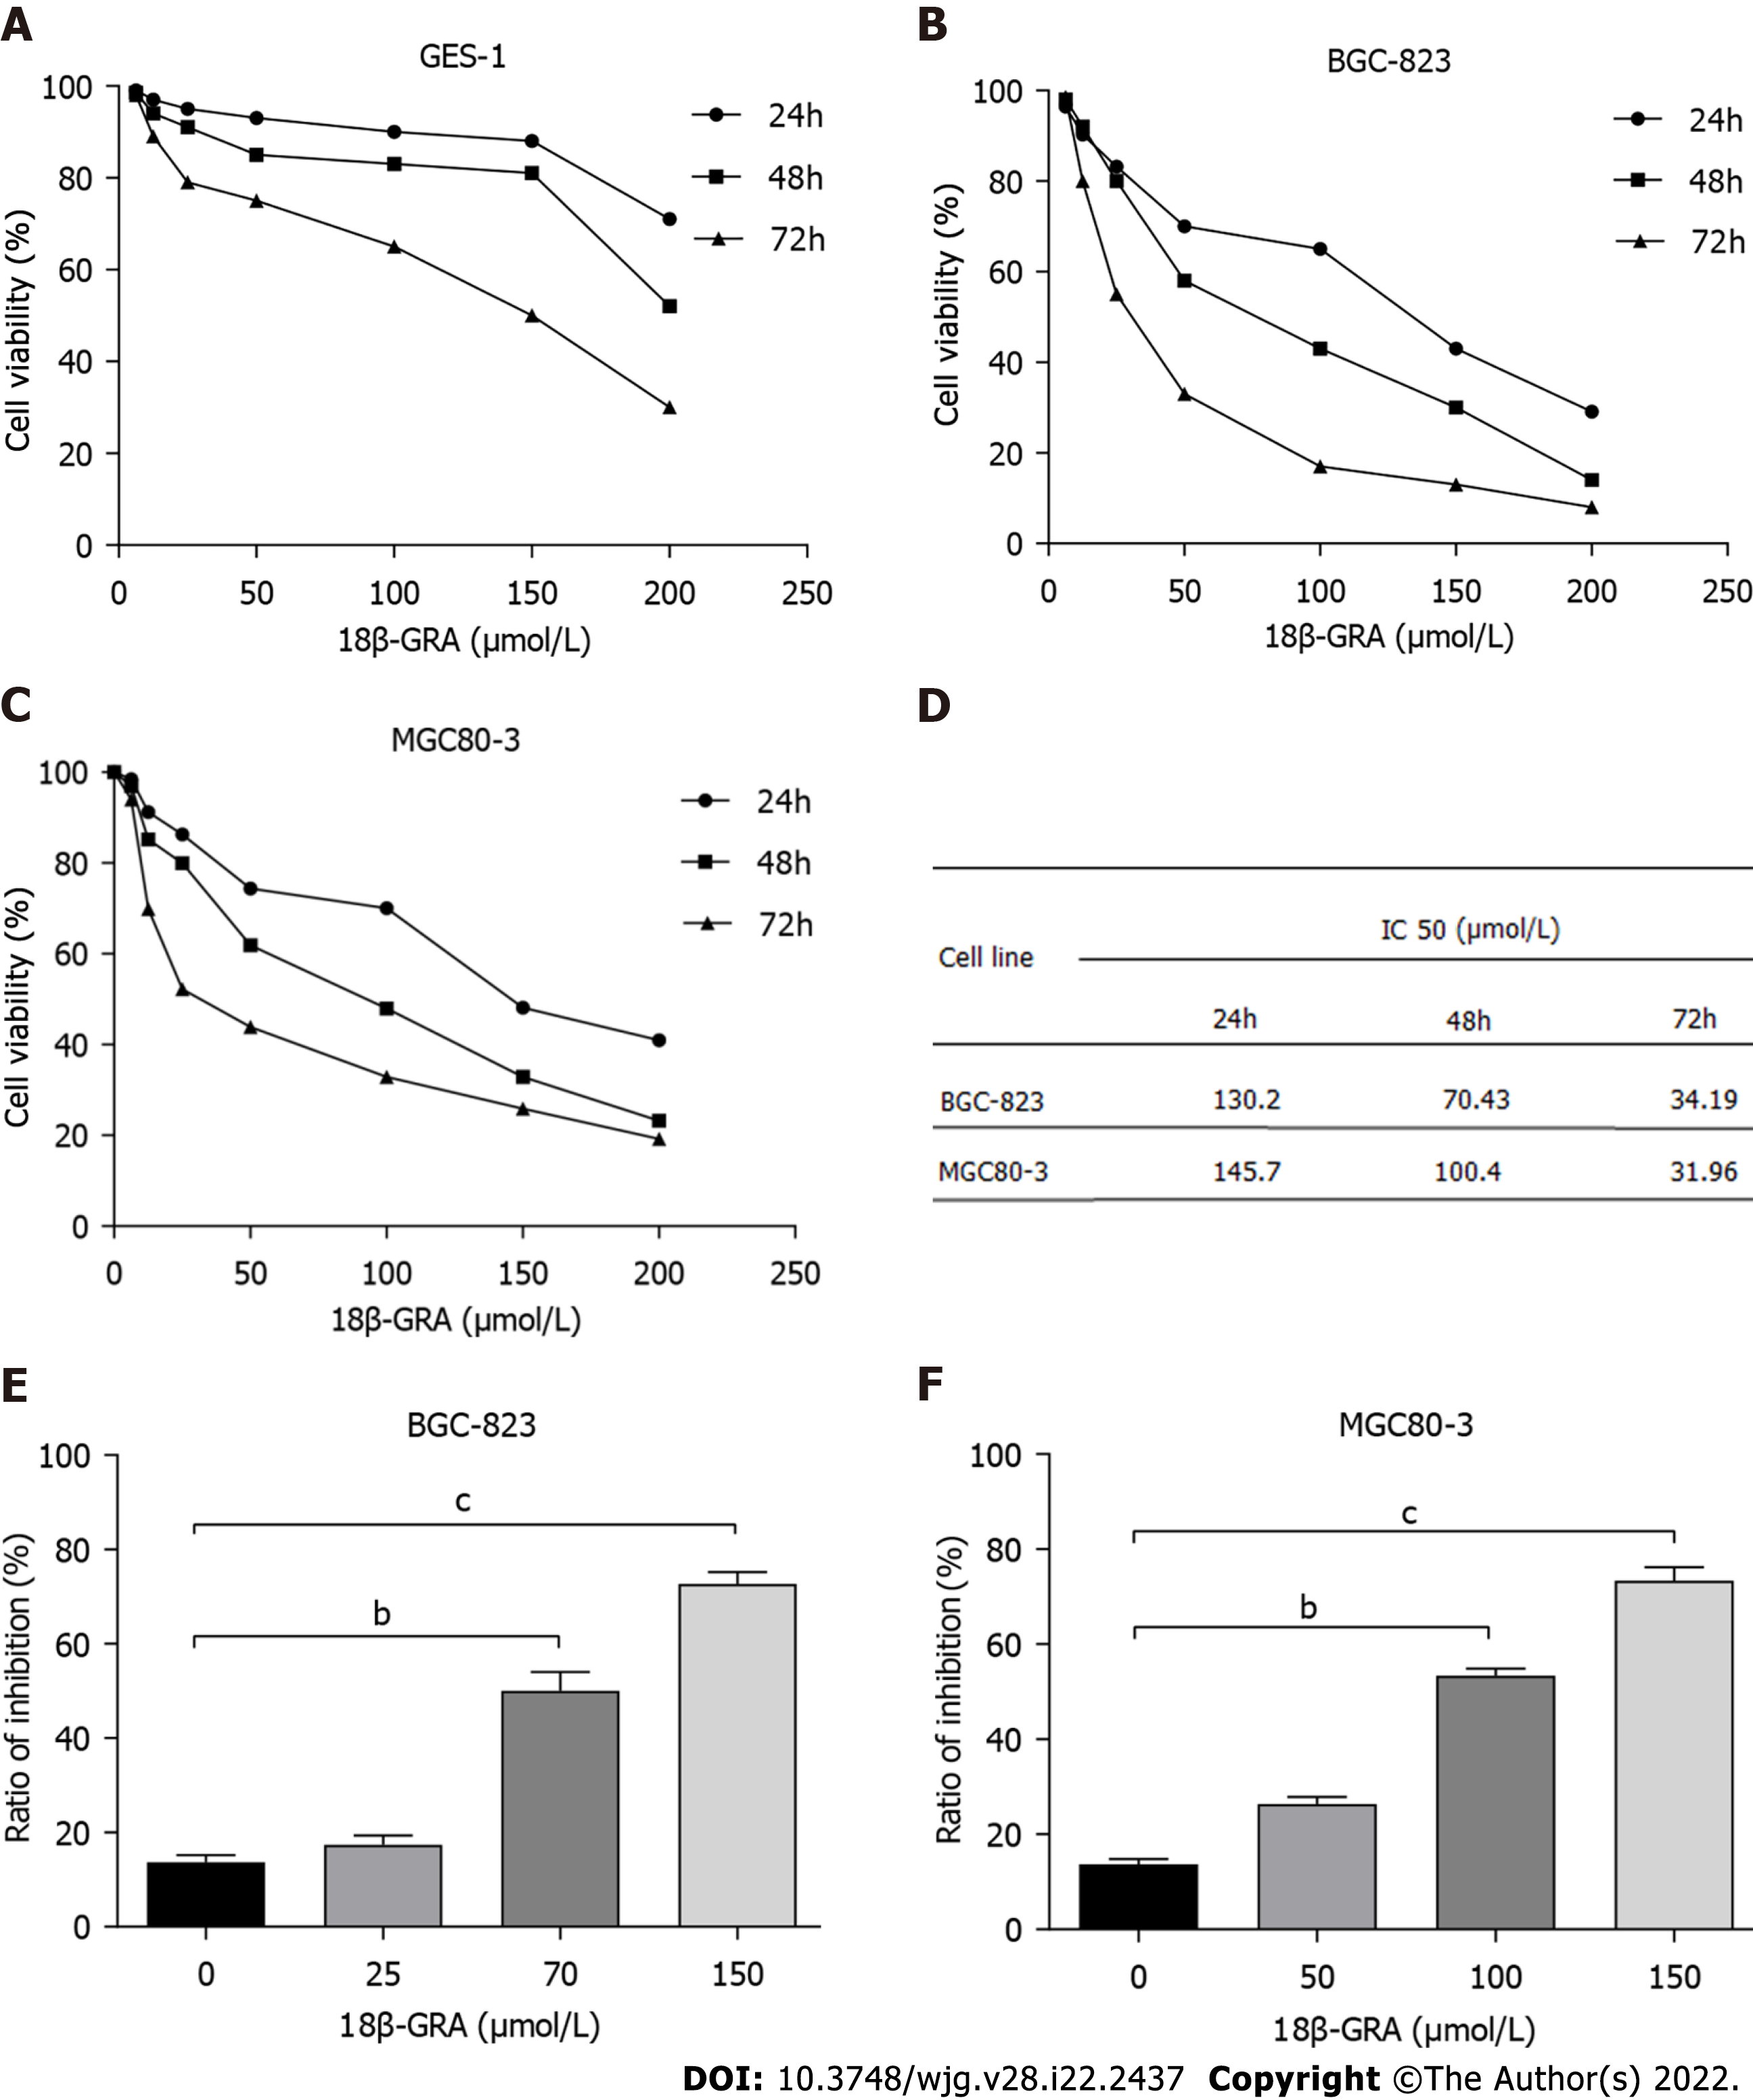
Figure 2 Effect of 18β-glycyrrhetinic acid on survival rate of GES-1 cells and proliferation of MGC80-3 and BGC-823 cells detected by CCK-8 method.
A: GES-1 cells; B: BGC-823 cells; C: MGC80-3 cells; D: IC50 values of 18β-glycyrrhetinic acid (18β-GRA) for BGC-823 cells and MGC80-3 cells after 24 h, 48 h, and 72 h; E and F: Inhibition rate of 18β-GRA acid at different concentrations on BGC-823 and MGC80-3 cell proliferation. All analyses were repeated three times. The data is represented as the mean ± SD. aP < 0.05; bP < 0.01; cP < 0.001. 18β-GRA: 18β-glycyrrhetinic acid.
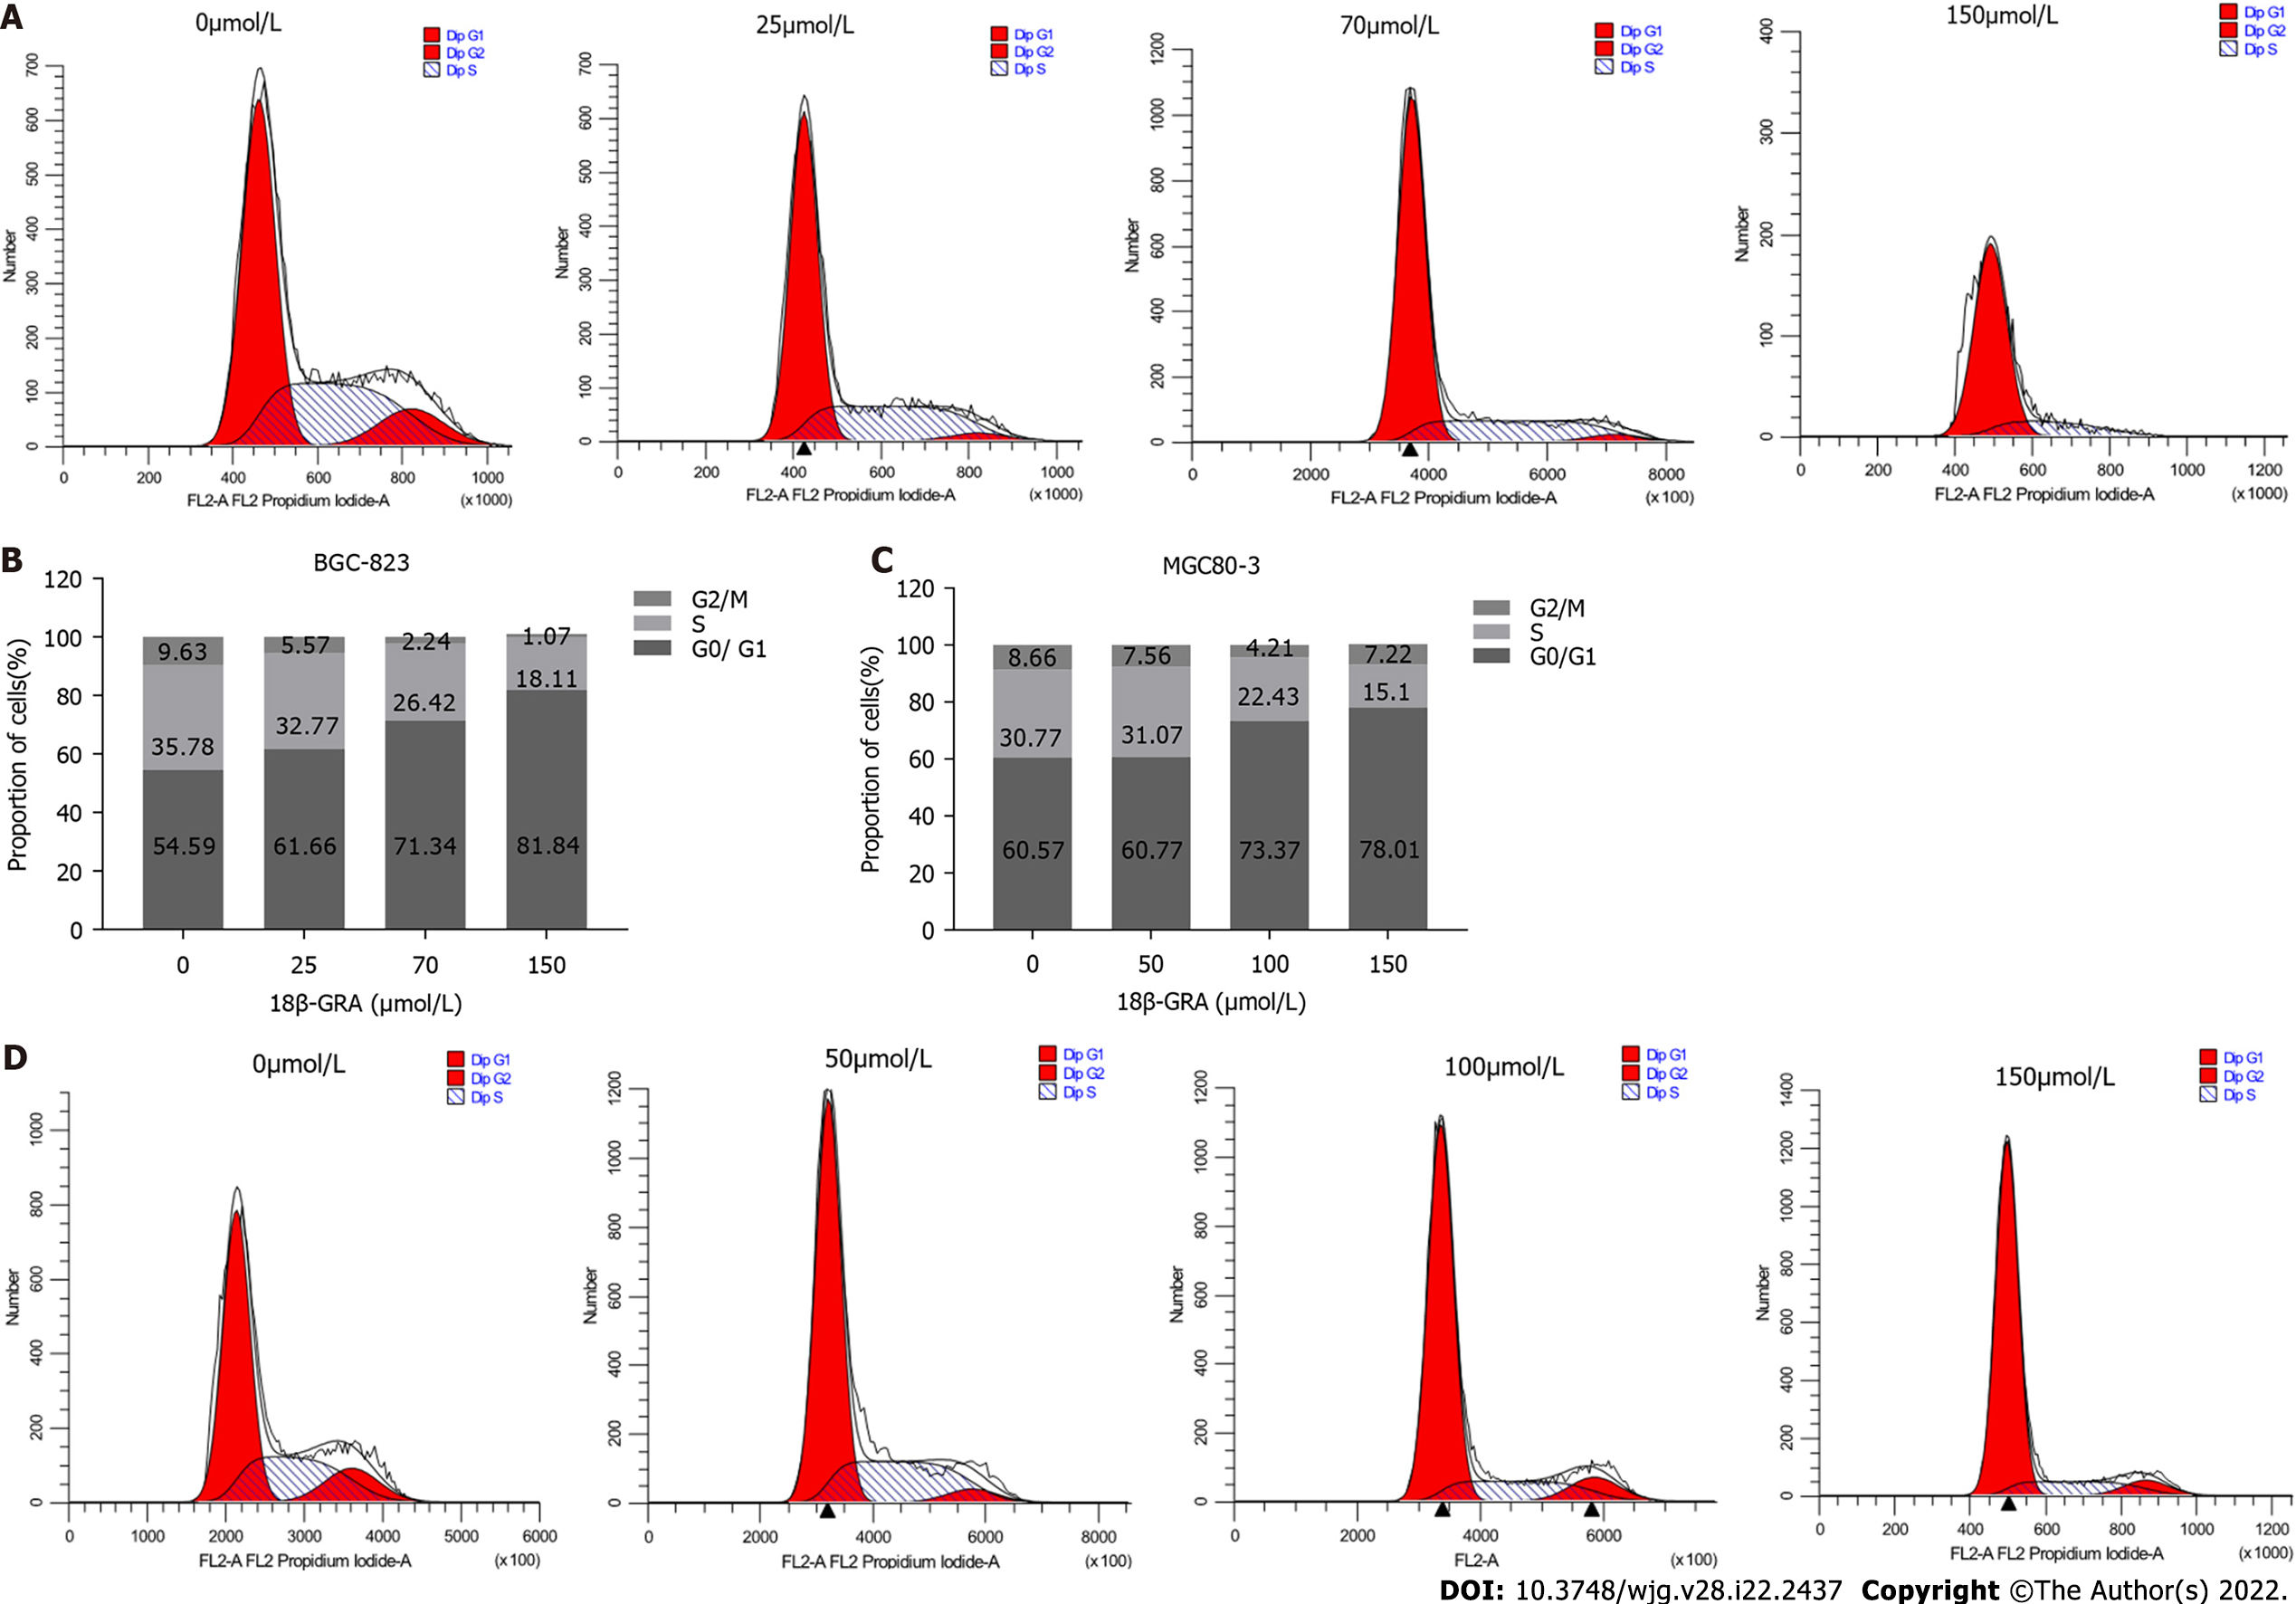
Figure 3 Effects of different concentrations of 18β-glycyrrhetinic acid on gastric carcinoma cell cycle.
A and B: Cell cycle and statistical graph of BGC-823 cells; C and D: Cell cycle and statistical graph of MGC80-3 cells. All analyses were repeated three times. The data is represented as the mean ± SD. aP < 0.05; bP < 0.01; cP < 0.001. 18β-GRA: 18β-glycyrrhetinic acid.
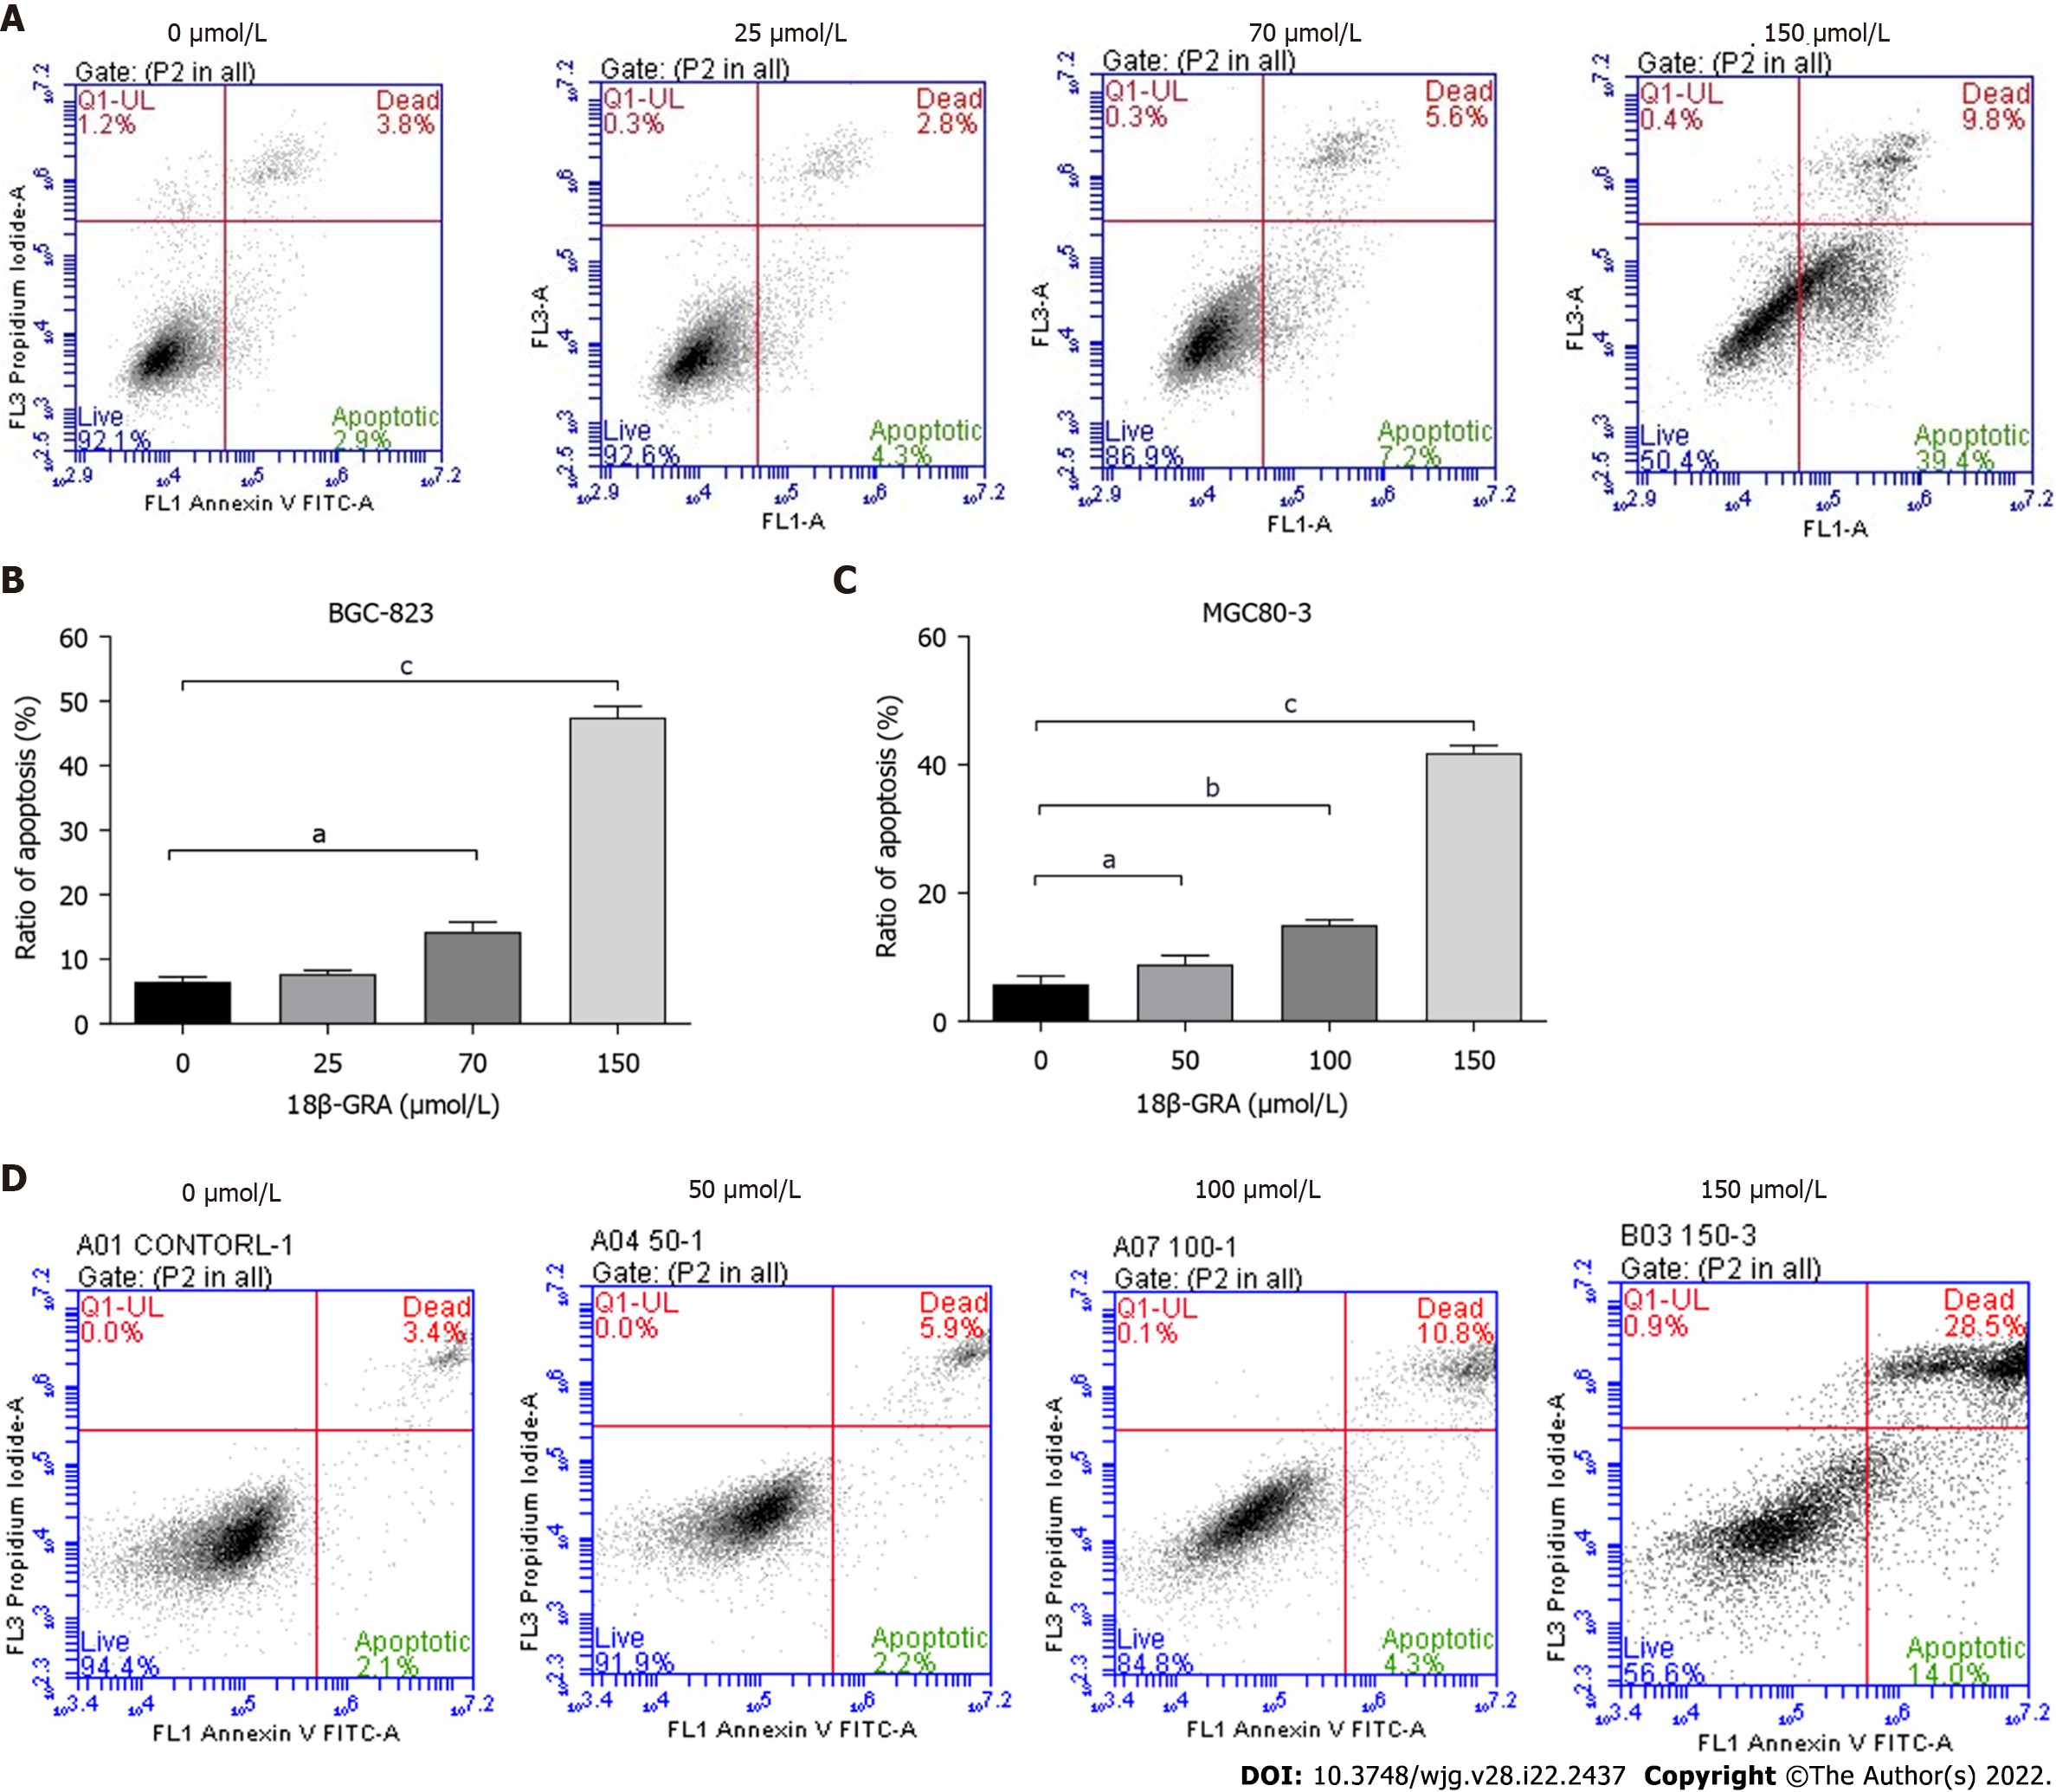
Figure 4 Effects of different concentrations of 18β-glycyrrhetinic acid on gastric carcinoma cell apoptosis.
A and B: Cell apoptosis and statistics graph of BGC-823 cells; C and D: Cell apoptosis and statistics graph of MGC80-3 cells. All analyses were repeated three times. The data is represented as the mean ± SD. aP < 0.05; bP < 0.01; cP < 0.001. 18β-GRA: 18β-glycyrrhetinic acid.
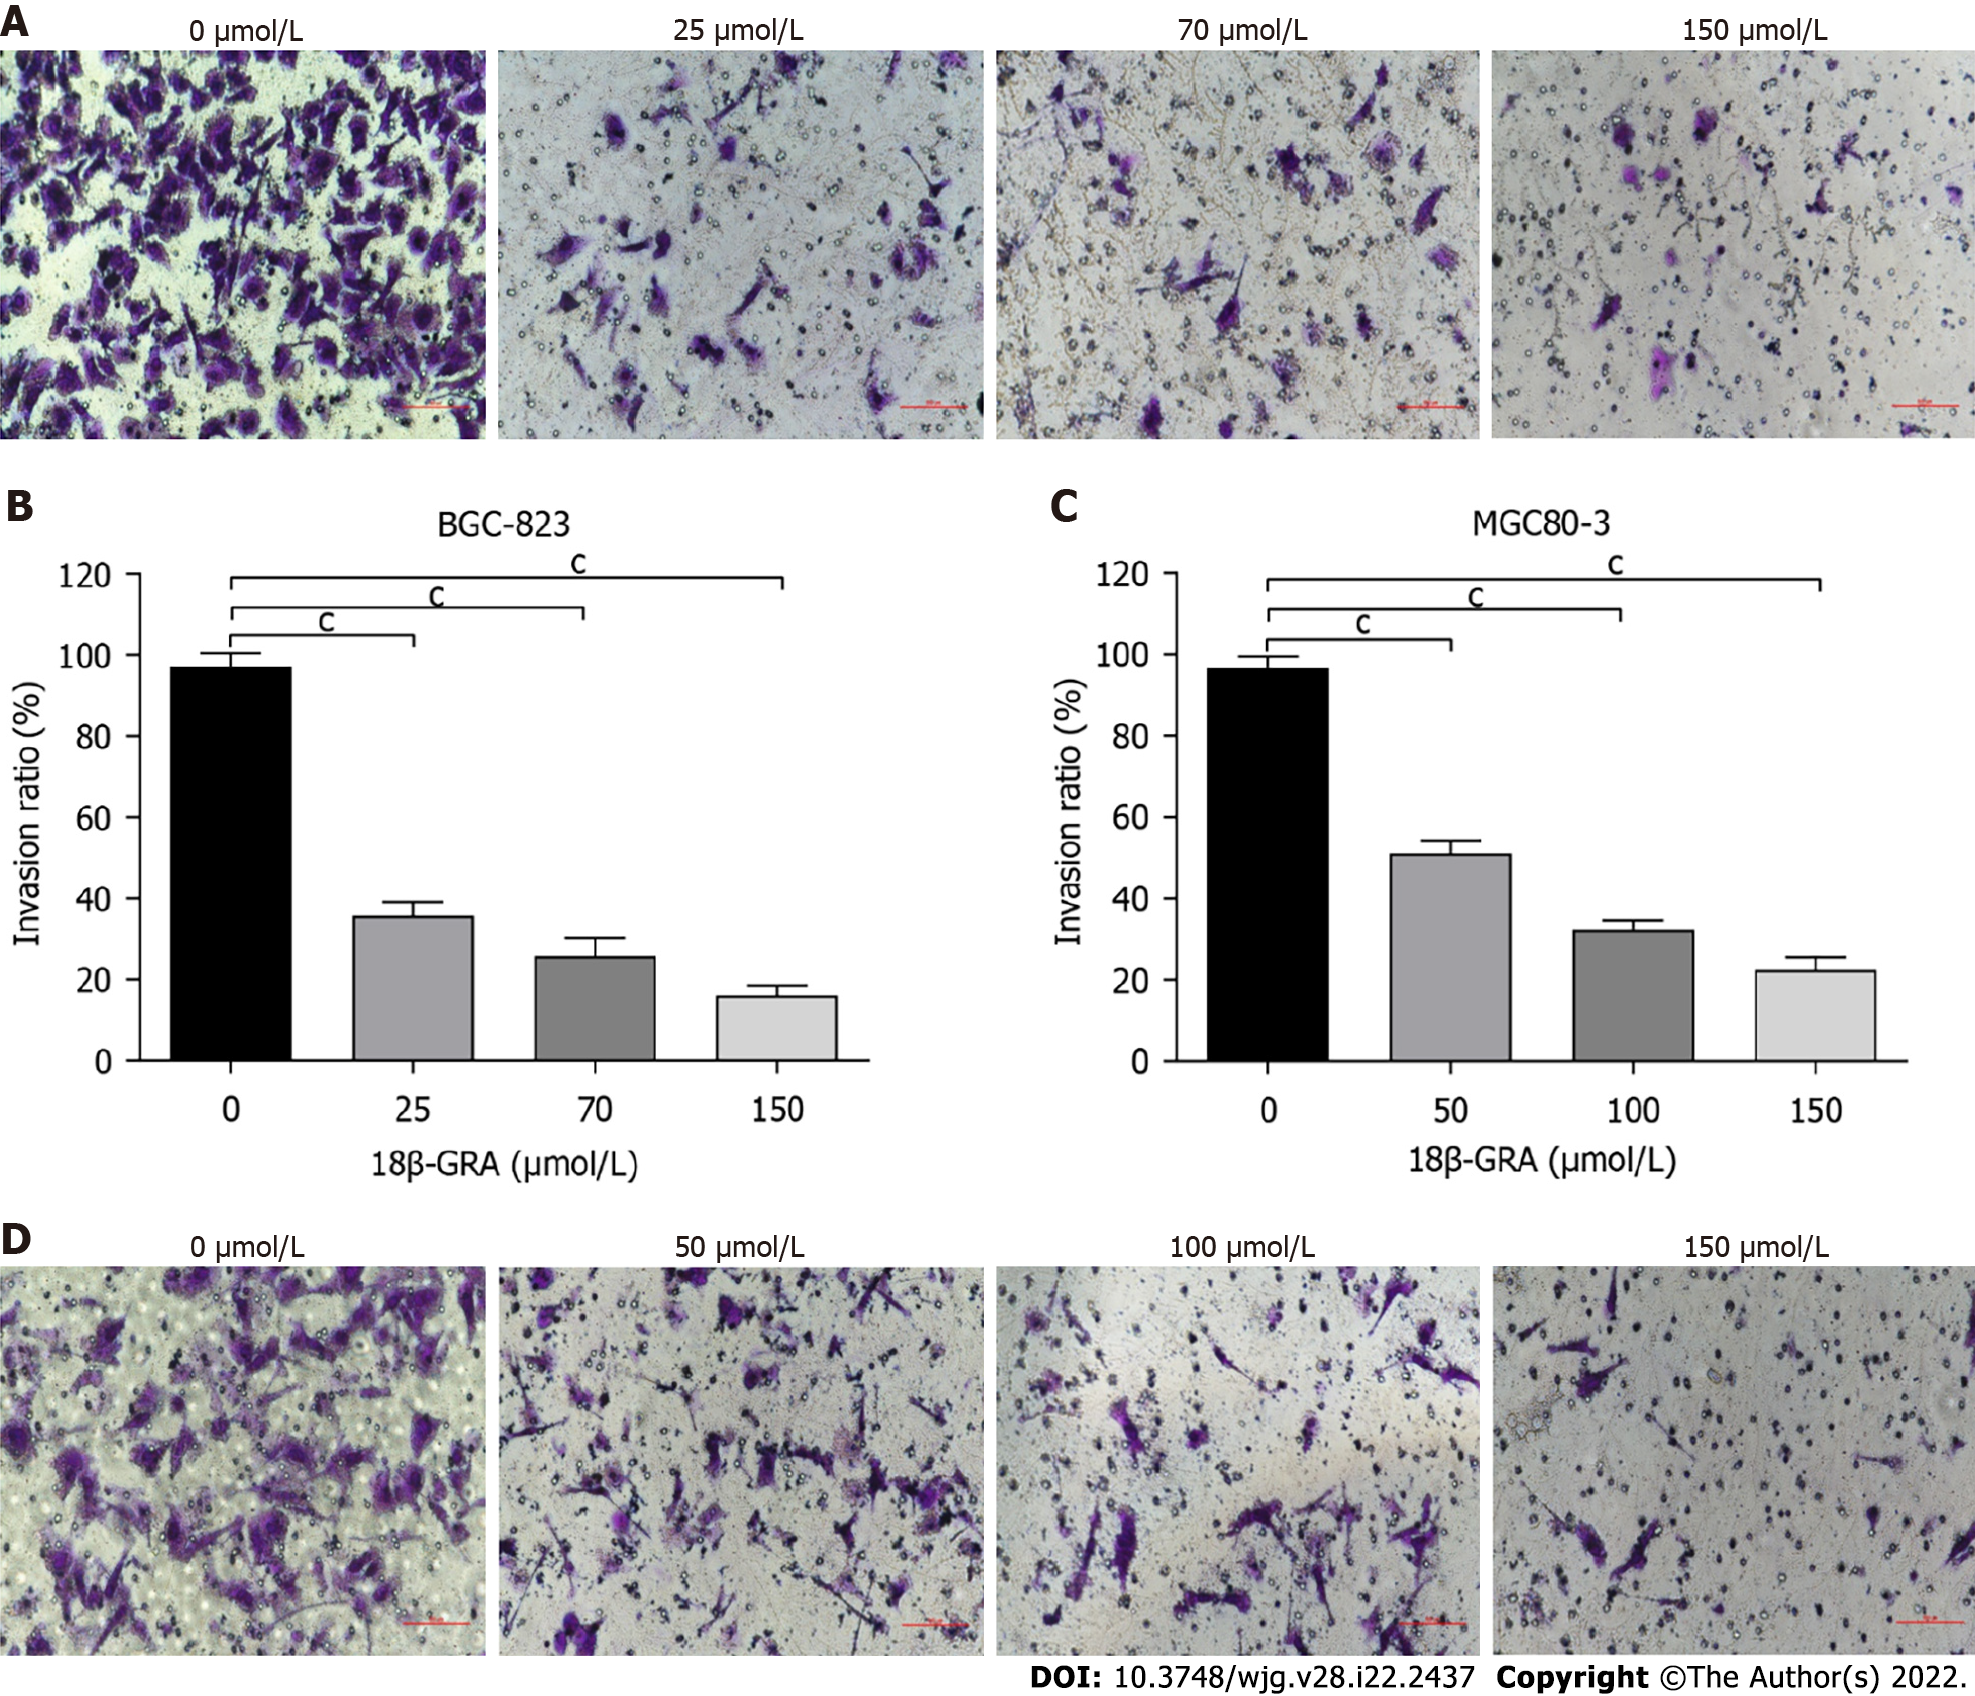
Figure 5 Effects of different concentrations of 18β-glycyrrhetinic acid on invasion of human gastric carcinoma cells.
A and B: Invasion ability of BGC-823 cells measured by Transwell of Matrigel matrix gel and the statistical graph; C and D: Invasion ability of MGC80-3 cells and statistical graph. All analyses were repeated three times. The data is represented as the mean ± SD. aP < 0.05; bP < 0.01; cP < 0.001. 18β-GRA: 18β-glycyrrhetinic acid.
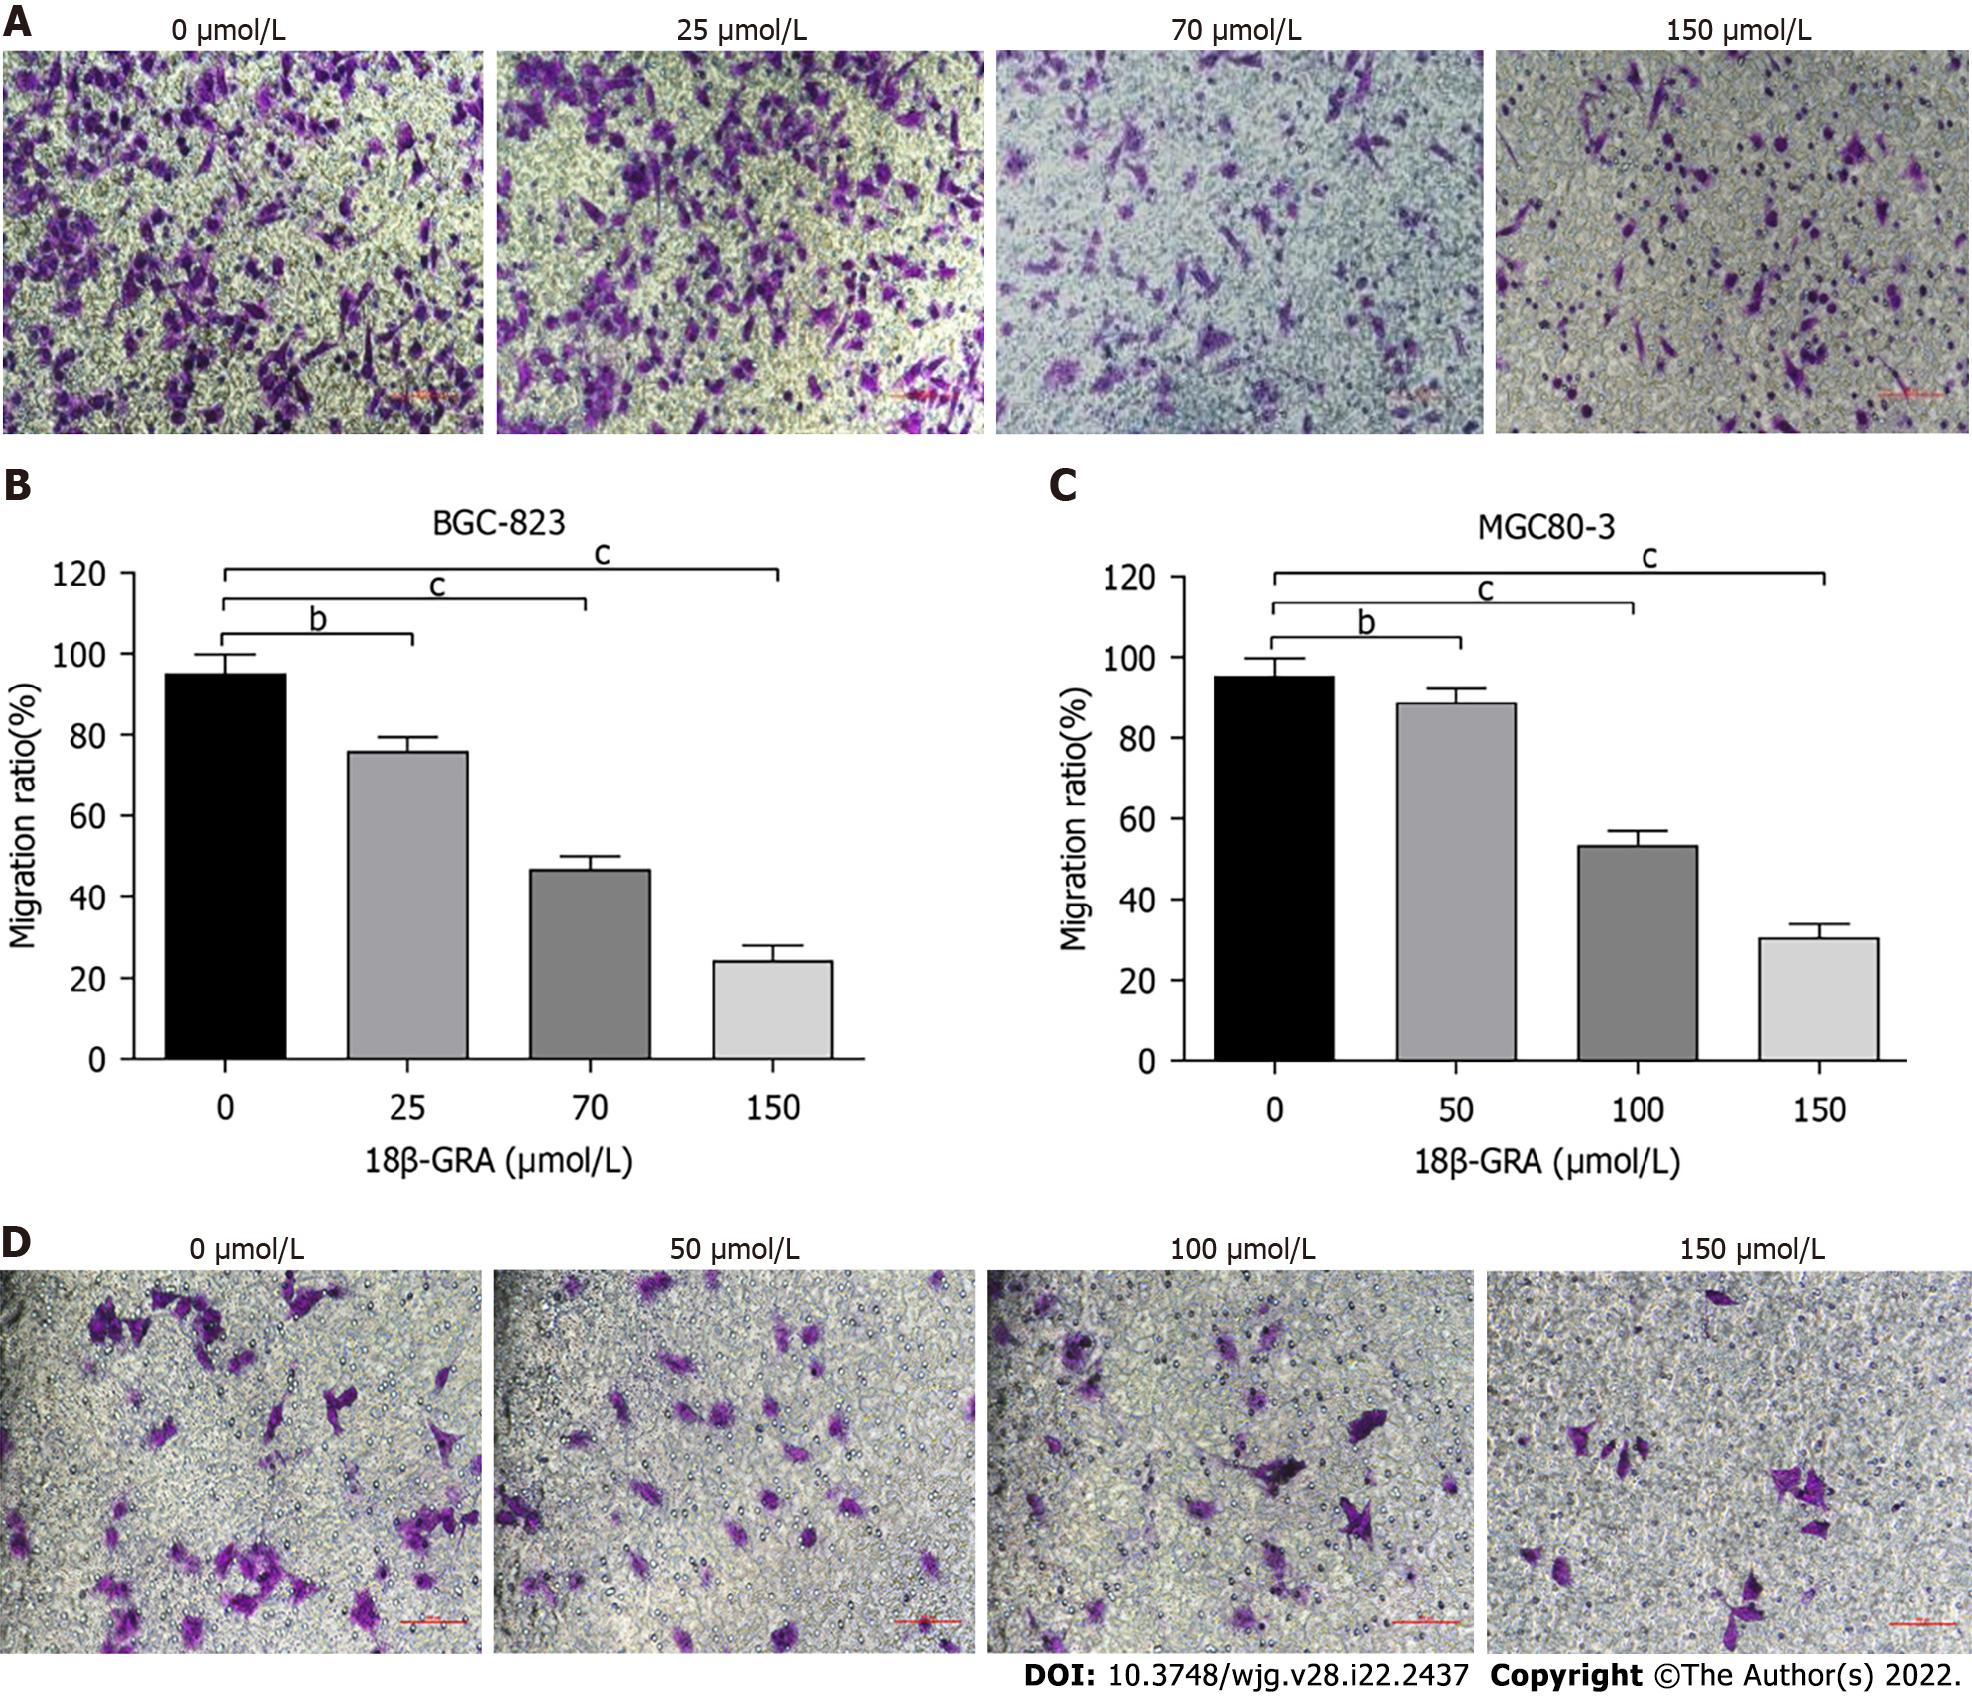
Figure 6 Effects of different concentrations of 18β-glycyrrhetinic acid on migration of human gastric carcinoma cells.
A and B: Migration ability of BGC-823 cells determined by Transwell assay without Matrigel matrix gel and statistical graph; C and D: Migration ability of MGC80-3 cells and statistical graph. All analyses were repeated three times. The data is represented as the mean ± SD. aP < 0.05; bP < 0.01; cP < 0.001. 18β-GRA: 18β-glycyrrhetinic acid.
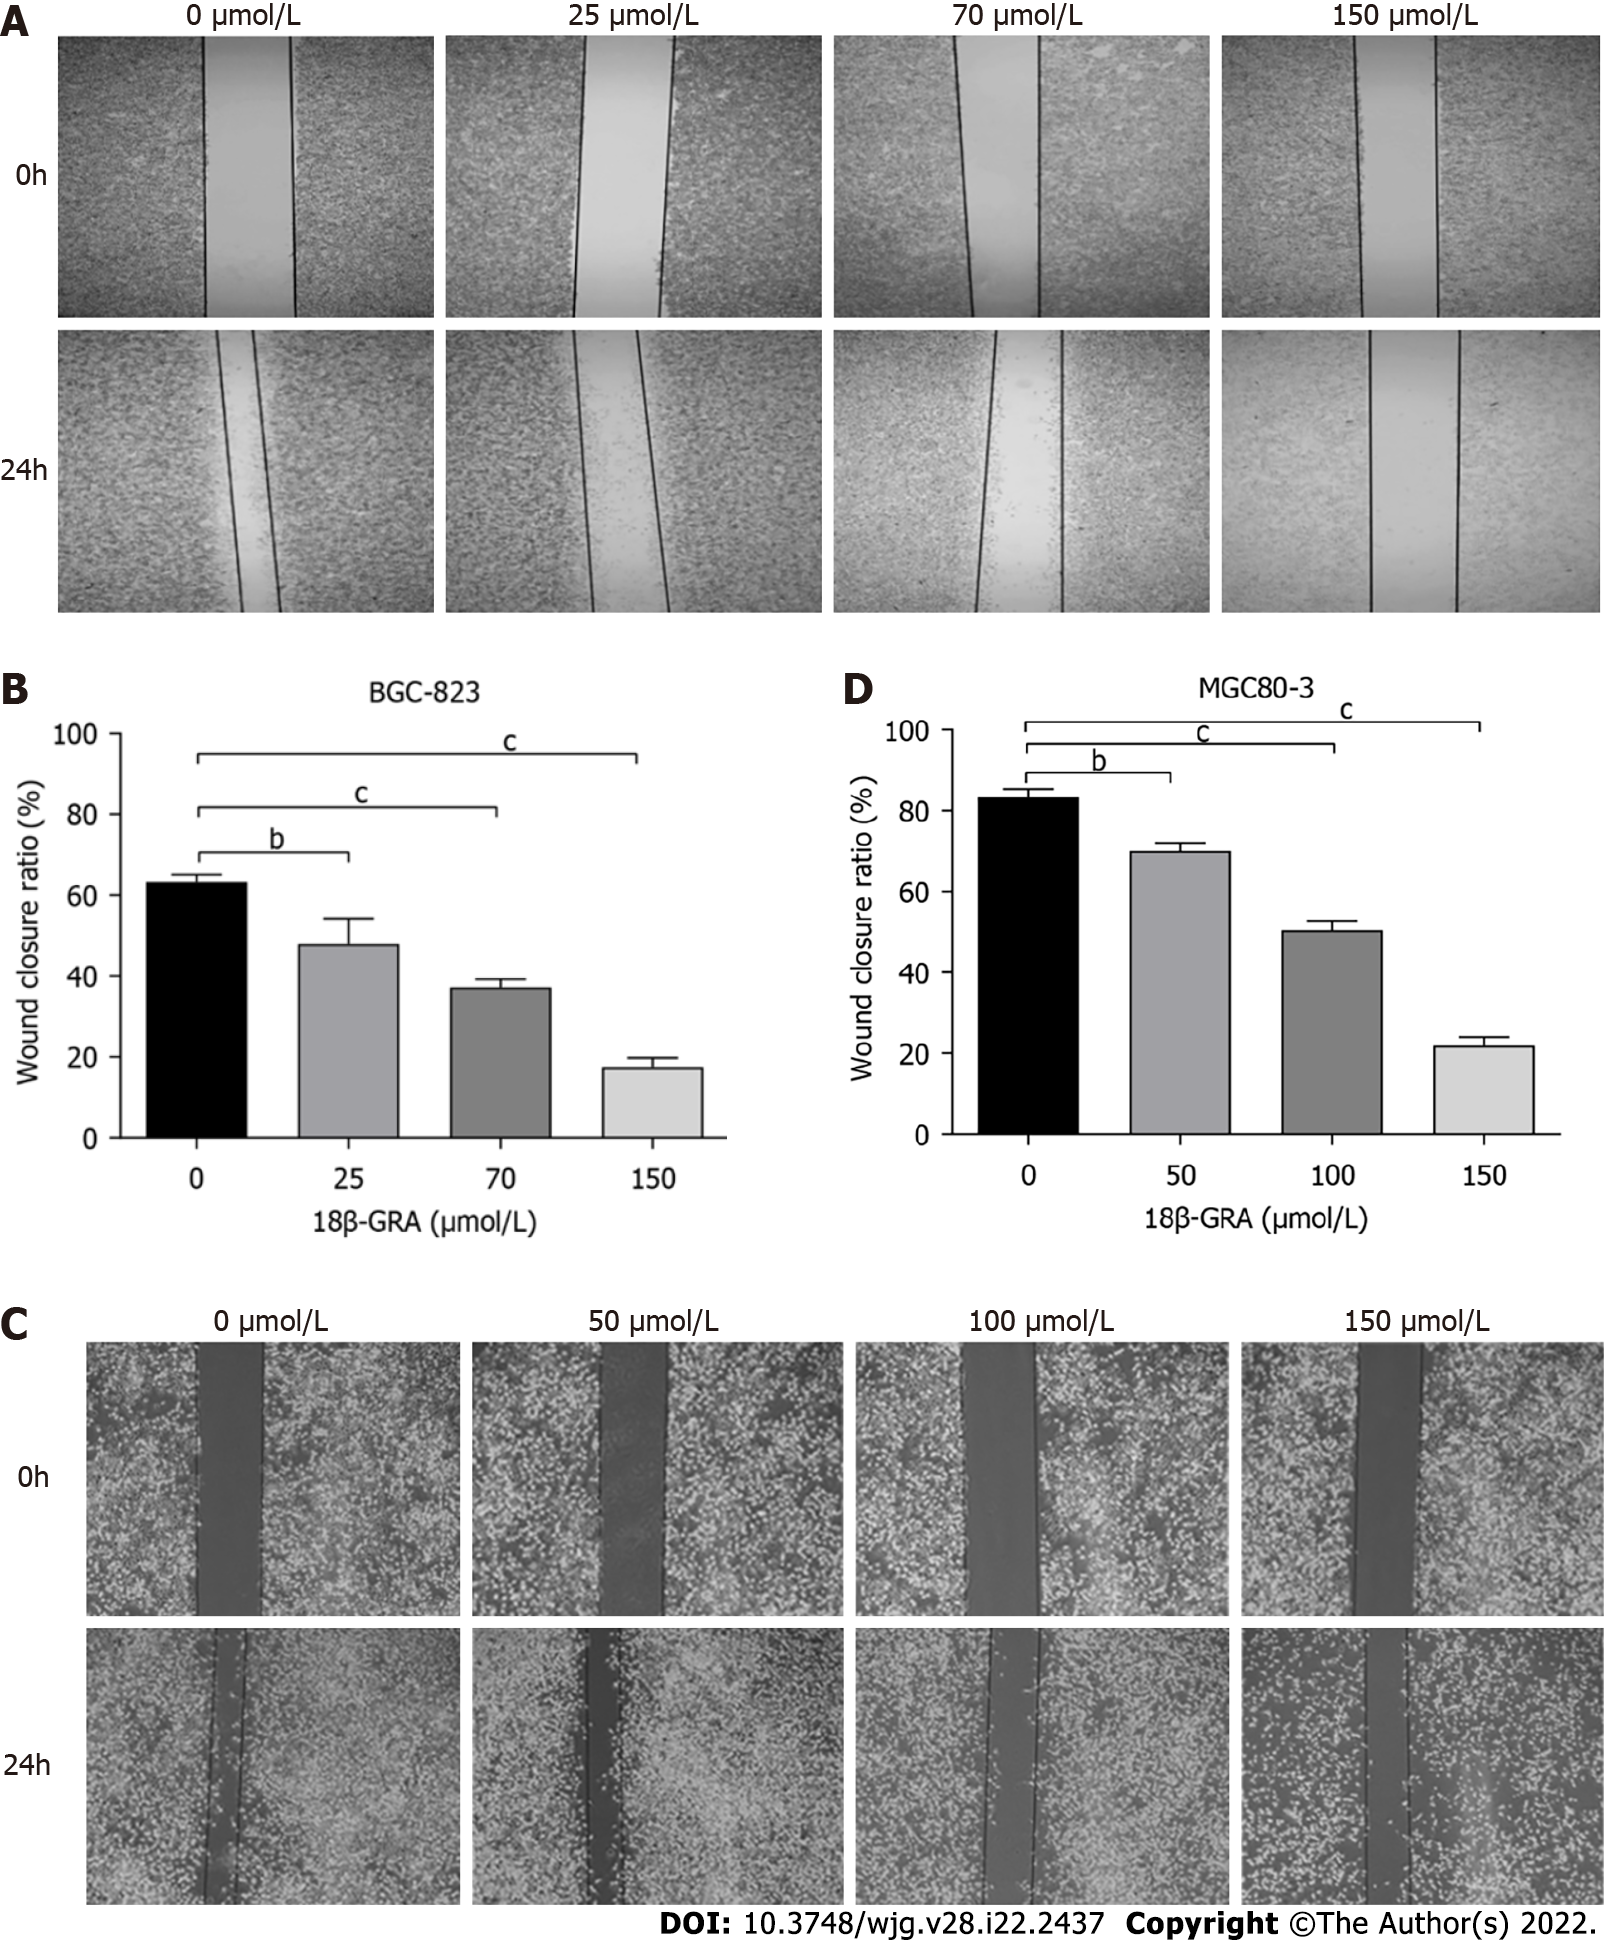
Figure 7 Effects of different concentrations of 18β-glycyrrhetinic acid on migration of human gastric carcinoma cells.
A and B: Effect of 18β-glycyrrhetinic acid (18β-GRA) on migration of BGC-823 cells evaluated by Wound-scratch assay and statistical graph; C and D: Effect of 18β-GRA on the migration of MGC80-3 cells and statistical graph. All analyses were repeated three times. The data is represented as the mean ± SD. aP < 0.05; bP < 0.01; cP < 0.001. 18β-GRA: 18β-glycyrrhetinic acid.
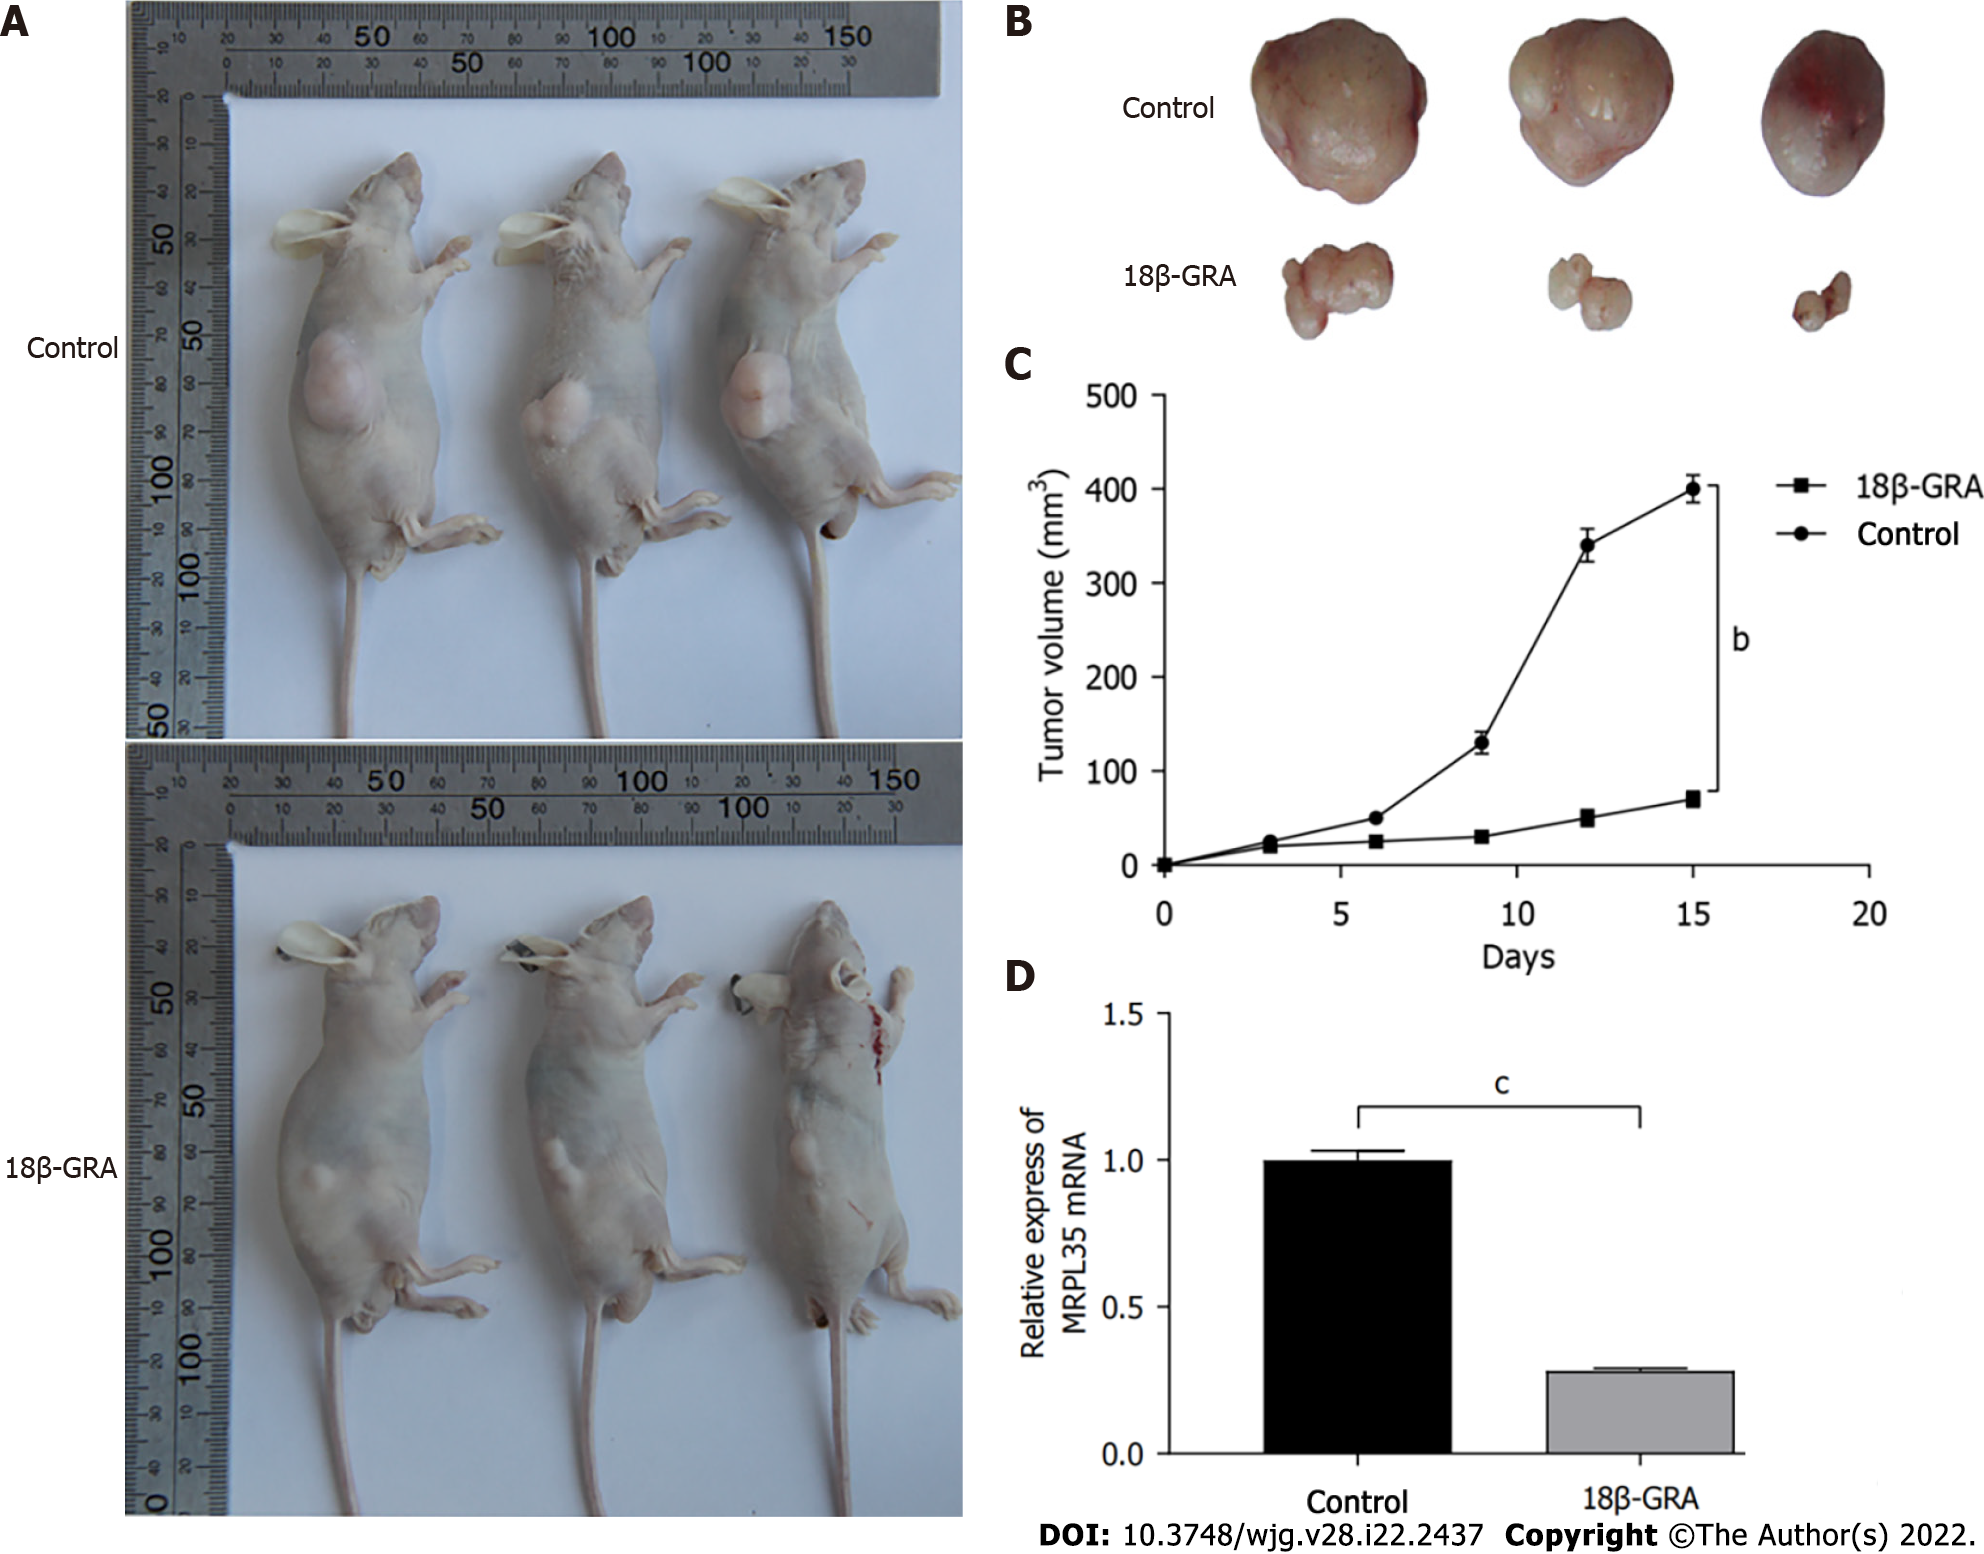
Figure 8 Effect of 18β-glycyrrhetinic acid on tumor size in nude mice.
A: Nude mouse gastric carcinoma xenograft model; B: Subcutaneously transplanted tumor in nude mice. n = 6; C: Tumor growth curve of transplanted tumor model; D: Quantitative reverse transcription-polymerase chain reaction was used to detect the expression level of MRPL35 in the transplanted tumor tissues of mice. aP < 0.05; bP < 0.01; cP < 0.001. 18β-GRA: 18β-glycyrrhetinic acid.
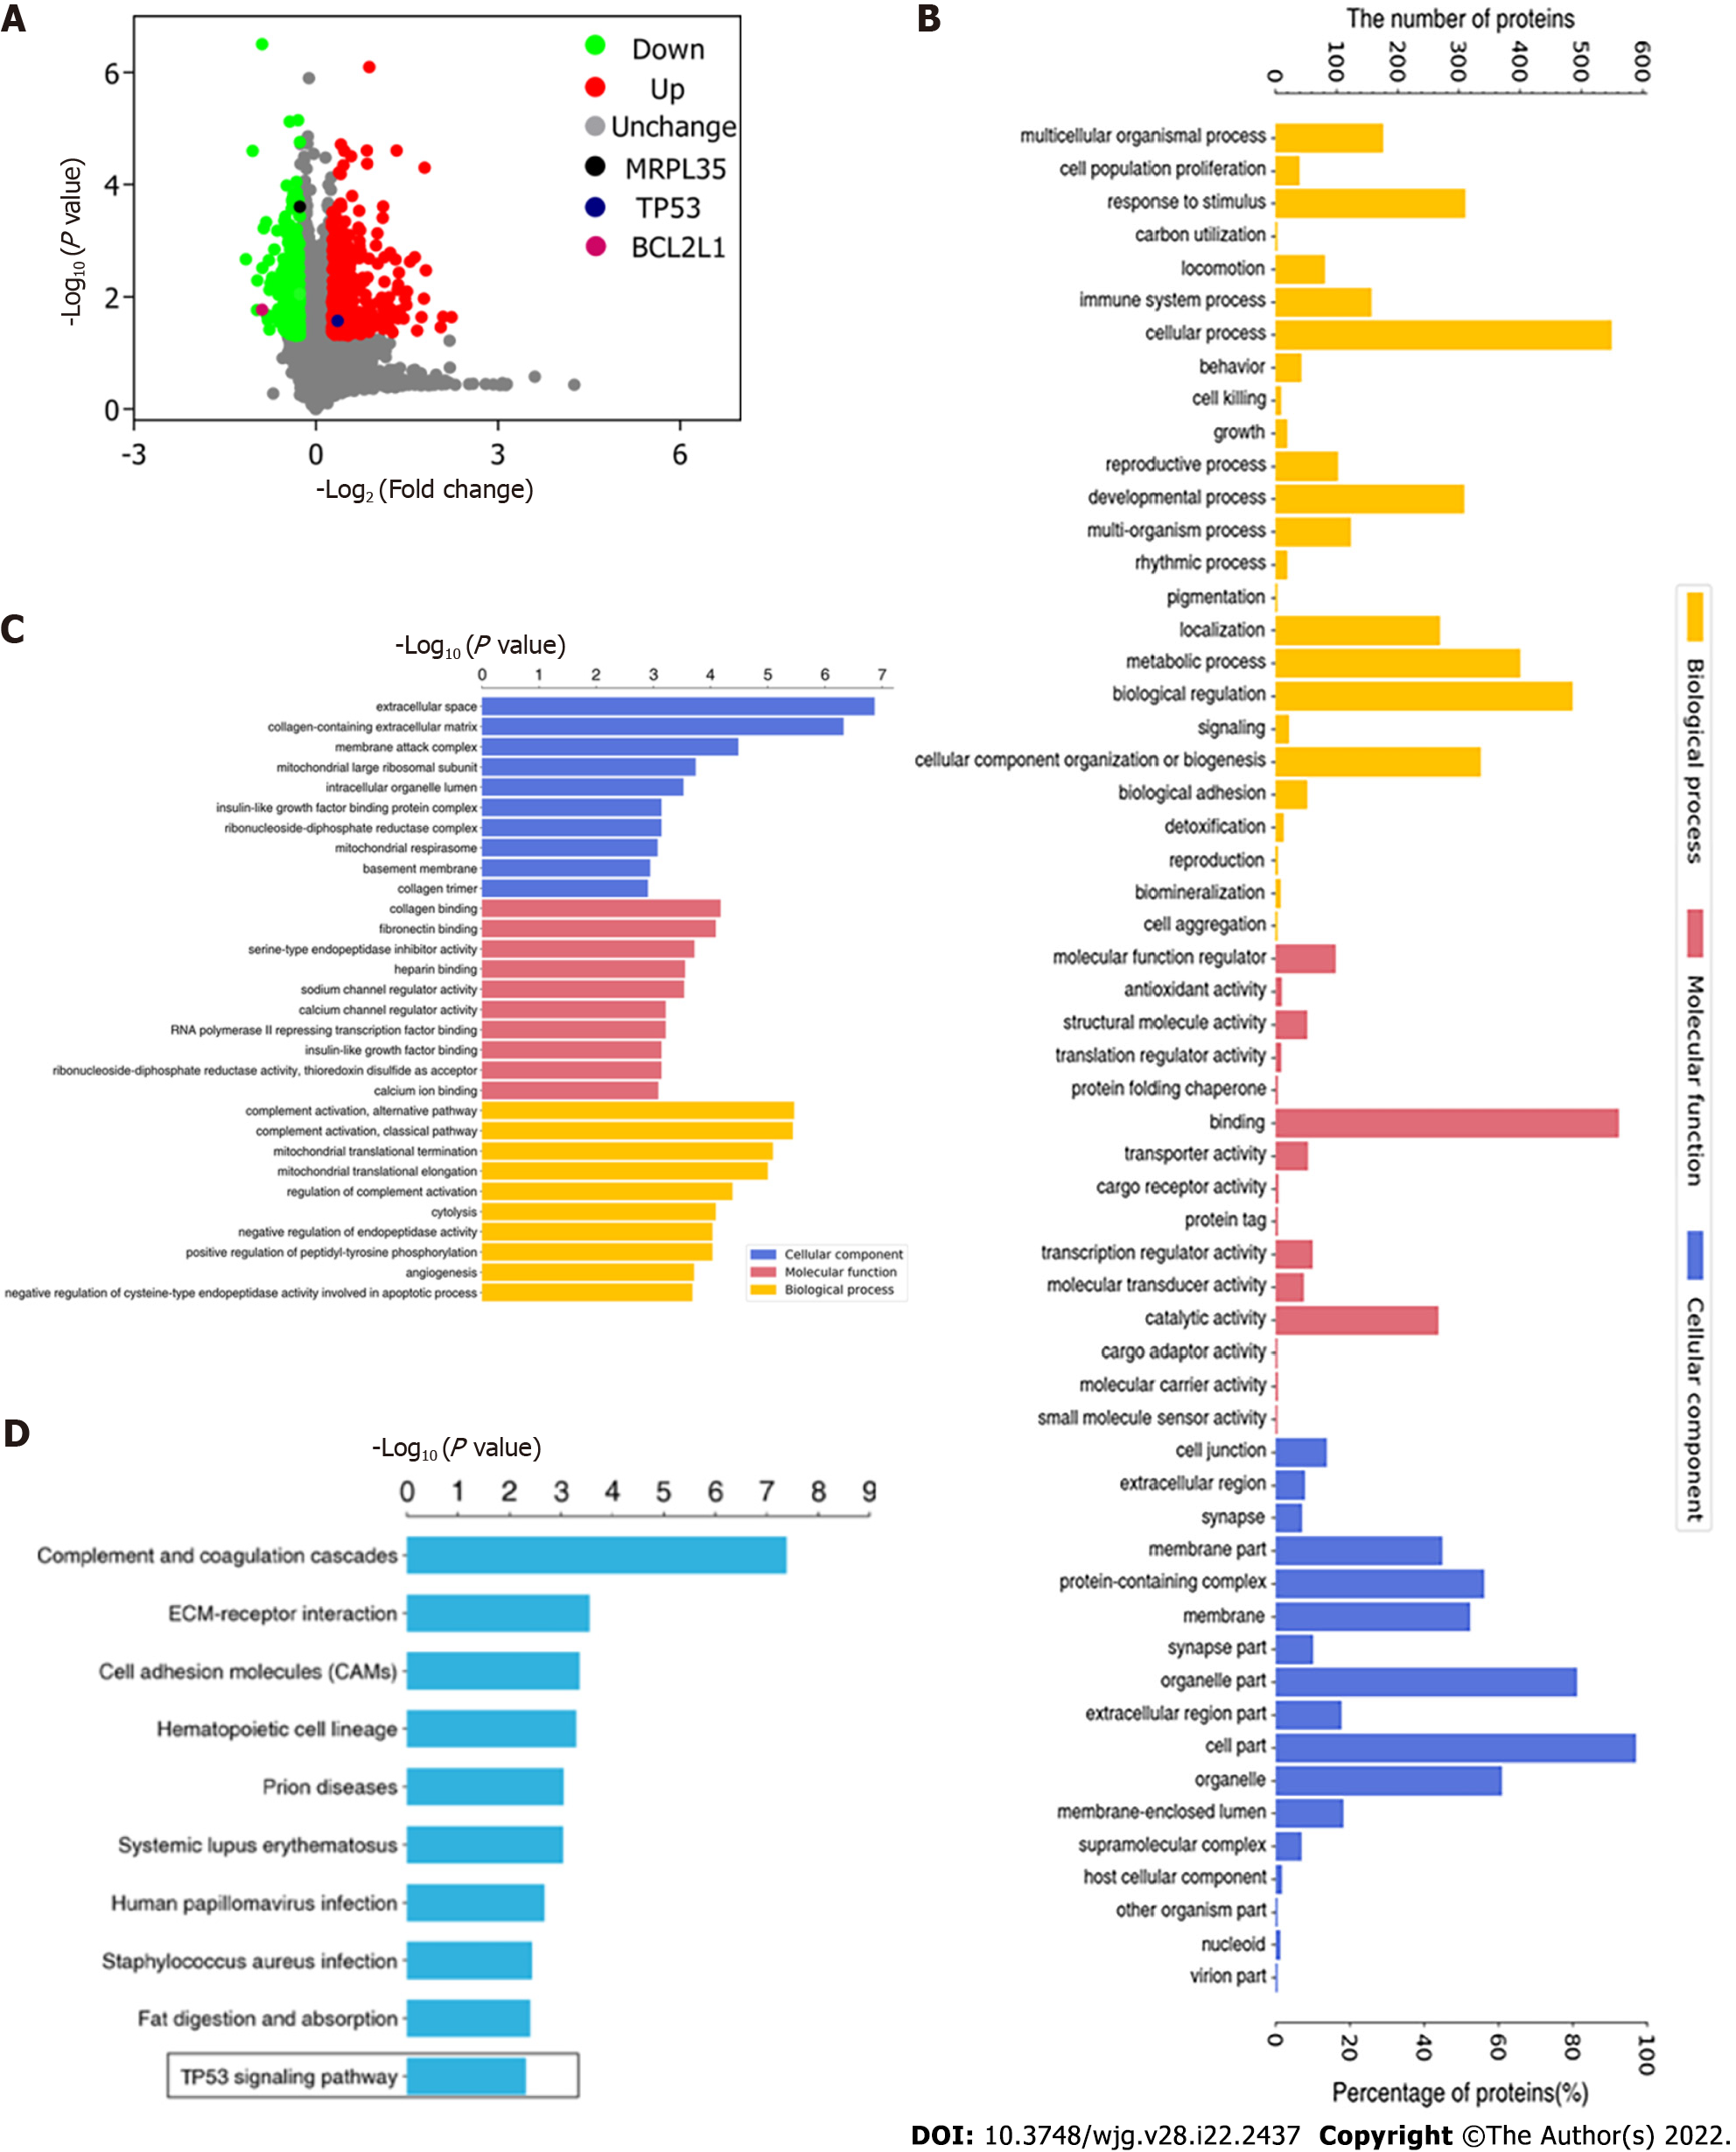
Figure 9 Volcano plot of differentially expressed proteins and Gene Ontology annotation analysis.
A: Volcano plot of differentially expressed proteins (DEPs). The horizontal axis is the relative quantitative value of protein after log2 conversion, and the vertical axis is the P value of difference significance test after -log10 conversion; B: Gene Ontology (GO) annotation analysis of DEPs. The number of DEPs categorized as biological processes, molecular functions, and cellular components; C: GO enrichment analysis of DEPs. The Y axis denotes the GO functional classification enriched by the DEPs, and the X axis denotes the −log10 of the P value of Fisher’s exact test of the significance of the enrichment; D: KEGG pathway enrichment analysis. The Y axis denotes the categories of KEGG pathways. The X axis is the −log10 of the P value of Fisher’s exact test of the significance of enrichment.
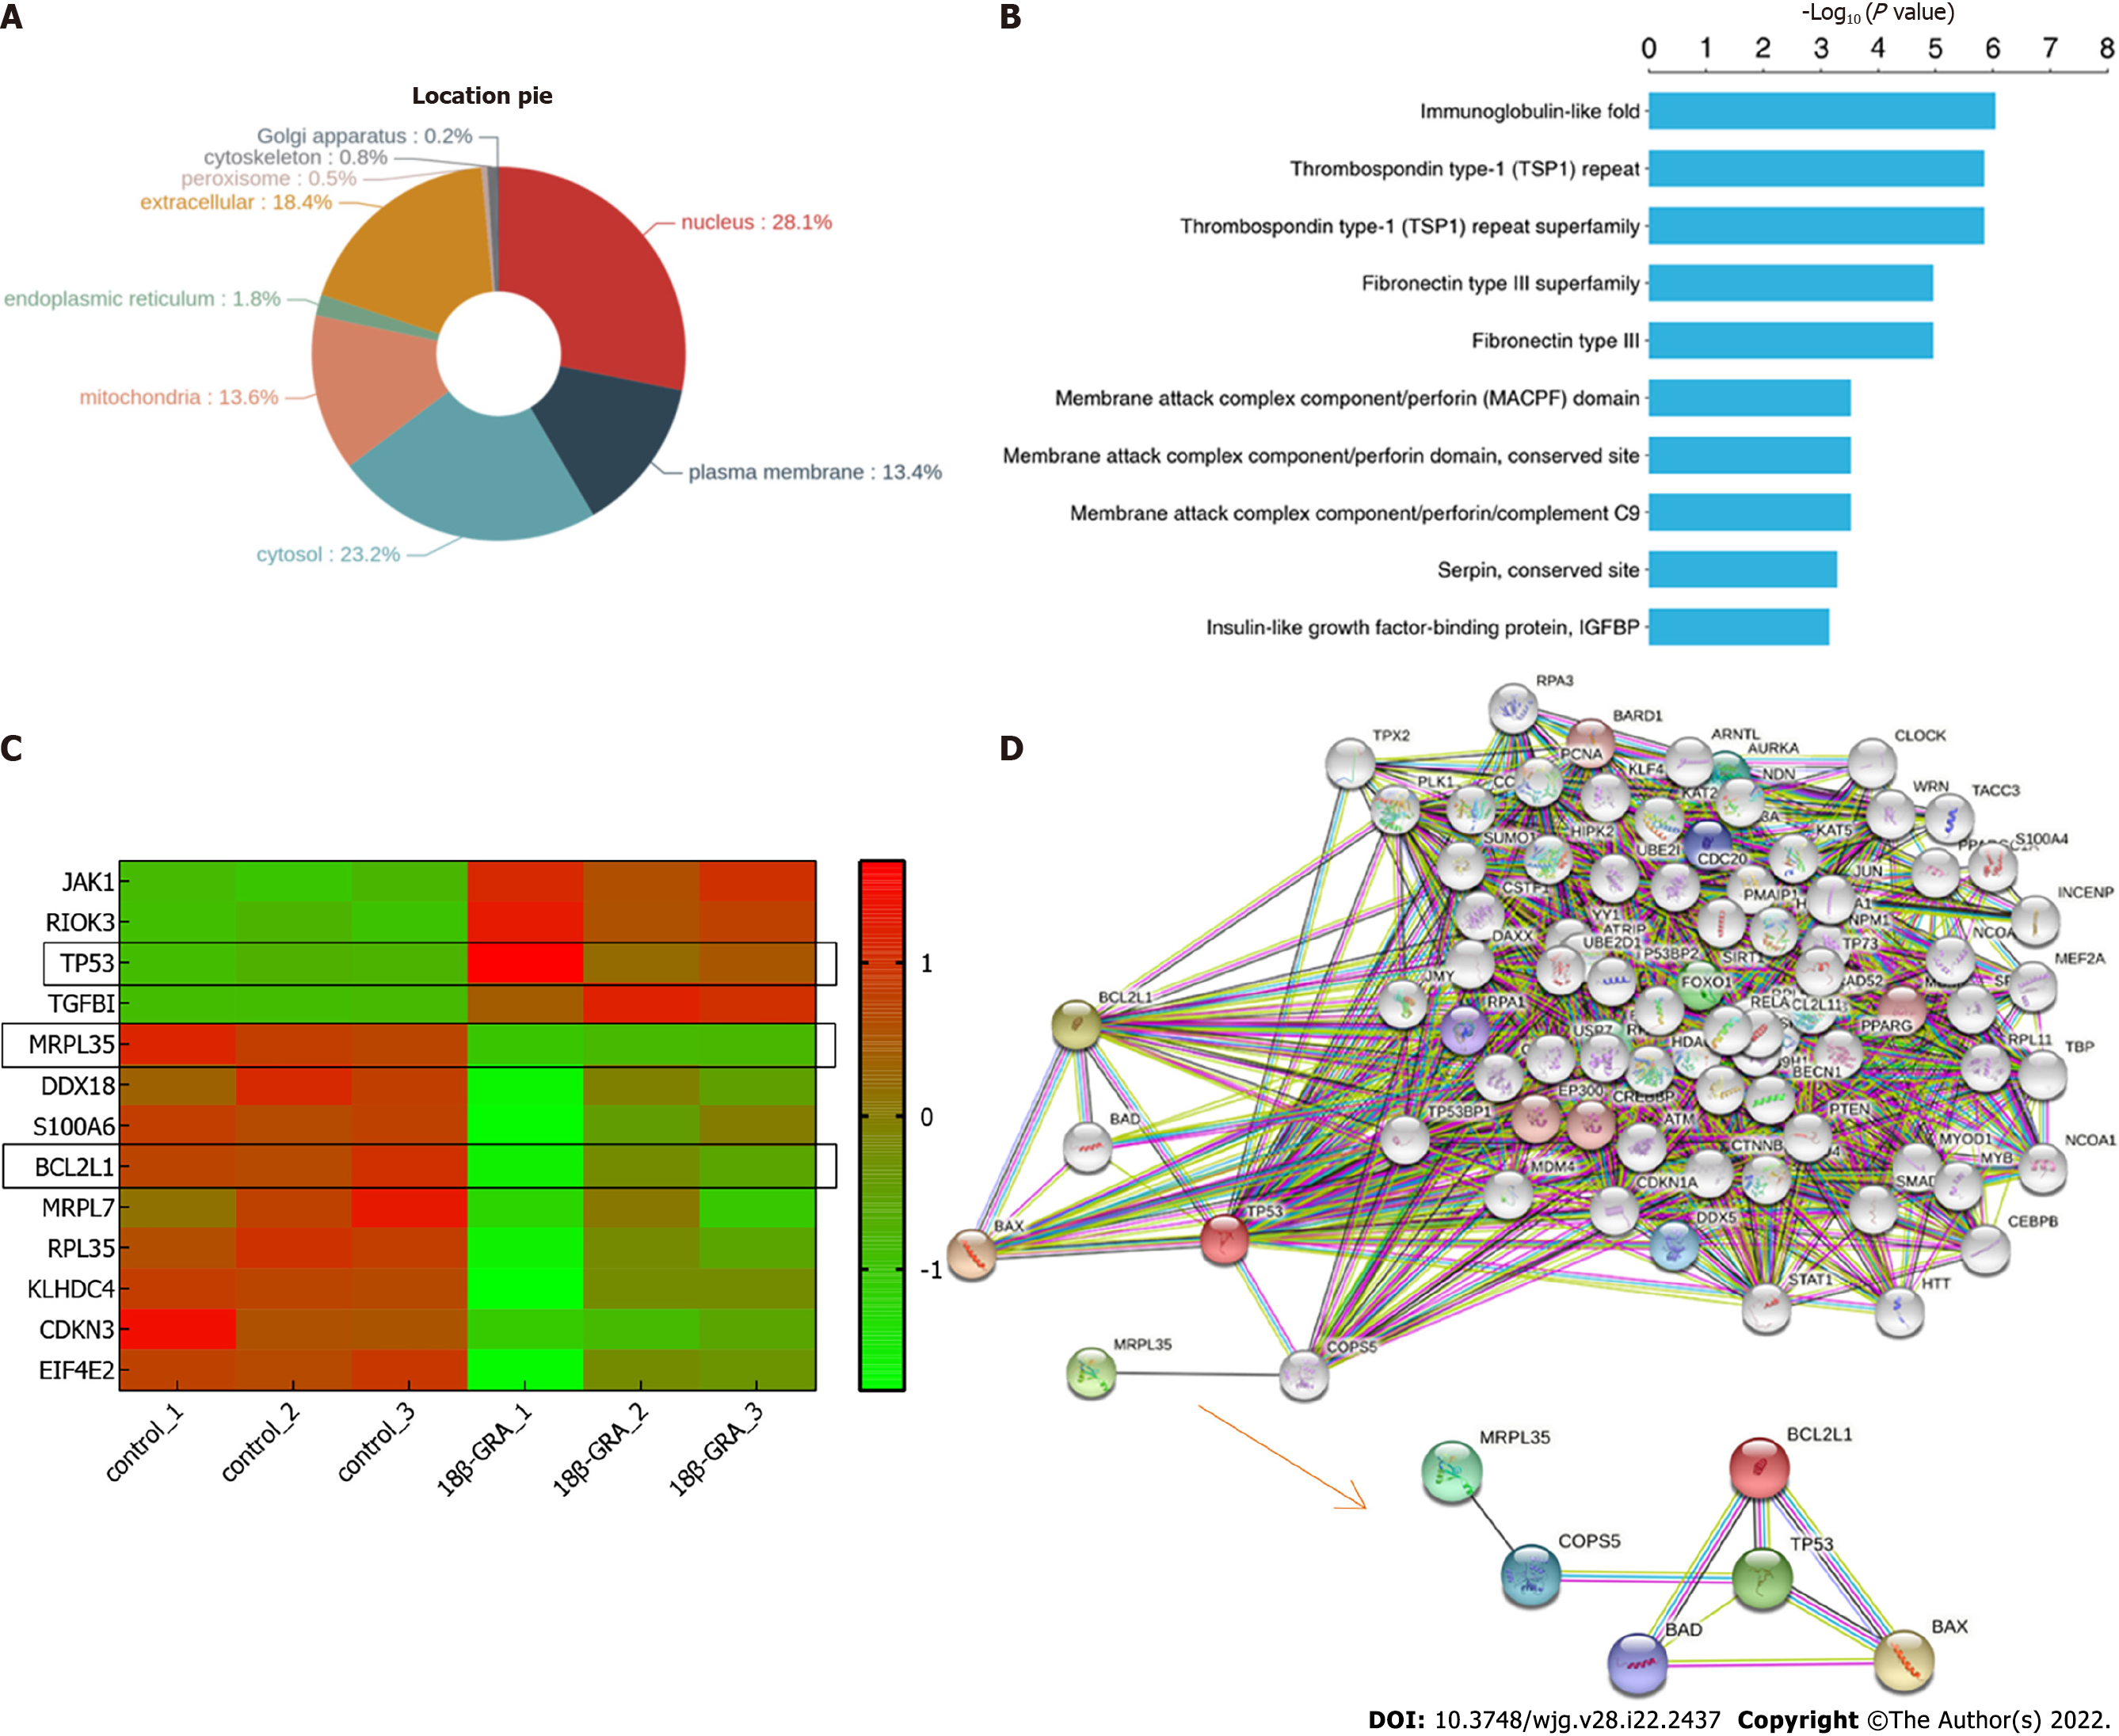
Figure 10 Differentially expressed proteins.
A: Subcellular localization chart of differentially expressed proteins (DEPs); B: Protein domain enrichment analysis. The Y axis denotes the categories of the protein domain. The X axis denotes the enrichment score [−log(P value)]; C: Heatmap of the MRPL35, TP53, BCL2L1, and so on. The X-coordinate stands for the DEPs, while Y-coordinate stands for different groups; D: Network analysis of MRPL35, TP53, and BCL2L1. The connection was illustrated using the web-based tool STRING.
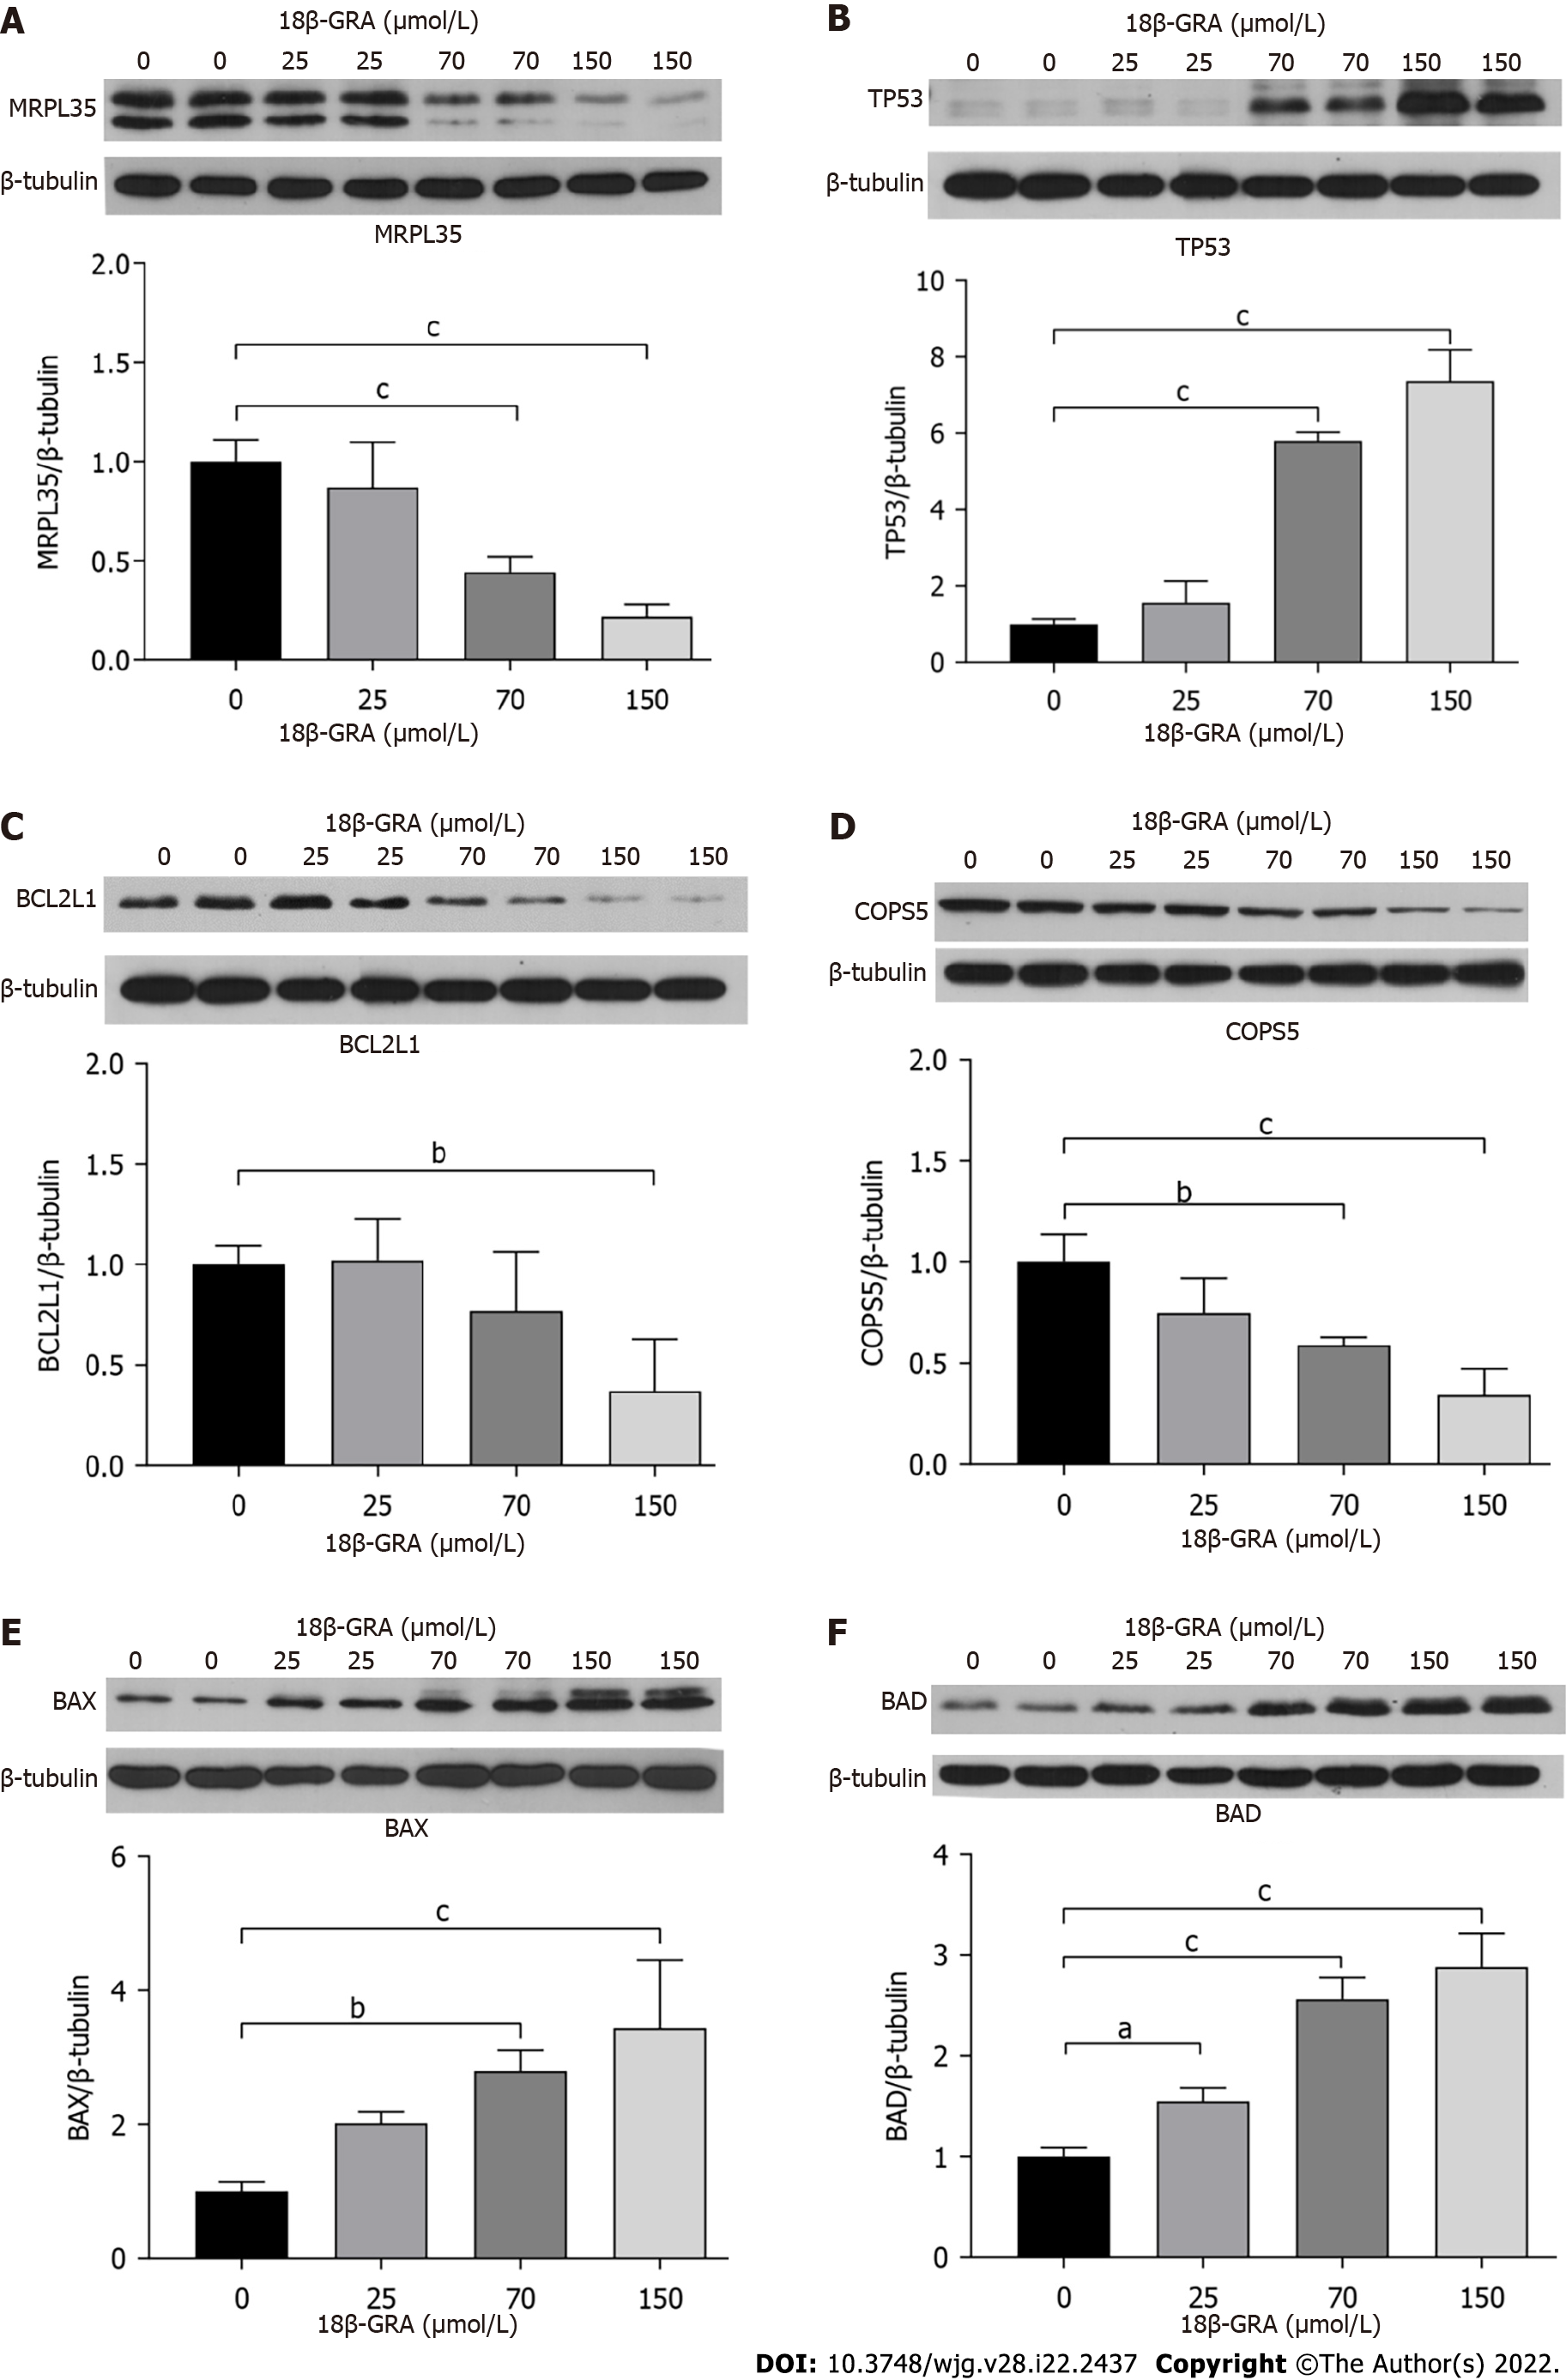
Figure 11 Validation of proteomics results using Western blot analysis of MRPL35, TP53, BCL2L1, COPS5, BAX, and BAD in cells treated with different concentrations of 18β-glycyrrhetinic acid for 48 h.
β-tubulin was used as the loading control. A: MRPL35; B: TP53; C: BCL2L1; D: COPS5; E: BAX; F: BAD n = 4, aP < 0.05; bP < 0.01; cP < 0.001. 18β-GRA: 18β-glycyrrhetinic acid; MRPL35: Mitochondrial Ribosomal Protein L35.
- Citation: Yuan L, Yang Y, Li X, Zhou X, Du YH, Liu WJ, Zhang L, Yu L, Ma TT, Li JX, Chen Y, Nan Y. 18β-glycyrrhetinic acid regulates mitochondrial ribosomal protein L35-associated apoptosis signaling pathways to inhibit proliferation of gastric carcinoma cells. World J Gastroenterol 2022; 28(22): 2437-2456
- URL: https://www.wjgnet.com/1007-9327/full/v28/i22/2437.htm
- DOI: https://dx.doi.org/10.3748/wjg.v28.i22.2437


