Copyright
©The Author(s) 2022.
World J Gastroenterol. May 14, 2022; 28(18): 1965-1980
Published online May 14, 2022. doi: 10.3748/wjg.v28.i18.1965
Published online May 14, 2022. doi: 10.3748/wjg.v28.i18.1965
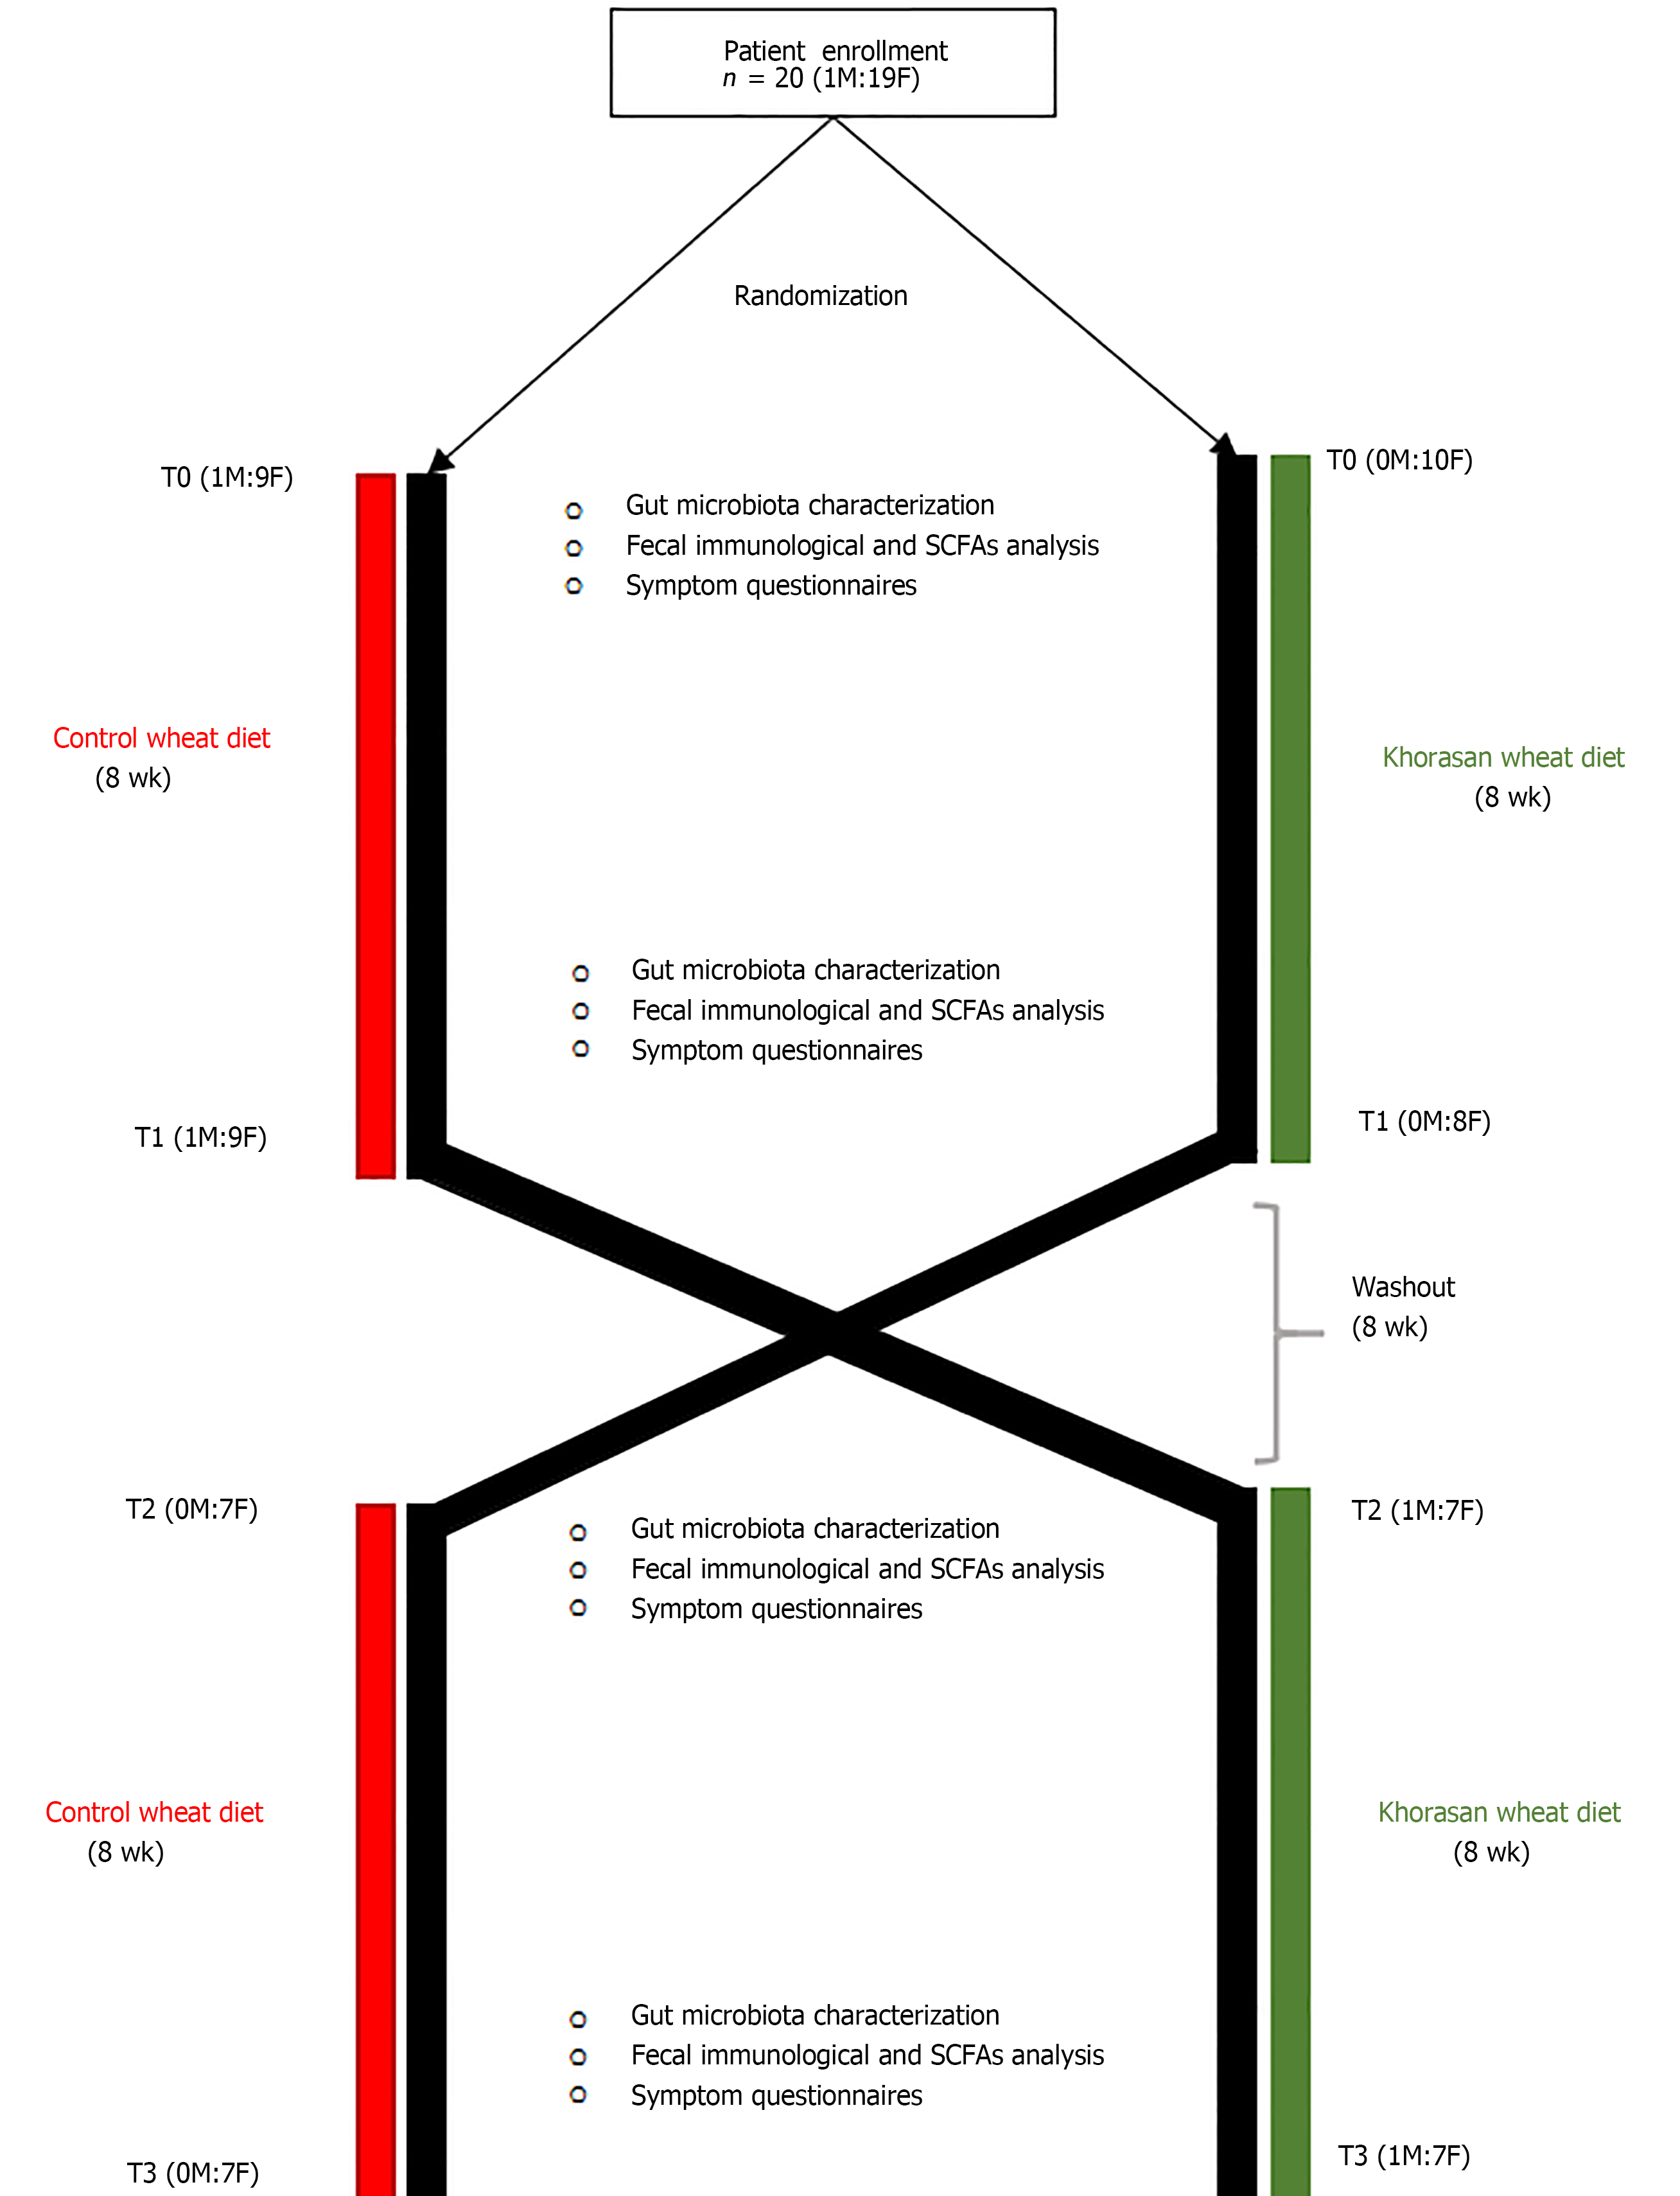
Figure 1 Workflow of the crossover intervention study.
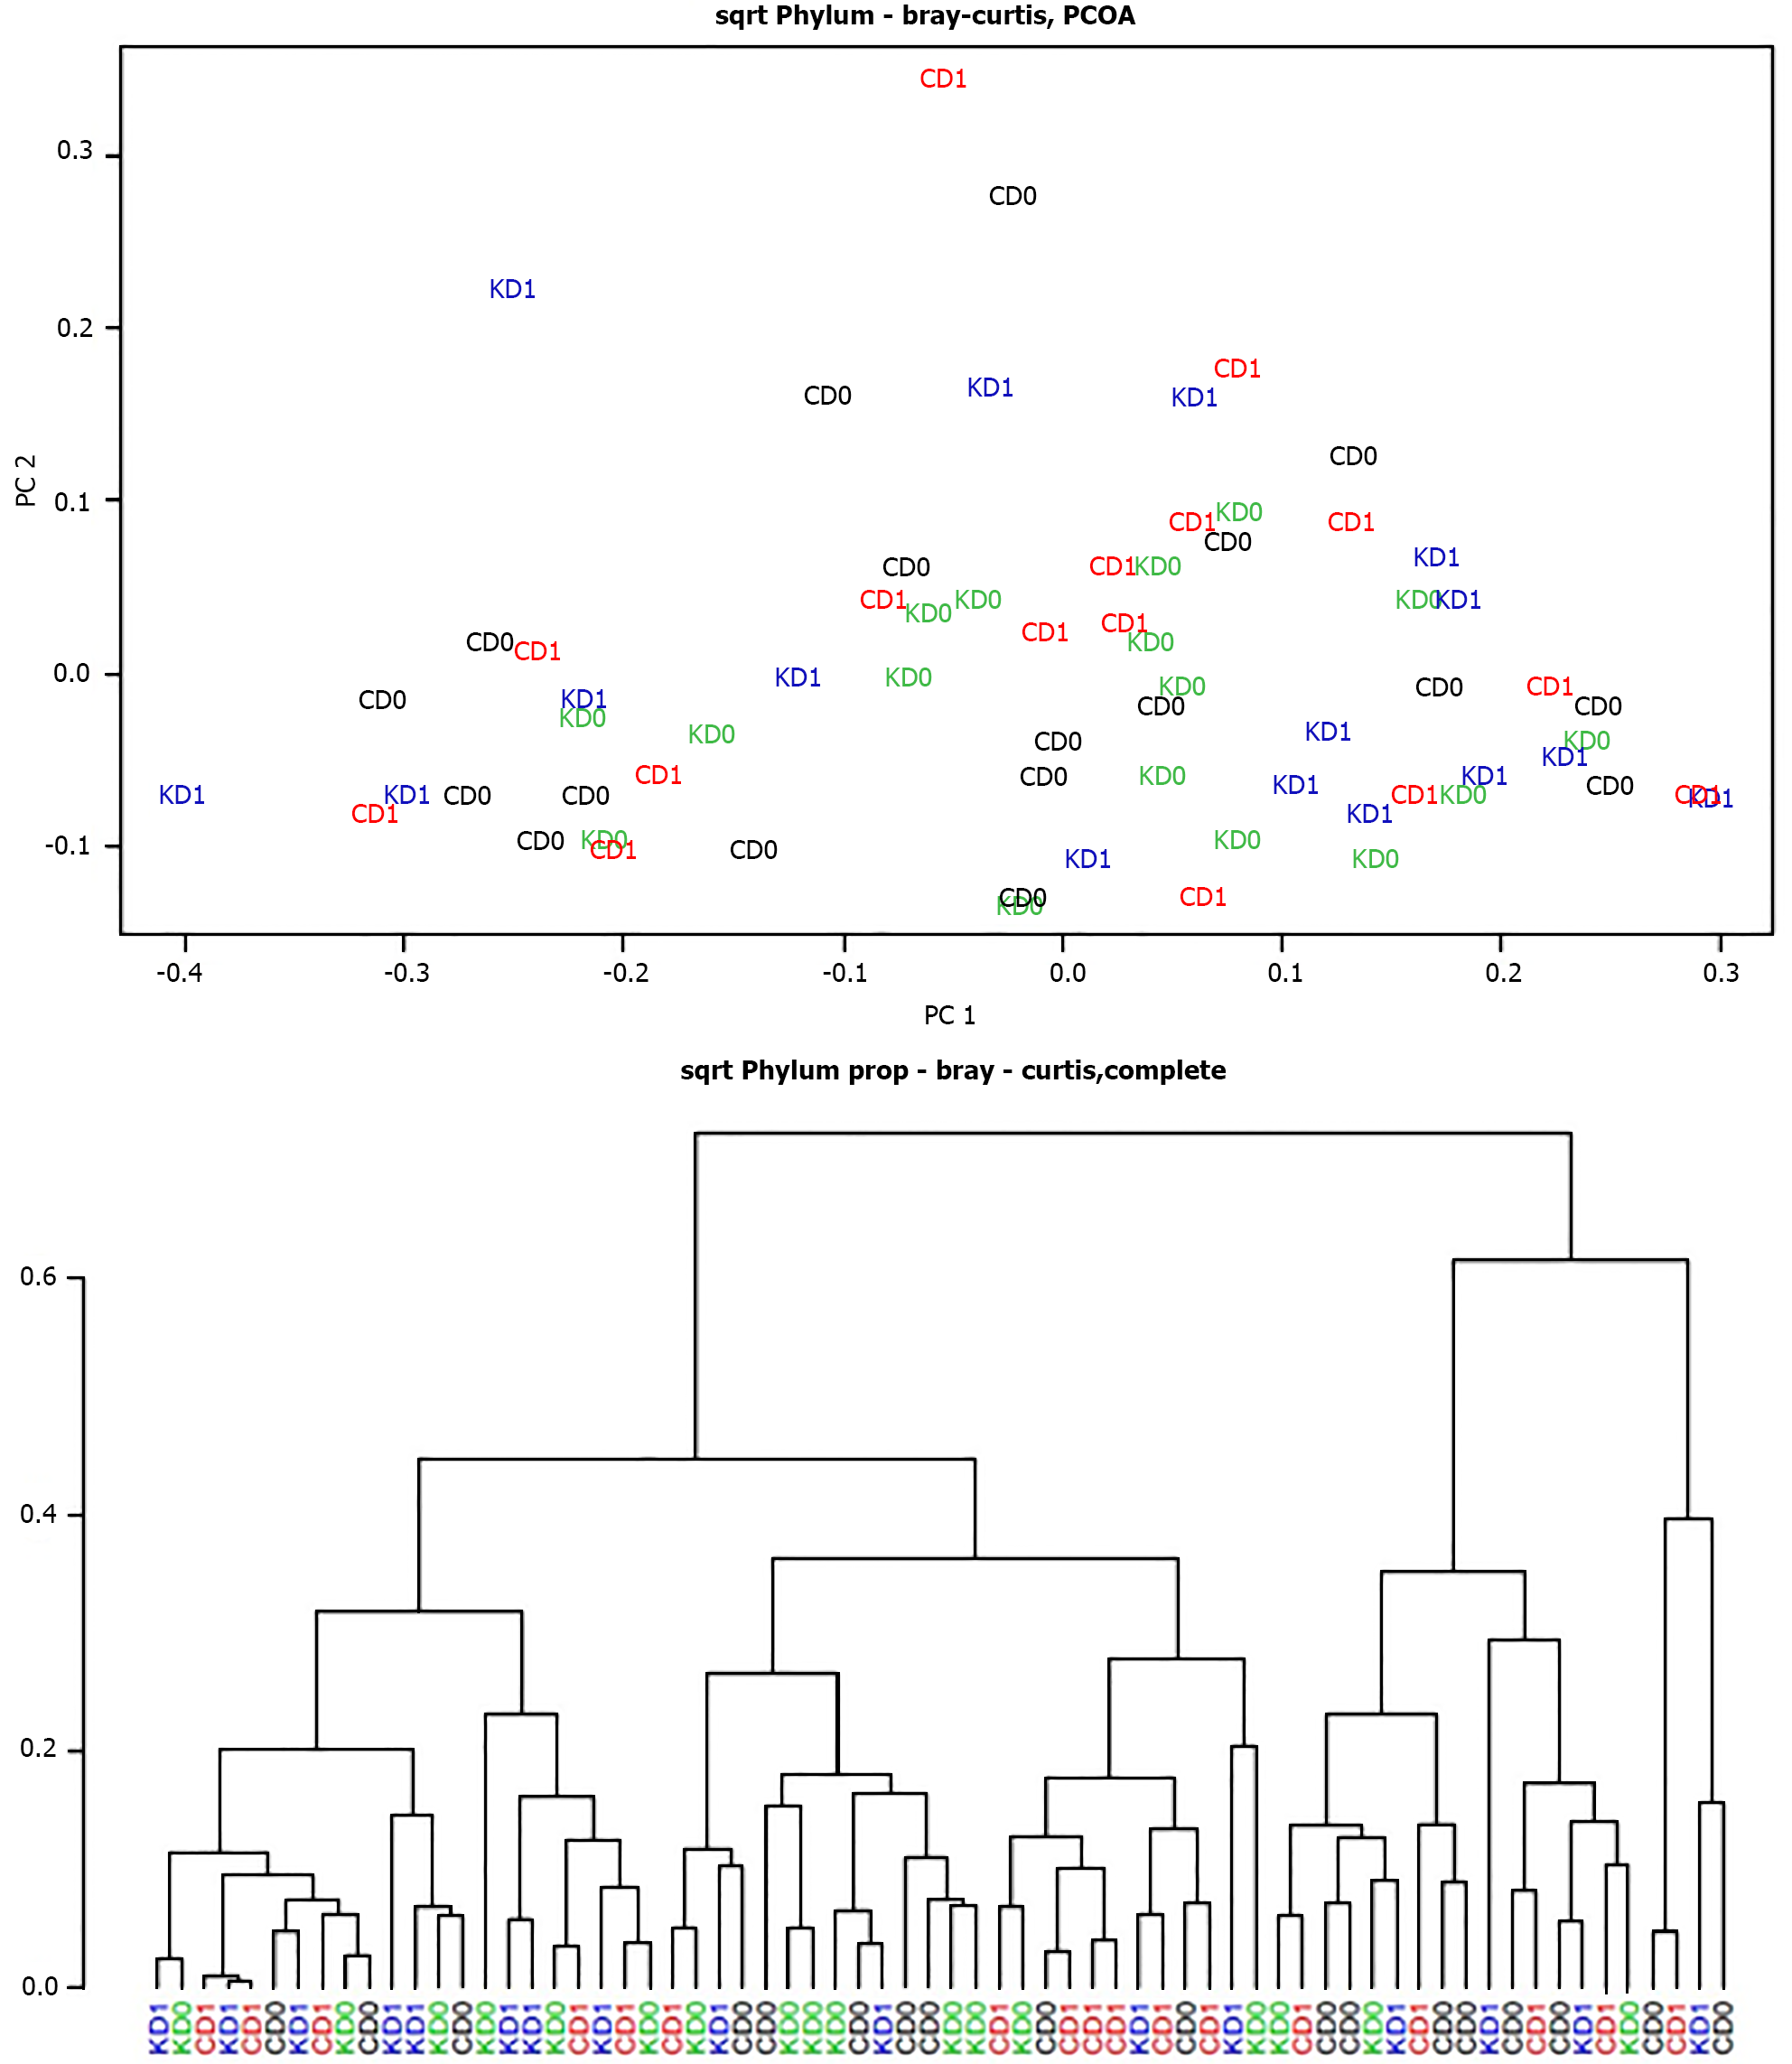
Figure 2 Cluster analysis and principal coordinate analysis of pre- and post-control-wheat-diet samples and pre- and post-Khorasan-wheat-diet samples.
A: Cluster analysis; B: Principal coordinate analysis. CD0: Pre-control wheat diet; CD1: Post-control wheat diet; KD0: Pre-Khorasan wheat diet; KD1: Post-Khorasan wheat diet.
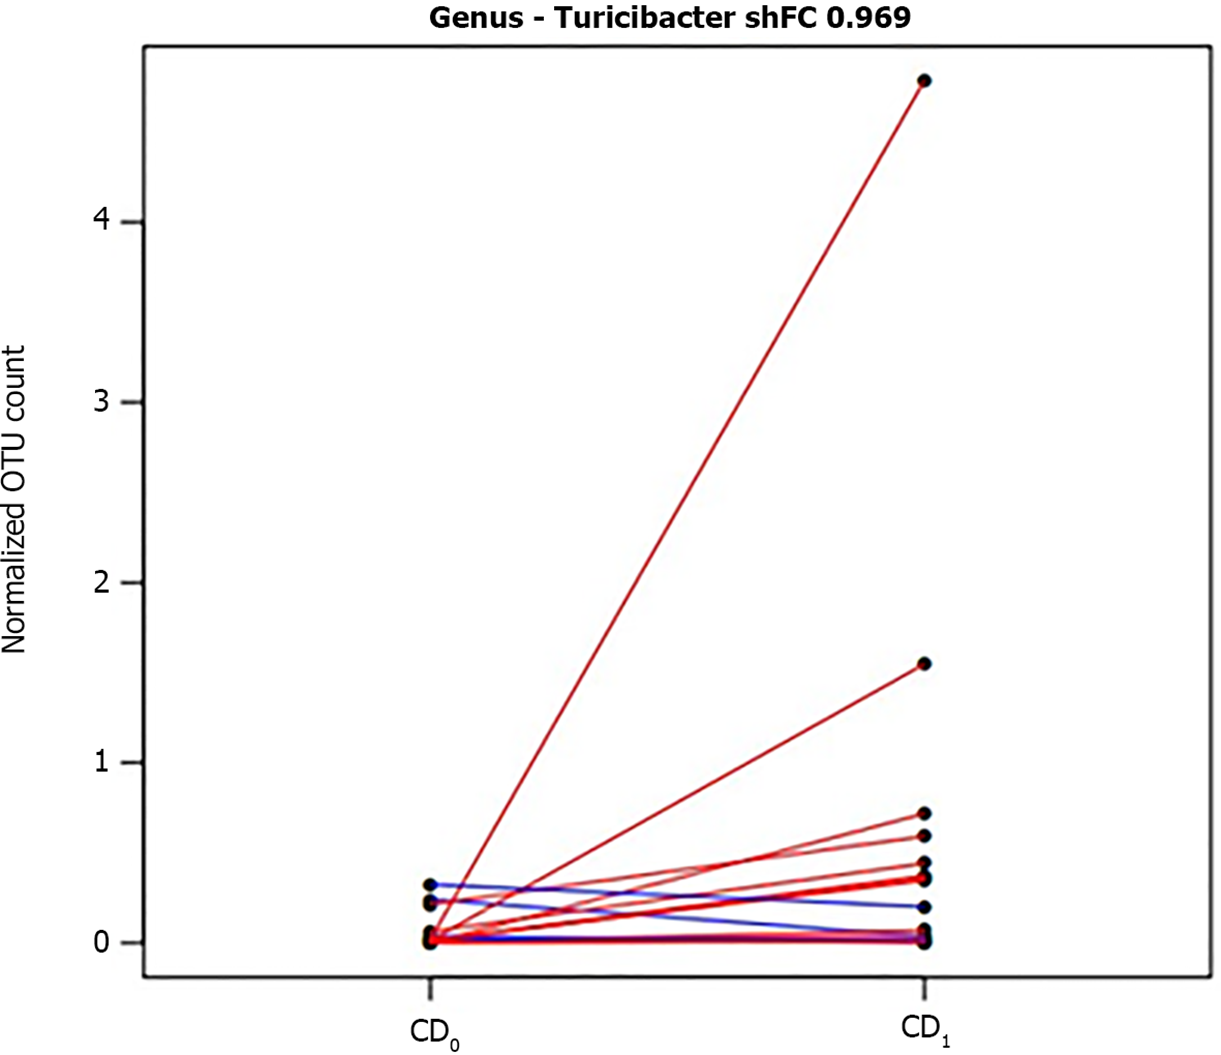
Figure 3 Segment plot showing significantly different taxa between pre- and post-control diet.
Lines link paired samples and red or blue colors respectively highlight the increase or decrease of normalized abundance for the indicated rank. Plot title reports shrinked fold change (according to the DESeq2 function lfcShrink) between pre- and post-control-wheat-diet samples. CD0: Pre-control wheat diet; CD1: Post-control wheat diet.
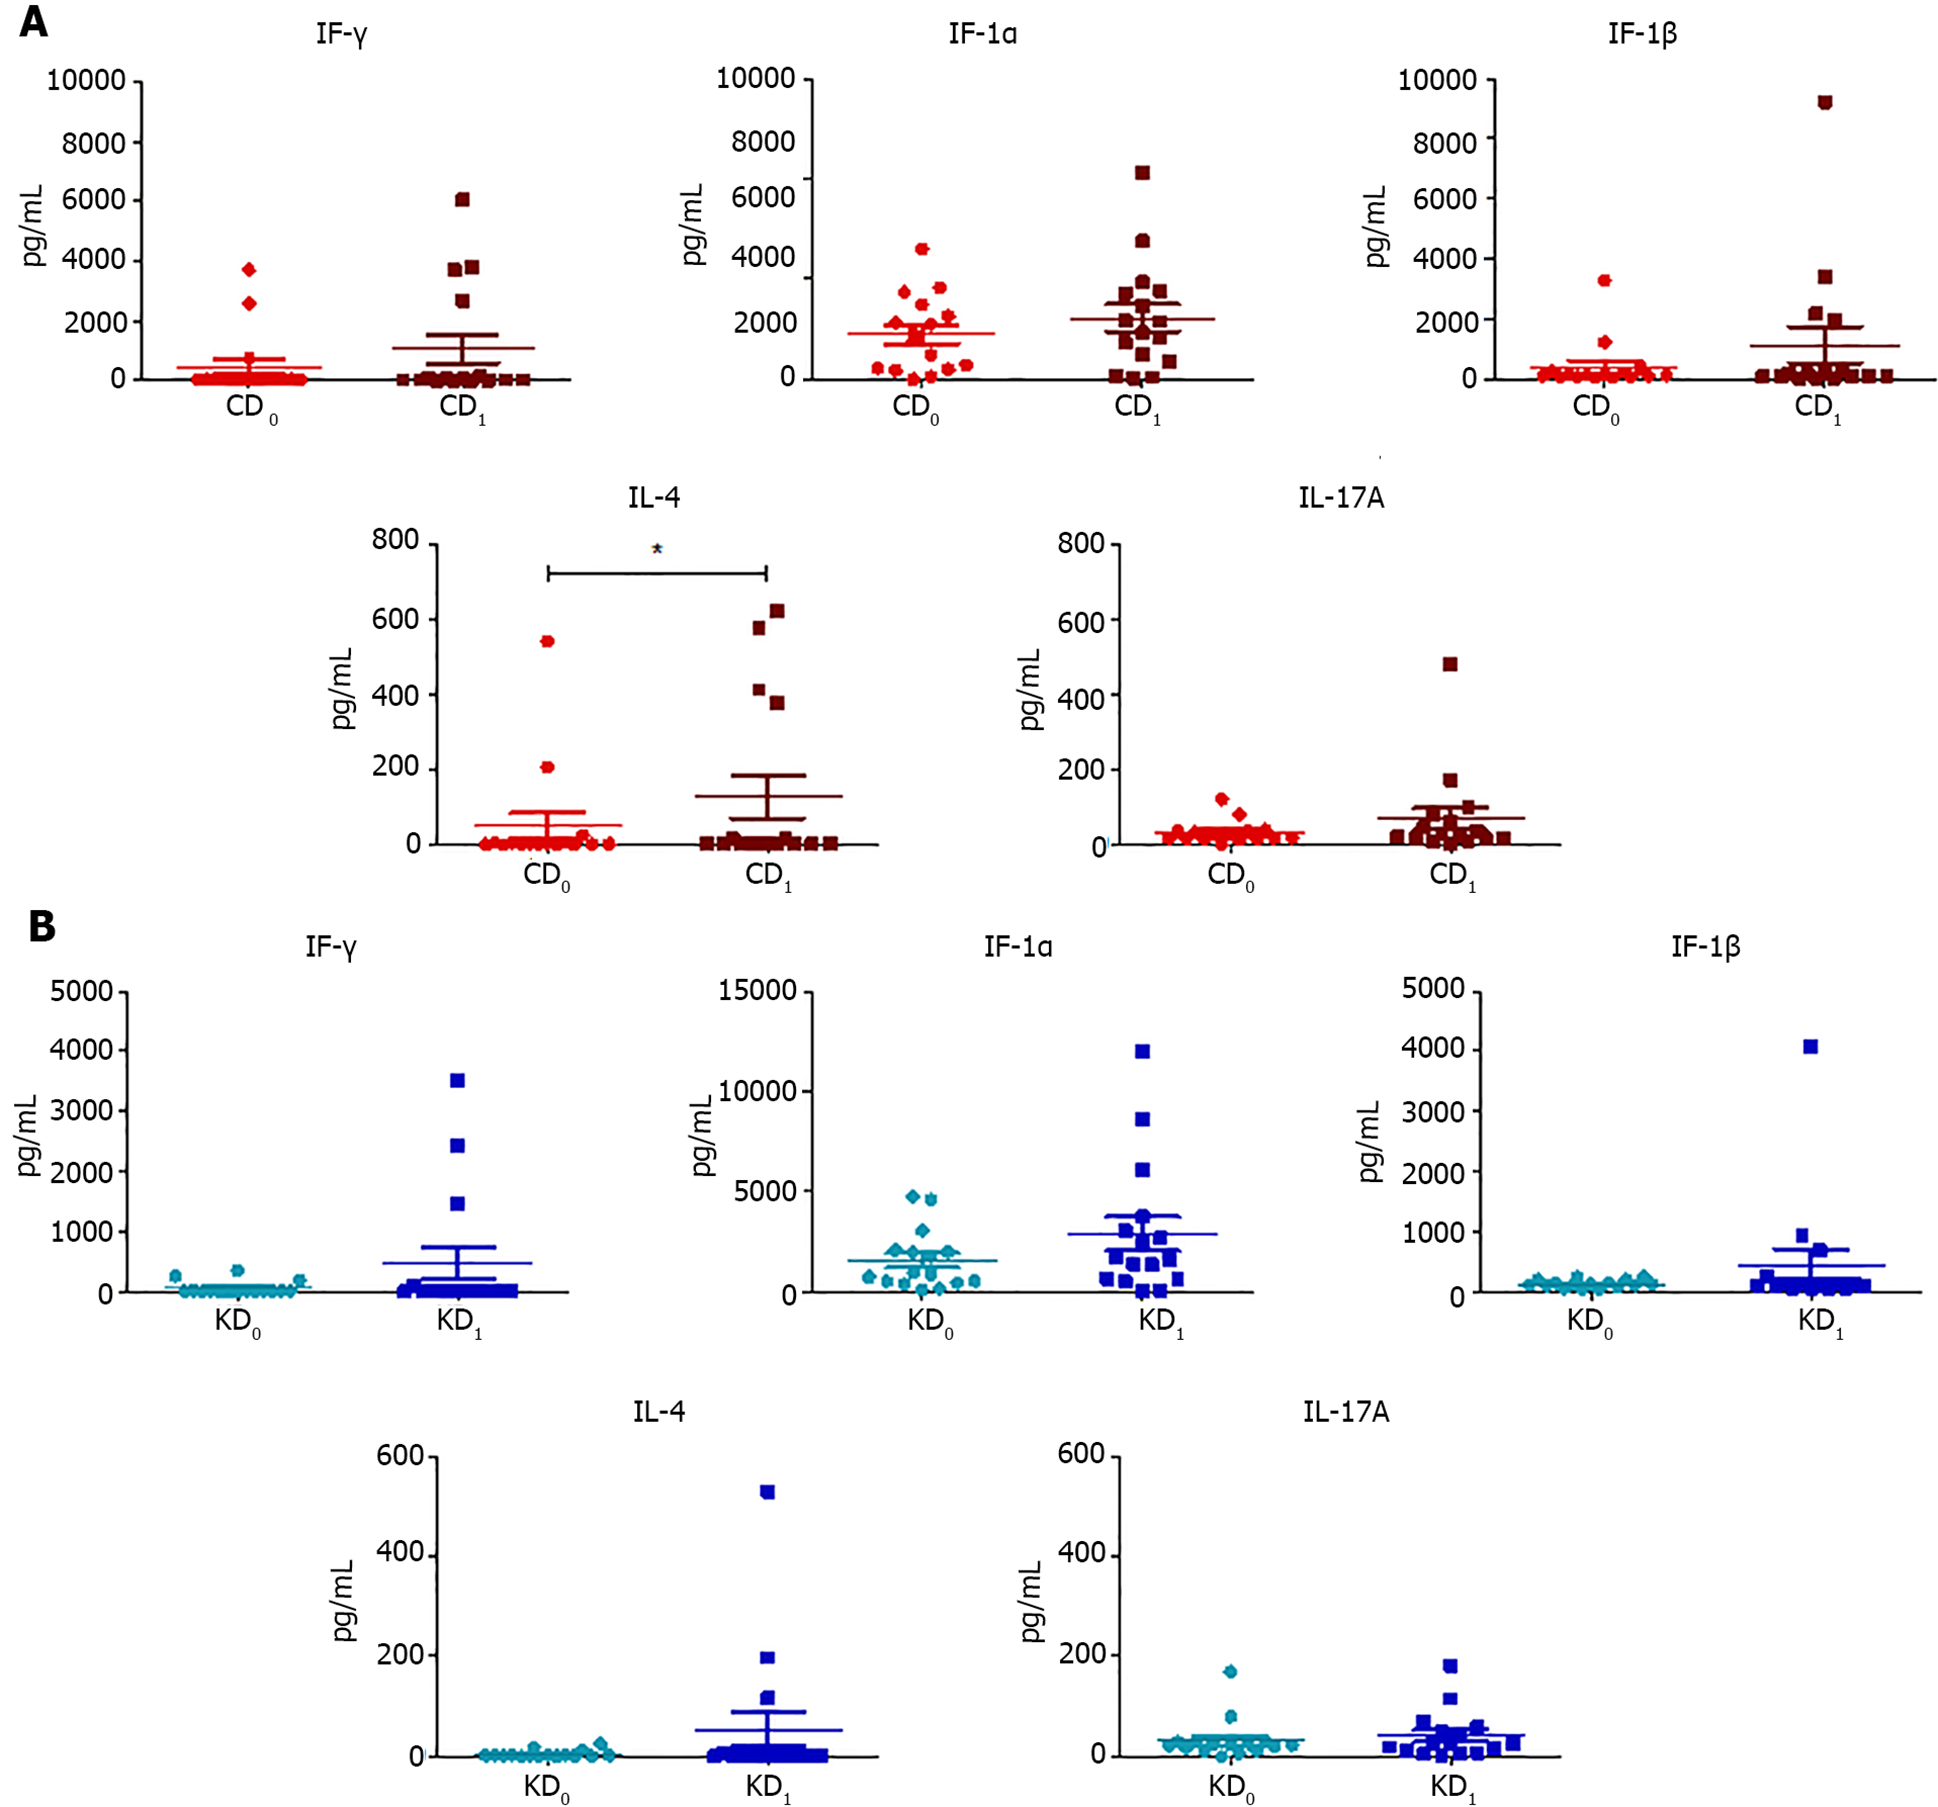
Figure 4 Scatter plots representing the fecal concentrations of interferon-γ, interleukin-1α, interleukin-1β, interleukin-4, and interleukin-17A evaluated before and after control wheat diet and before and after Khorasan wheat diet.
A: Before and after control wheat diet; B: Before and after Khorasan wheat diet. Analyses were assessed using the paired Wilcoxon signed-rank test and P values less than 0.05 were considered statistically significant. aP < 0.05, bP < 0.01, cP < 0.001. CD0: Pre-control wheat diet; CD1: Post-control wheat diet; KD0: Pre-Khorasan wheat diet; KD1: Post-Khorasan wheat diet; IL: Interleukin.
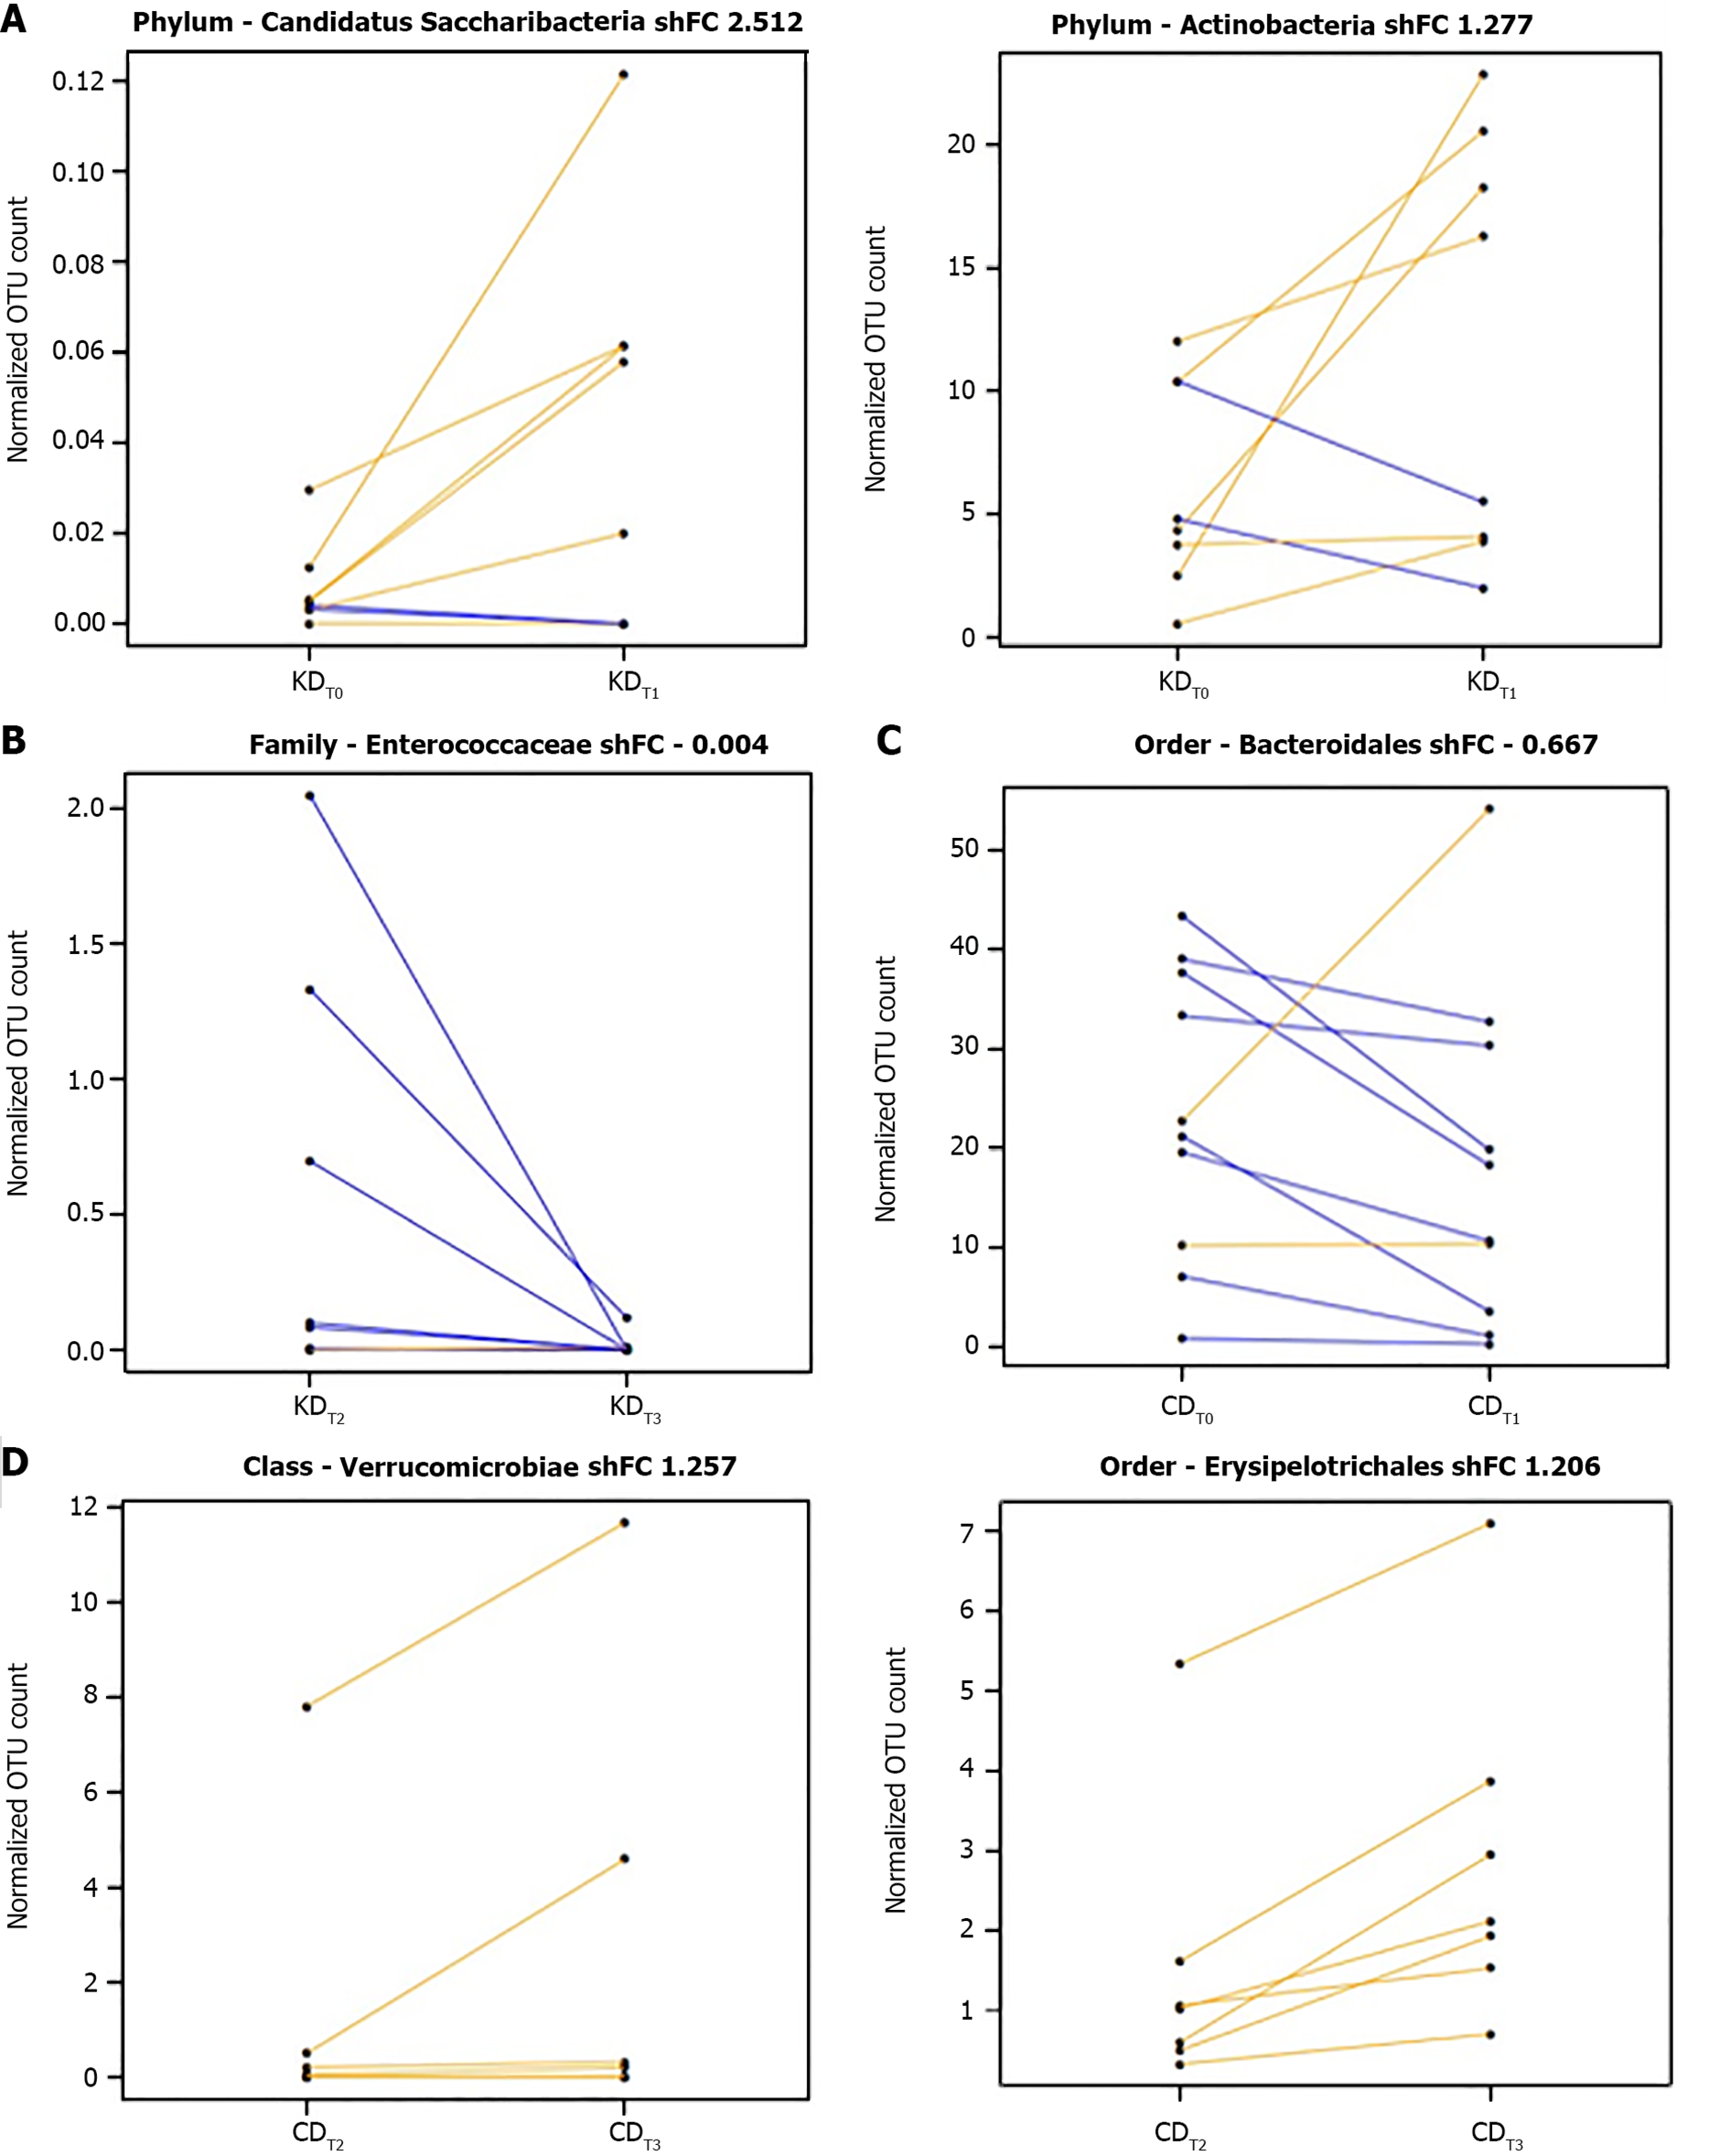
Figure 5 Segment plots showing significantly different taxa during the first arm or the second arm of the Khorasan wheat intervention and over the first arm or the second arm of the control wheat intervention.
A: The first arm of the Khorasan wheat intervention; B: The second arm of the Khorasan wheat intervention; C: The first arm of the control wheat intervention; D: The second arm of the control wheat intervention. Lines link paired samples and yellow or blue colors respectively highlight the increase or decrease of normalized abundance for the indicated rank. Plot title reports Shrinked fold change (according to the DESeq2 function lfcShrink) between pre- and post-diet groups included in the two arms of either Khorasan wheat or control wheat interventions. CDT0: Pre-control-wheat-diet first arm; CDT1: Post-control-wheat-diet first arm; CDT2: Pre-control-wheat-diet second arm; CDT3: Post-control-wheat-diet second arm; KDT0: Pre-Khorasan-wheat-diet first arm; KDT1: Post-Khorasan-wheat-diet first arm; KDT2: Pre-Khorasan-wheat-diet second arm; KDT3: Post-Khorasan-wheat-diet second arm.
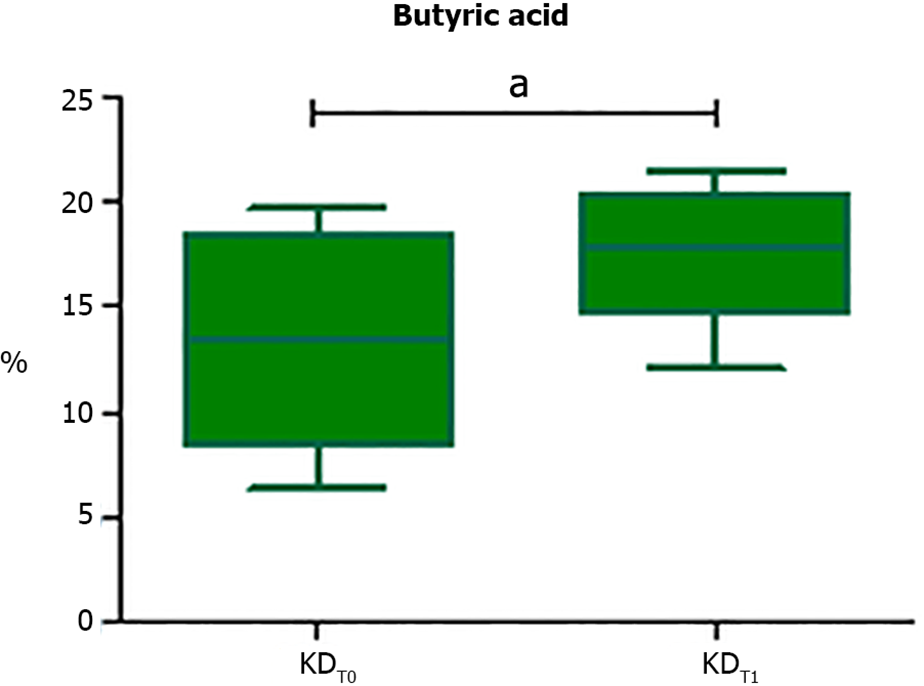
Figure 6 Box plot reporting statistically significant different butyric acid contents at the end of the Khorasan-wheat-diet first arm.
Analyses were assessed using the paired Wilcoxon signed-rank test and P values less than 0.05 were considered statistically significant. aP < 0.05, bP < 0.01, cP < 0.001. KDT0: Pre-Khorasan-wheat-diet first arm; KDT1: Post-Khorasan-wheat-diet first arm.
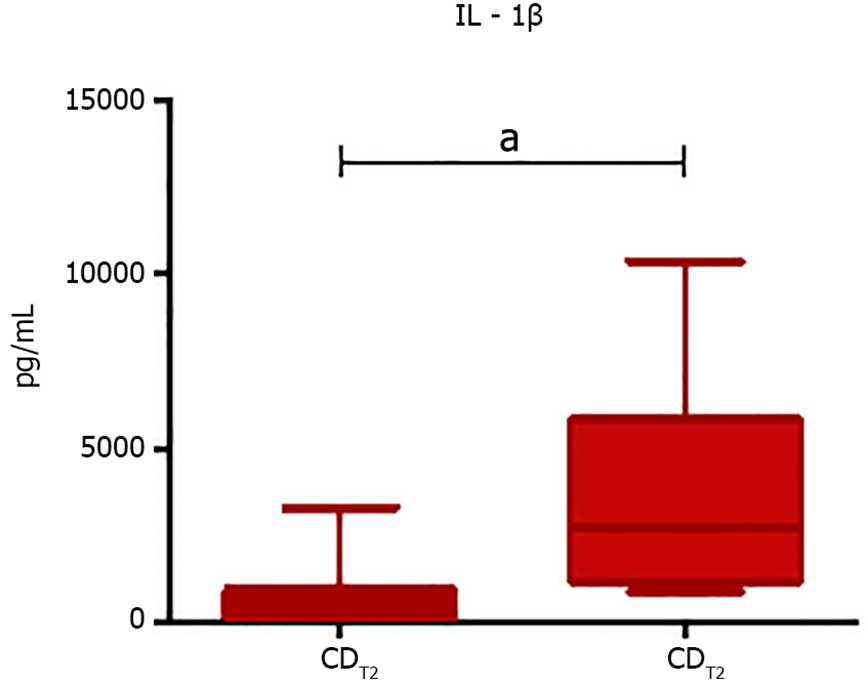
Figure 7 Box plot representing statistically significant different IL-1β levels at the end of the second control wheat diet arm.
Analyses were assessed using the paired Wilcoxon signed-rank test and P values less than 0.05 were considered statistically significant. aP < 0.05, bP < 0.01, cP < 0.001. IL: Interleukin; CDT2: Pre-control-wheat-diet second arm; CDT3: Post-control-wheat-diet second arm.
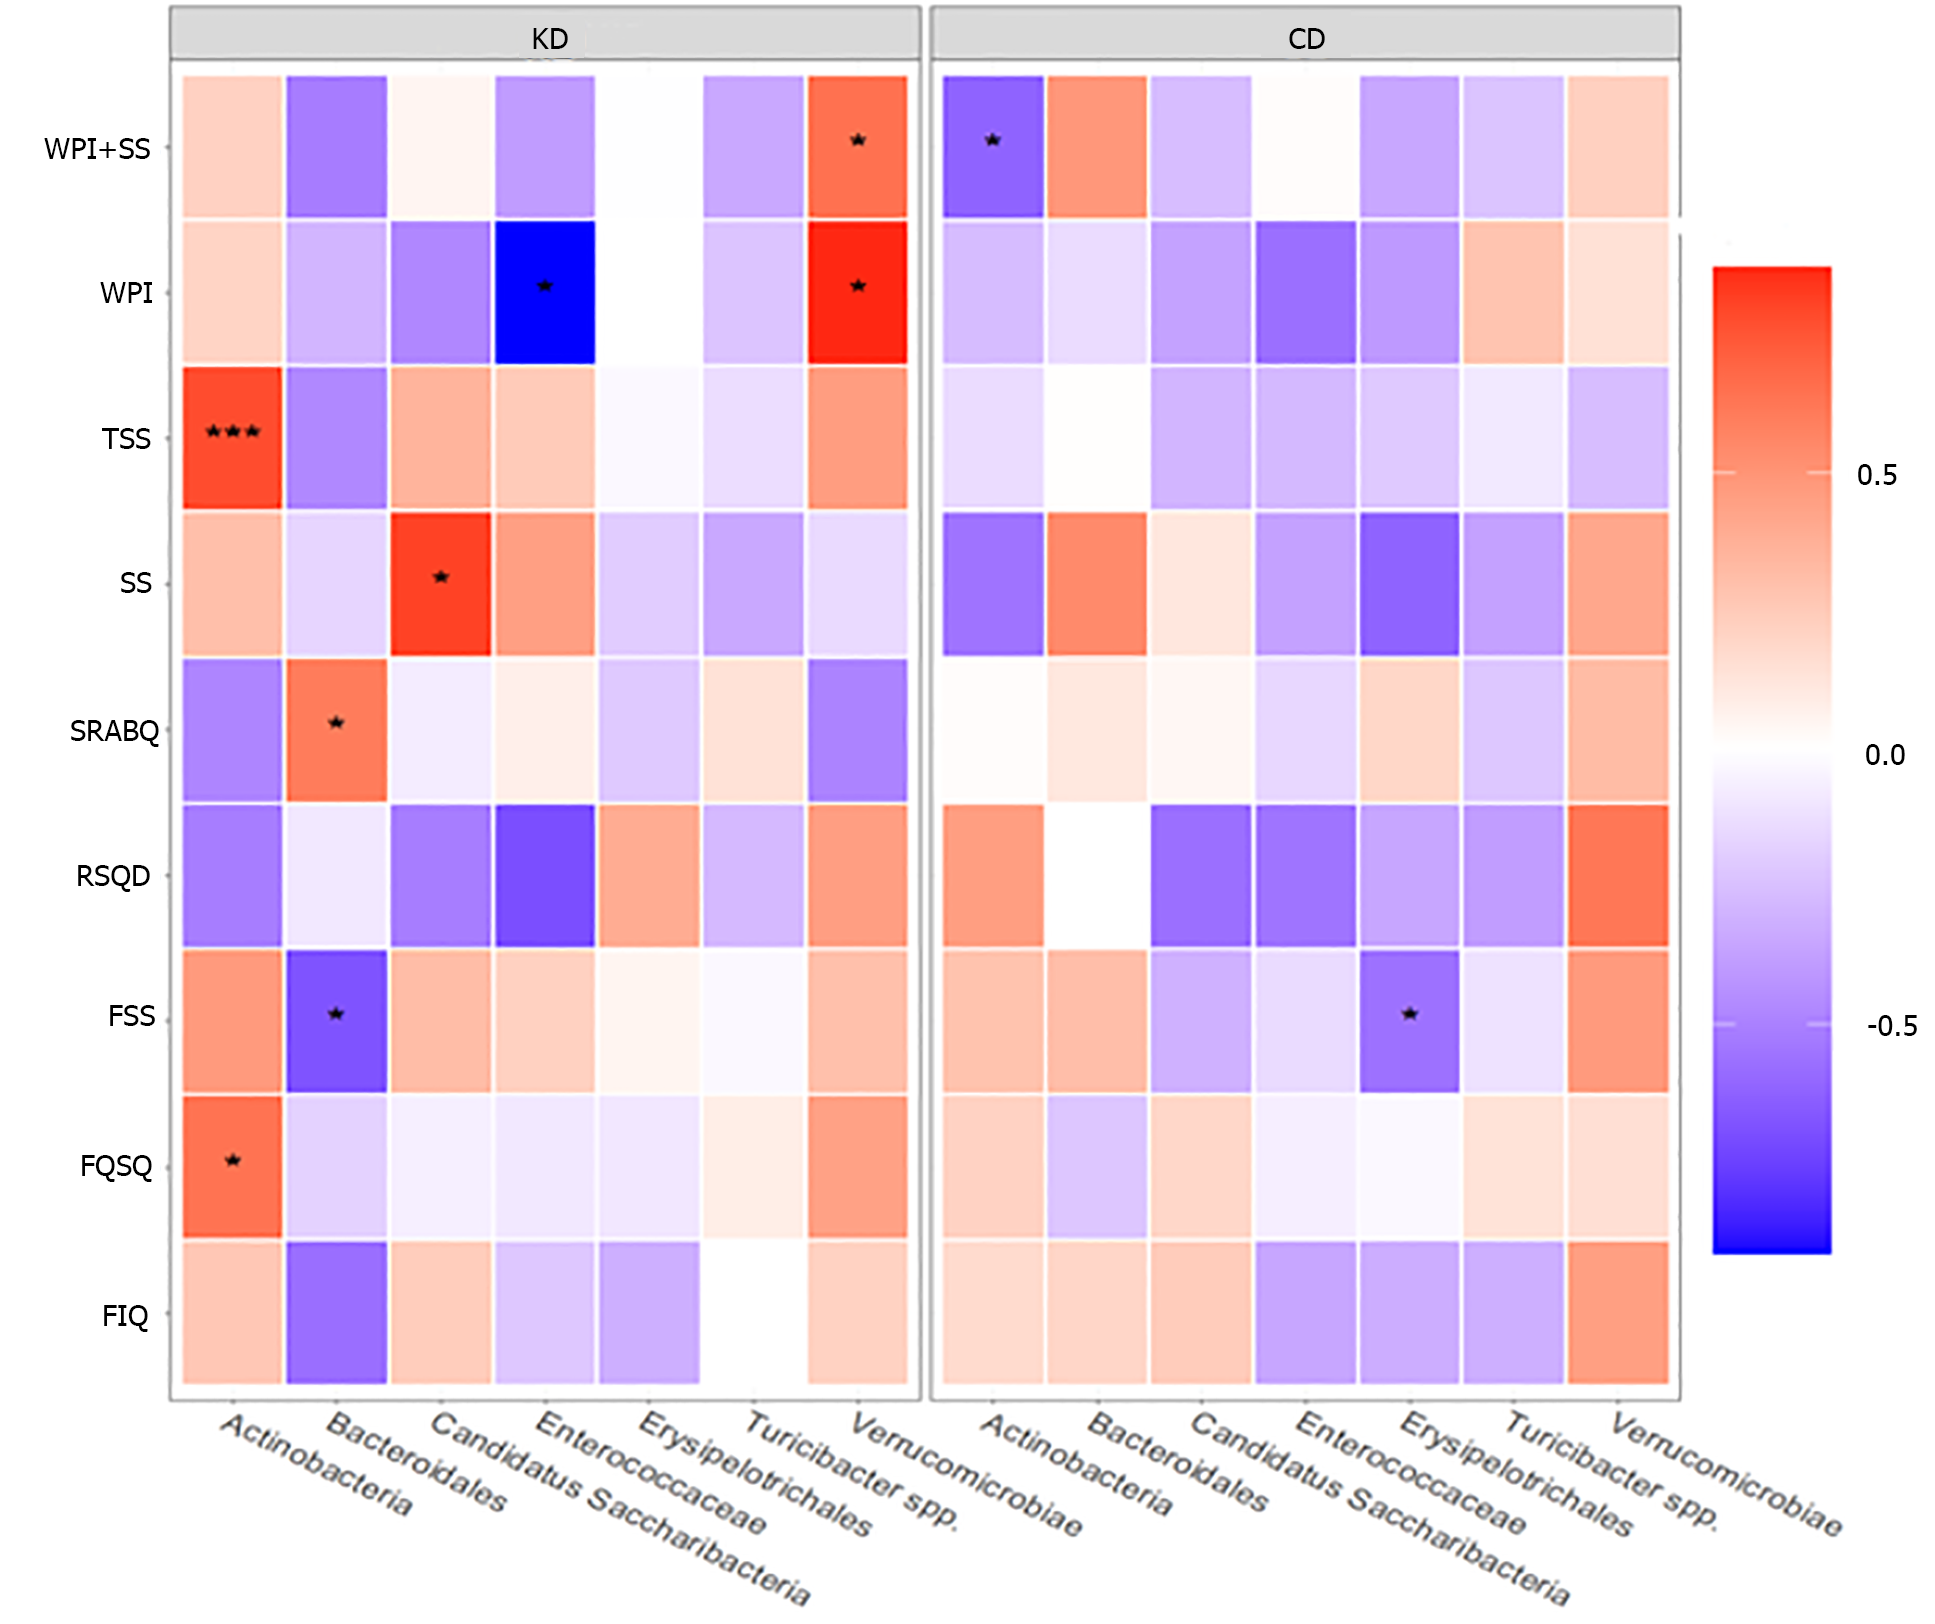
Figure 8 Heatmap of Spearman correlations between statistically significant different taxa (post-pre) and changes in questionnaire scores (post-pre), according to the Khorasan wheat diet or control wheat diet.
Red shades indicate positive correlations, whereas blue shades indicate negative correlations; the intensity of colors represents the degree of association. P values less than 0.05 were considered statistically significant. aP < 0.05, bP < 0.01, cP < 0.001. KD: Khorasan wheat diet; CD: Control wheat diet.
- Citation: Baldi S, Pagliai G, Dinu M, Di Gloria L, Nannini G, Curini L, Pallecchi M, Russo E, Niccolai E, Danza G, Benedettelli S, Ballerini G, Colombini B, Bartolucci G, Ramazzotti M, Sofi F, Amedei A. Effect of ancient Khorasan wheat on gut microbiota, inflammation, and short-chain fatty acid production in patients with fibromyalgia. World J Gastroenterol 2022; 28(18): 1965-1980
- URL: https://www.wjgnet.com/1007-9327/full/v28/i18/1965.htm
- DOI: https://dx.doi.org/10.3748/wjg.v28.i18.1965


