Copyright
©The Author(s) 2022.
World J Gastroenterol. May 7, 2022; 28(17): 1781-1797
Published online May 7, 2022. doi: 10.3748/wjg.v28.i17.1781
Published online May 7, 2022. doi: 10.3748/wjg.v28.i17.1781
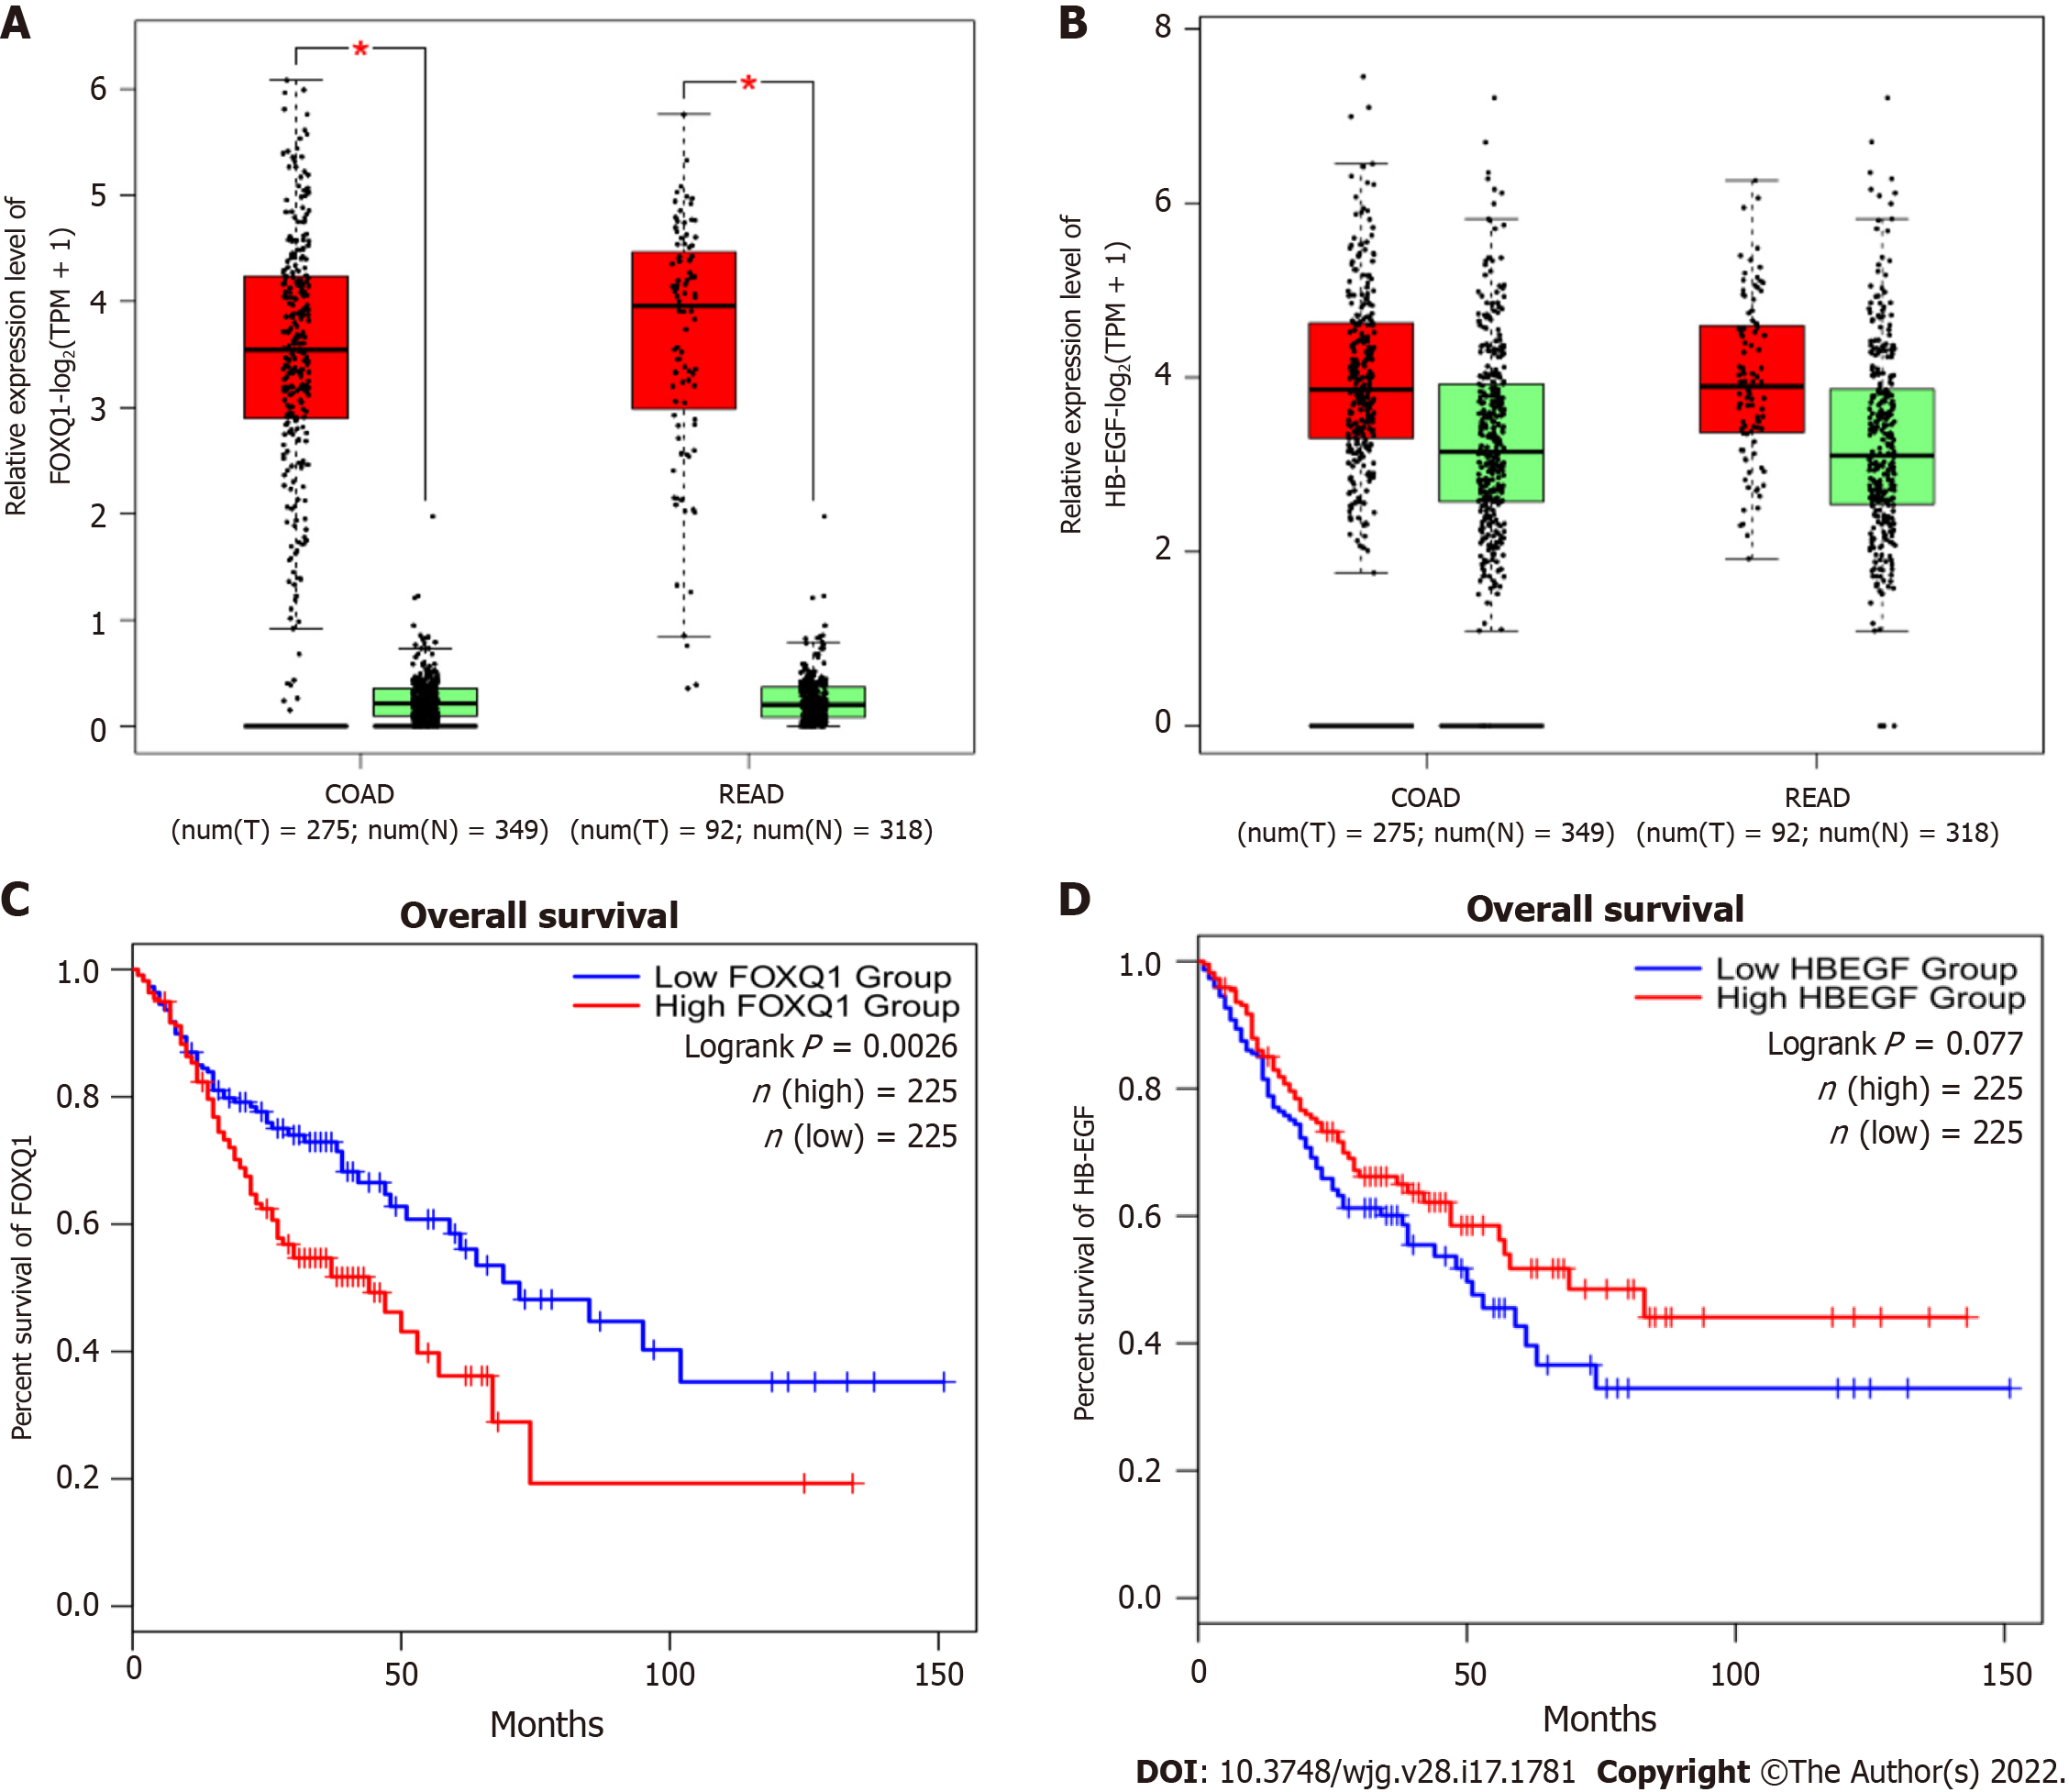
Figure 1 Expression and prognosis of forkhead Box q1 and heparin binding epidermal growth factor in colorectal cancer and normal colorectal tissues.
A and B: Forkhead Box q1 (FOXQ1) (left) and heparin binding epidermal growth factor (HB-EGF) (right) expression was analyzed in human colorectal cancer (CRC) tissues and normal tissues using the Gene Expression Profiling Interactive Analysis online database. aP < 0.05; C and D: Overall survival rate of FOXQ1 (left) and HB-EGF (right) in CRC patients. FOXQ1: Forkhead Box q1; HB-EGF: Heparin binding epidermal growth factor; GEPIA: Gene Expression Profiling Interactive Analysis.
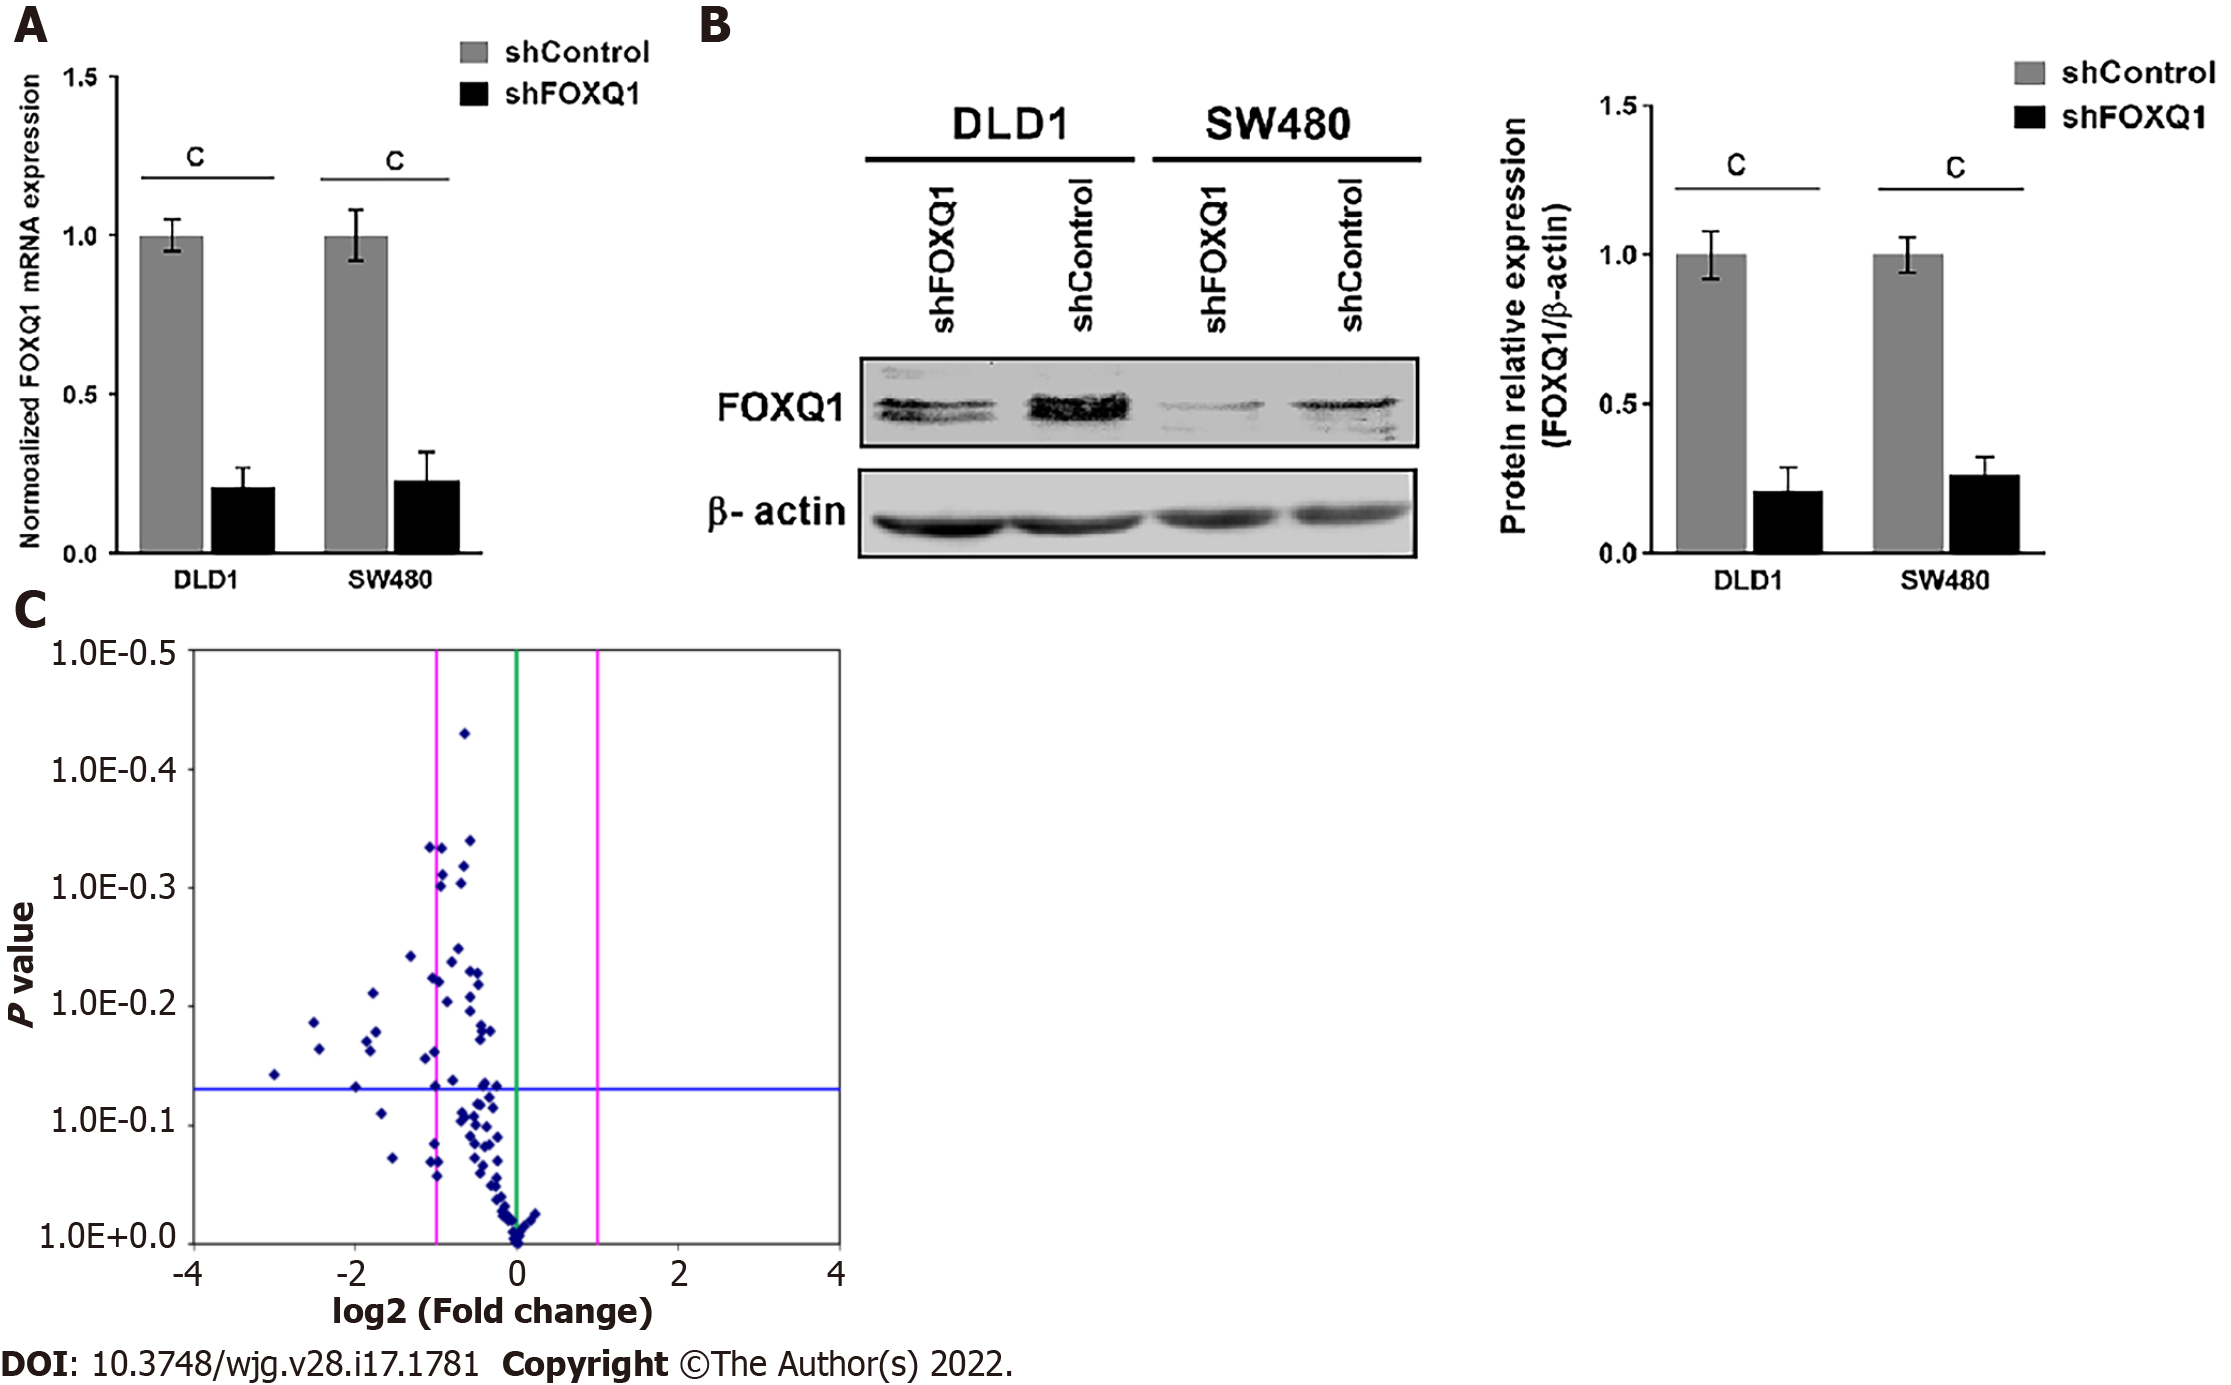
Figure 2 Forkhead Box q1 knockdown induces heparin binding epidermal growth factor suppression and epidermal growth factor/platelet-derived growth factor signaling pathway blockade in vitro according to transcriptional analysis of the generated forkhead Box q1 knockdown cell line.
A: Quantitative real-time polymerase chain reaction was performed to evaluate mRNA expression in the knockdown of forkhead Box q1 in DLD1 cells (DLD1-shFOXQ1) and SW480-shFOXQ1 cells (two-tailed, unpaired Student’s t test). Bars represent the mean ± SE of three independent experiments; B: Western blotting was performed to evaluate FOXQ1 protein expression in DLD1-shFOXQ1 and SW480-shFOXQ1 cells; C: Volcano plot illustrating differentially expressed genes using the epidermal growth factor (EGF)/platelet-derived growth factor (PDGF) array to compare DLD1-shFOXQ1 and DLD1-shControl cells. The vertical blue points in the plot represent 84 genes related to the EGF/PDGF signaling pathways. The vertical green line indicates a fold-change in gene expression of 1. The vertical pink lines indicate the threshold for fold-change (≥ 2.0 and ≤ -2.0). The horizontal blue line indicates the threshold for the P value of the t test. aP < 0.05; bP < 0.01; cP < 0.001. DLD1-shFOXQ1: The knockdown of forkhead Box q1 in DLD1 cells; SW480-shFOXQ1: The knockdown of forkhead Box q1 in SW480 cells.
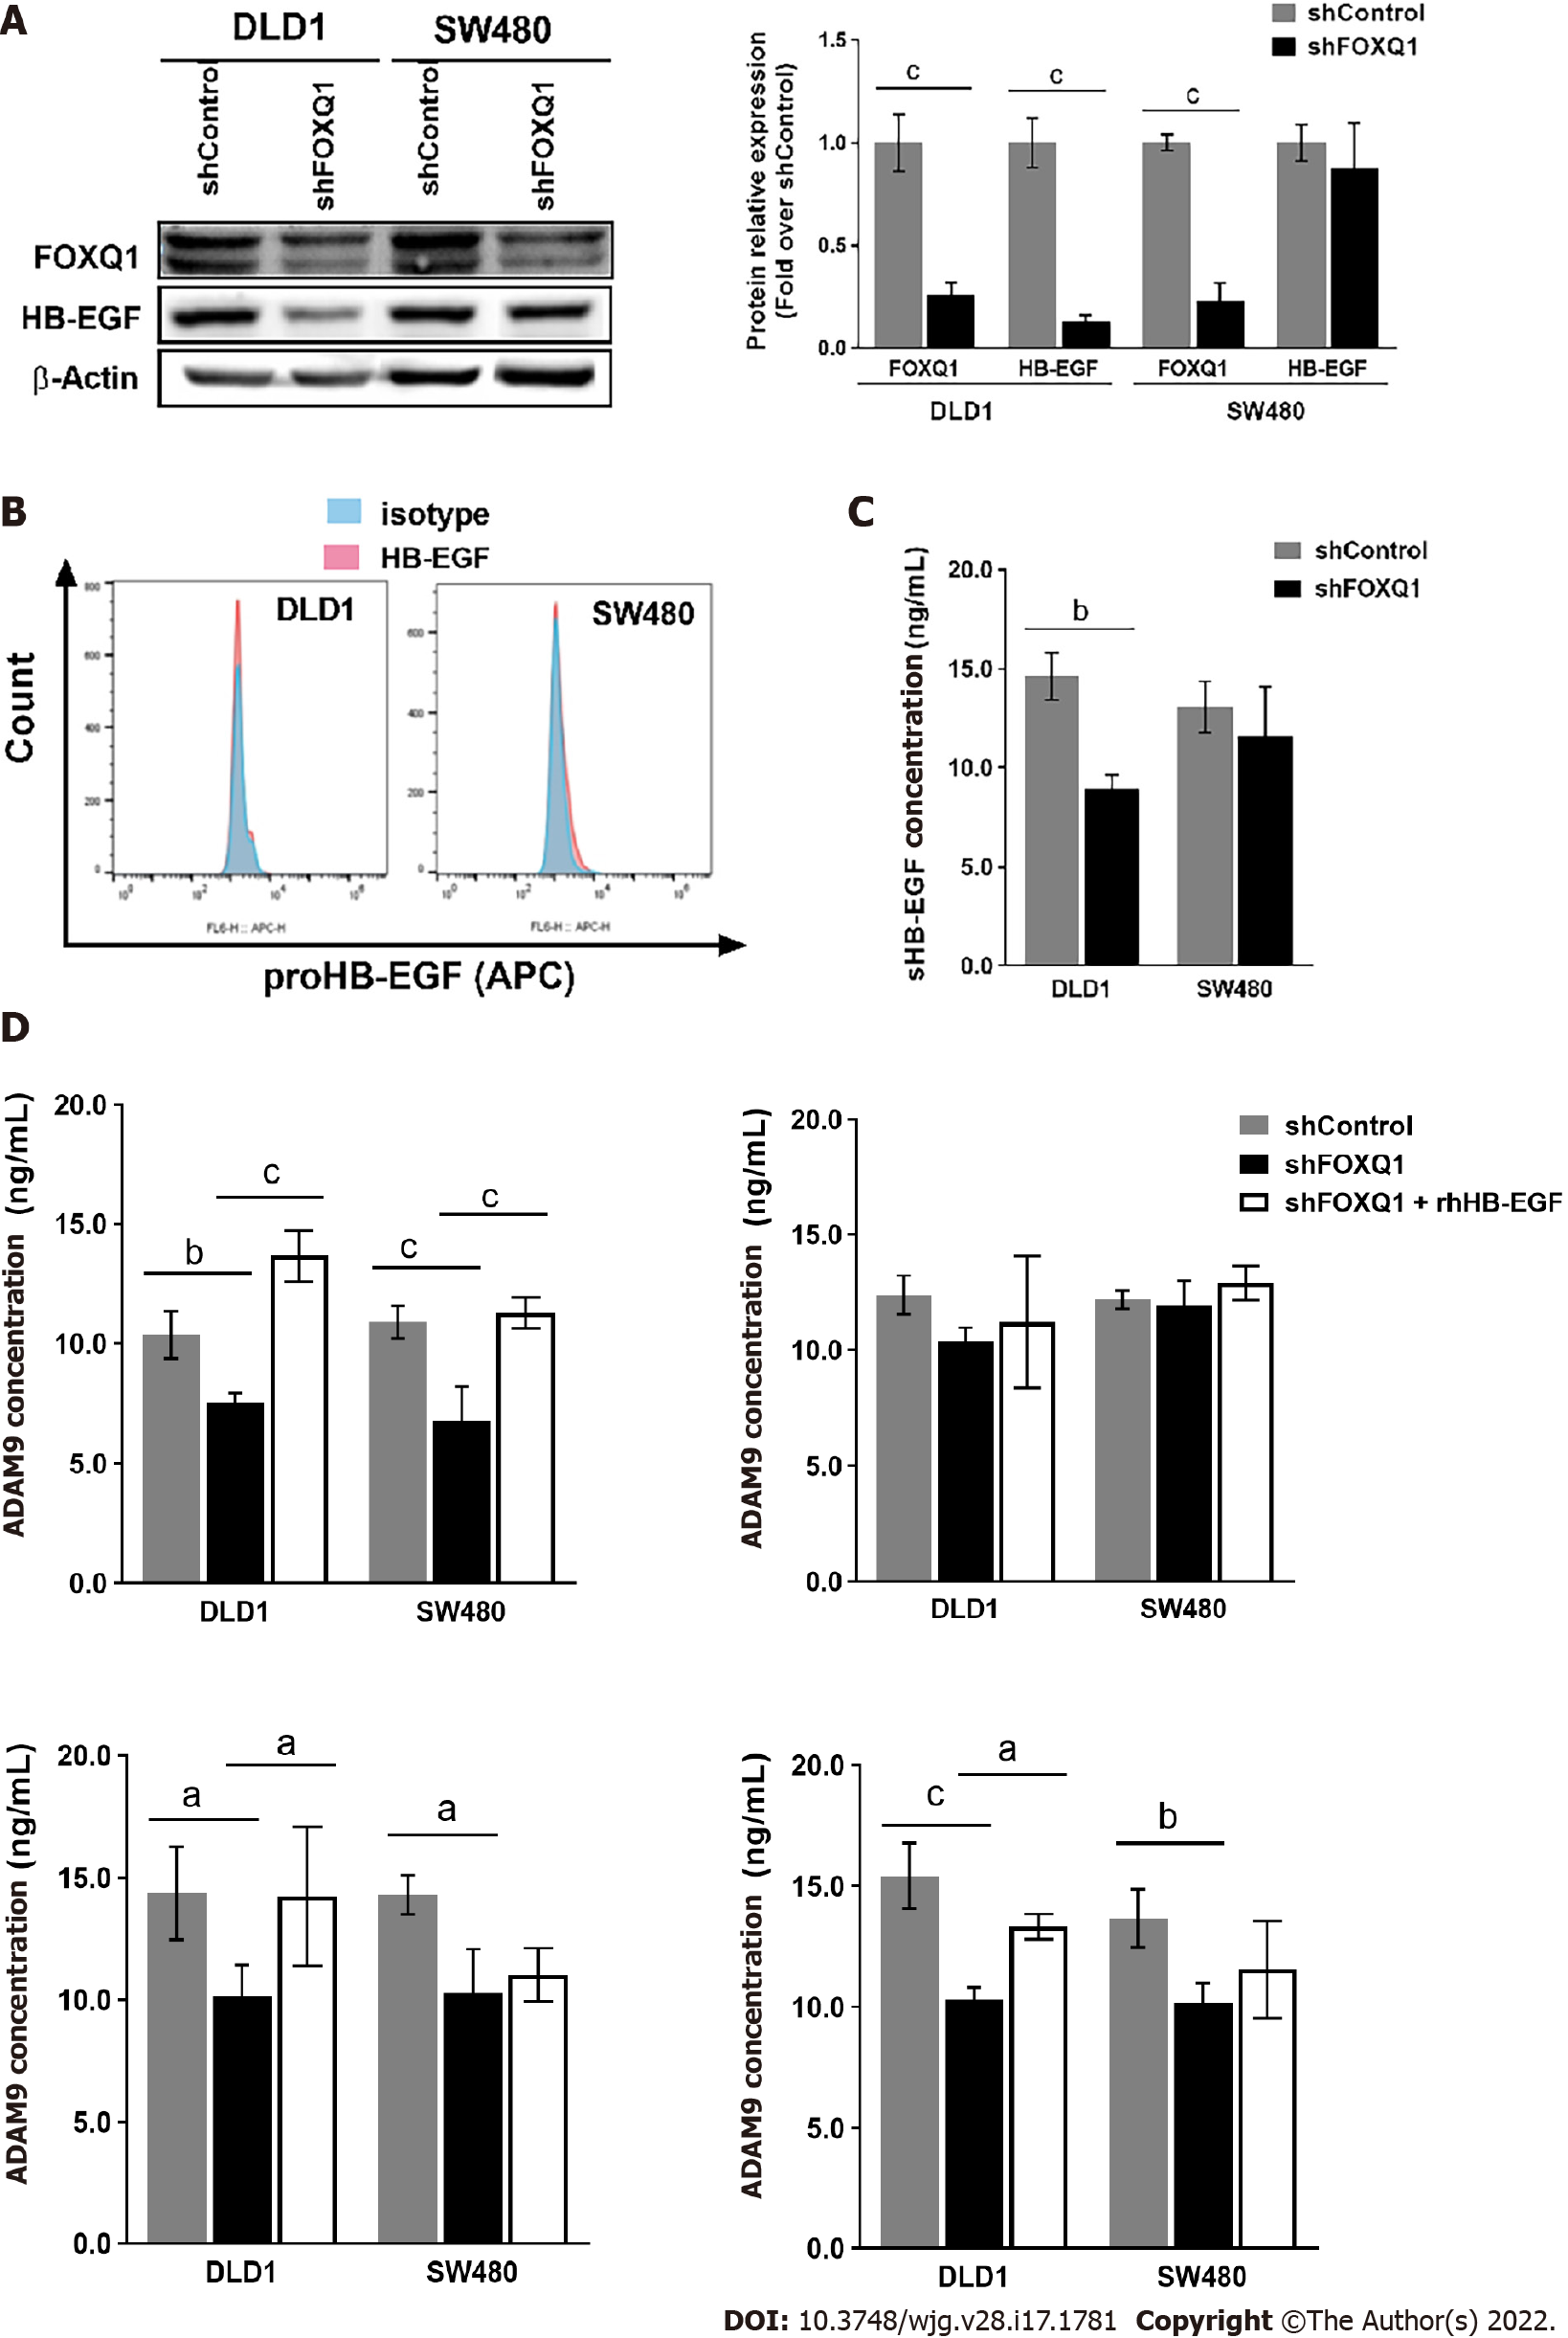
Figure 3 Effect of forkhead Box q1 expression on heparin binding epidermal growth factor expression and extracellular release ability in colorectal cancer cells.
A: Quantitative analysis of western blots was performed to detect the expression of heparin binding epidermal growth factor (HB-EGF) with forkhead Box q1 (FOXQ1) inhibition; B: Flow cytometry was performed to detect the effect of changes in FOXQ1 expression on the expression of proHB-EGF in DLD1 and SW480 cells; C: ELISA verified the effect of FOXQ1 knockdown on sHB-EGF expression in DLD1 and SW480 cells; D: ELISA confirmed the effect of FOXQ1 on the expression of proHB-EGF extracellular release proteins (ADAM9, ADAM10, ADAM12 and MMP-7) in DLD1 and SW480 cells. aP < 0.05; bP < 0.01; cP < 0.001. FOXQ1: Forkhead Box q1; HB-EGF: Heparin binding epidermal growth factor; ProHB-EGF: Membrane-bound HB-EGF; SHB-EGF: Souble HB-EGF; ADAM9: A disintegrin and a metalloprotease 9; ADAM10: A disintegrin and a metalloprotease 10; ADAM12: A disintegrin and a metalloprotease 12; MMP7: Matrix metallopeptidase 7.
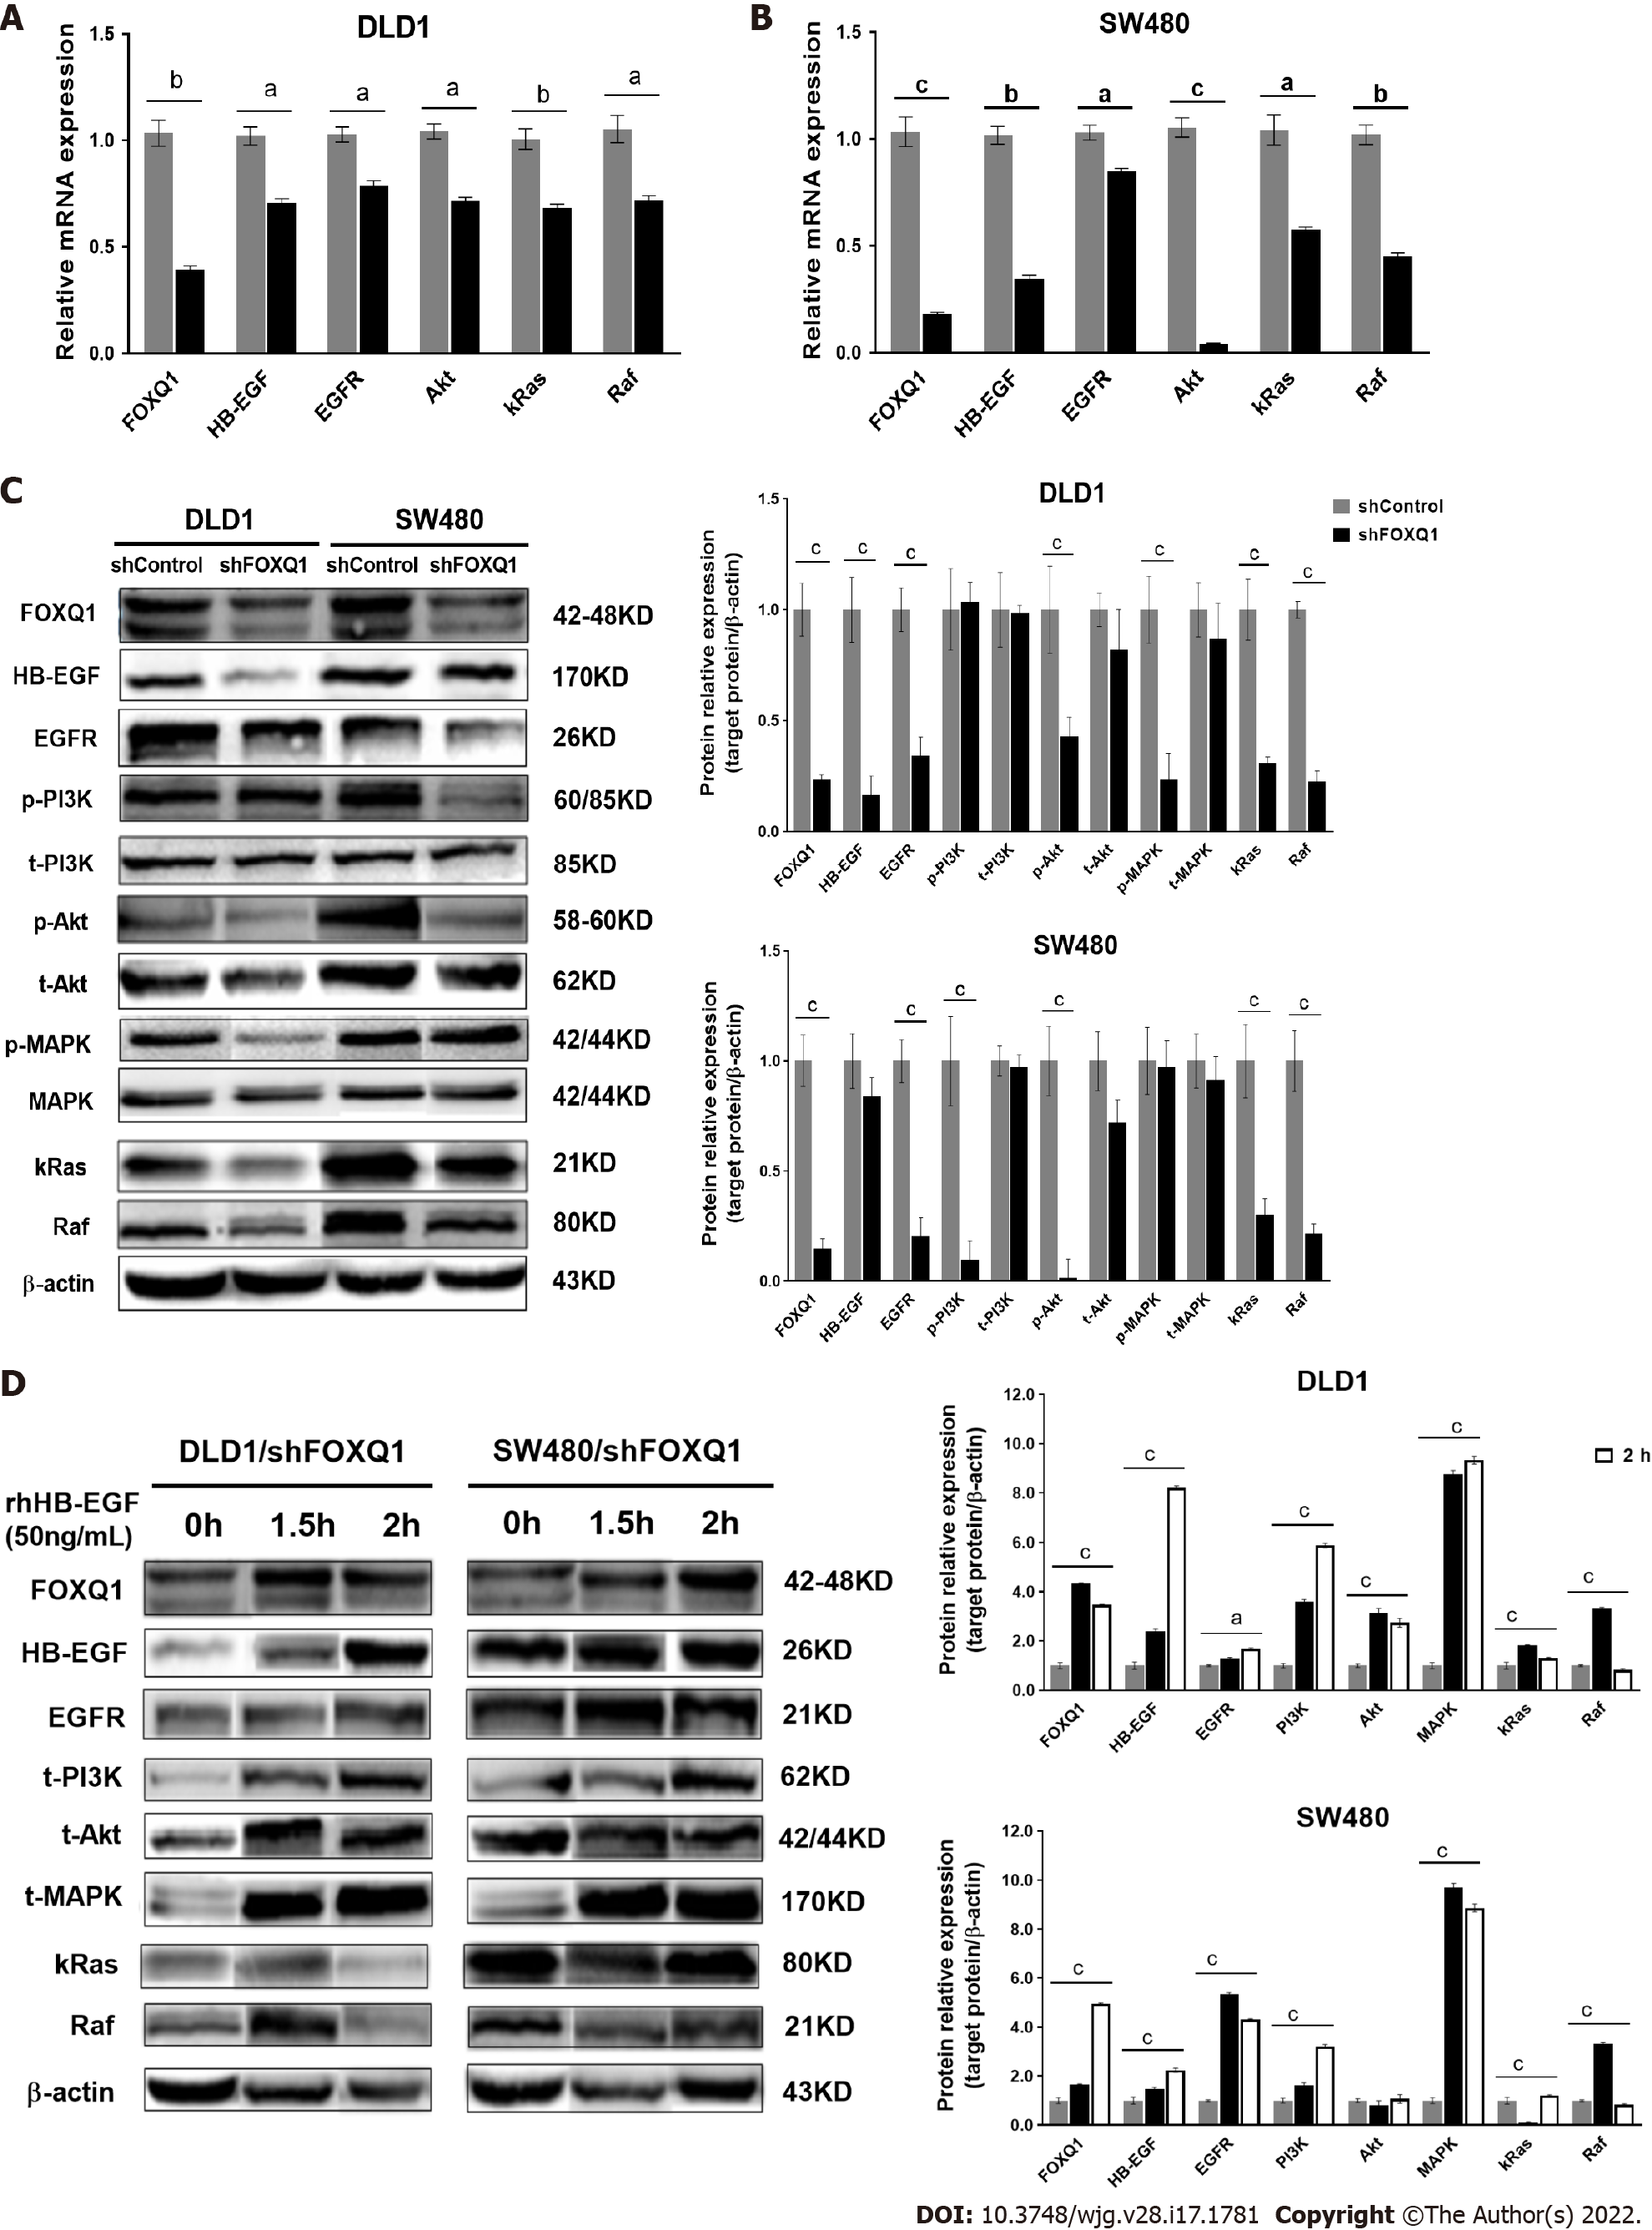
Figure 4 Forkhead Box q1 regulates epidermal growth factor receptor and downstream signaling pathways by regulating heparin binding epidermal growth factor.
A: Quantitative real-time polymerase chain reaction (qRT–PCR) was performed to analyze the levels of forkhead Box q1 (FOXQ1), heparin binding epidermal growth factor (HB-EGF), epidermal growth factor receptor (EGFR), Akt, kRas and Raf in DLD1-shFOXQ1 and DLD1-shControl cells; B: qRT–PCR was performed to analyze the levels of FOXQ1, HB-EGF, EGFR, AKT, RAF and KRAS in SW480-shFOXQ1 and SW480-shControl cells; C: Western blot analyses were performed to analyze the protein levels of FOXQ1, HB-EGF, EGFR, RAF and KRAS as well as the phosphorylation levels of PI3K, Akt, and MAPK in DLD1-shFOXQ1, SW480-shFOXQ1, DLD1-shControl and SW480-shControl cells. β-actin was used as the loading control; D: Exogenous rhHB-EGF (50 ng/mL) was added to the culture media of DLD1-shFOXQ1 and SW480-shFOXQ1 cells for 1.5 h and 2 h, respectively. Western blotting was performed to detect the expression of proteins in the HB-EGF/EGFR signaling pathway. aP < 0.05; bP < 0.01; cP < 0.001 indicate significant differences compared to the control group (two-tailed, unpaired Student’s t test). Bars represent the mean ± S.E. of three independent experiments. rhHB-EGF: Recombinant human HB-EGF; FOXQ1: Forkhead Box q1; HB-EGF: Heparin binding epidermal growth factor.
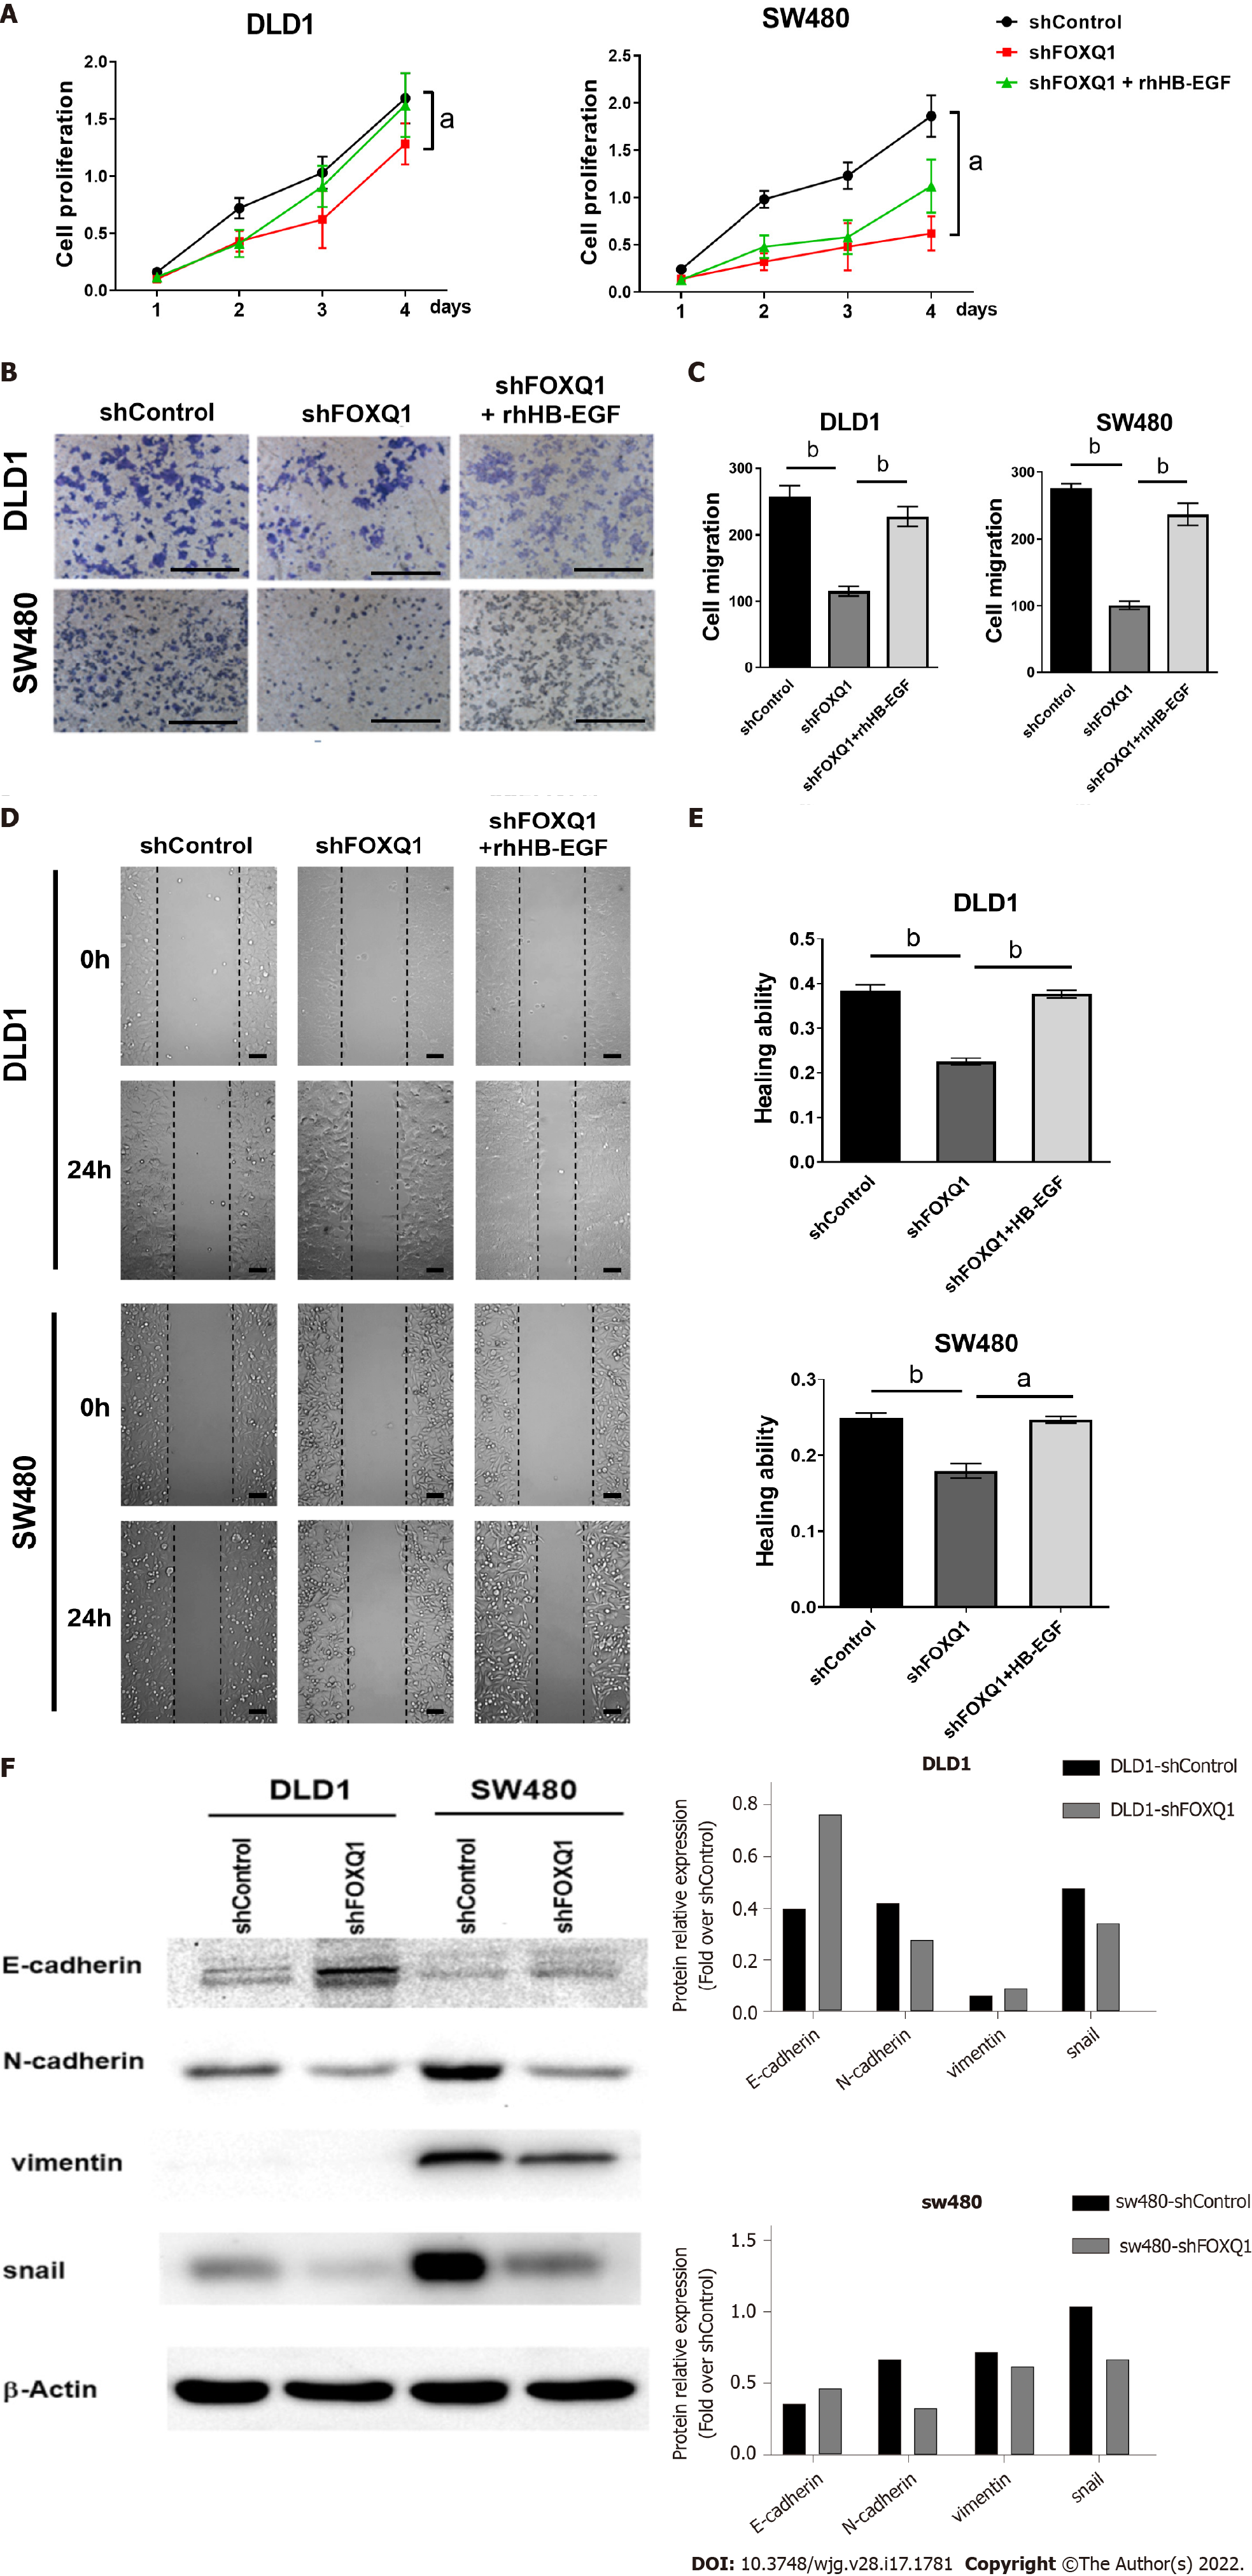
Figure 5 Recombinant human heparin binding epidermal growth factor reverses the forkhead Box q1-induced suppression of colorectal cancer cell proliferation and migration in vitro.
A: A cell counting Kit-8 (CCK-8) assay was performed to detect the effects of recombinant human heparin binding epidermal growth factor (rhHB-EGF) on the proliferation of forkhead Box q1 (FOXQ1)-deficient DLD1 and SW480 cells; B: The Transwell migration assay was performed to evaluate the migration ability after knocking out FOXQ1 and after adding rhHB-EGF; C: A statistical analysis of the results of the Transwell migration assay was performed. bP < 0.01; D: After 0 h and 24 h, the scratch experiment evaluated the migration ability of DLD1 and SW480 cells with downregulated FOXQ1 and rhHB-EGF; E: Statistical analysis of the above scratch experiment results. aP < 0.05; bP < 0.01; cP < 0.001; F: Quantitative analysis of Western blot to detect the expression of E-cadherin, N-cadherin, vimentin and Snail protein levels in DLD-shFOXQ1 and SW480-shFOXQ1 cells compared to DLD1-shControl and SW480-shControl cells. β-actin was used as the loading control. CCK-8: Cell Counting Kit-8.
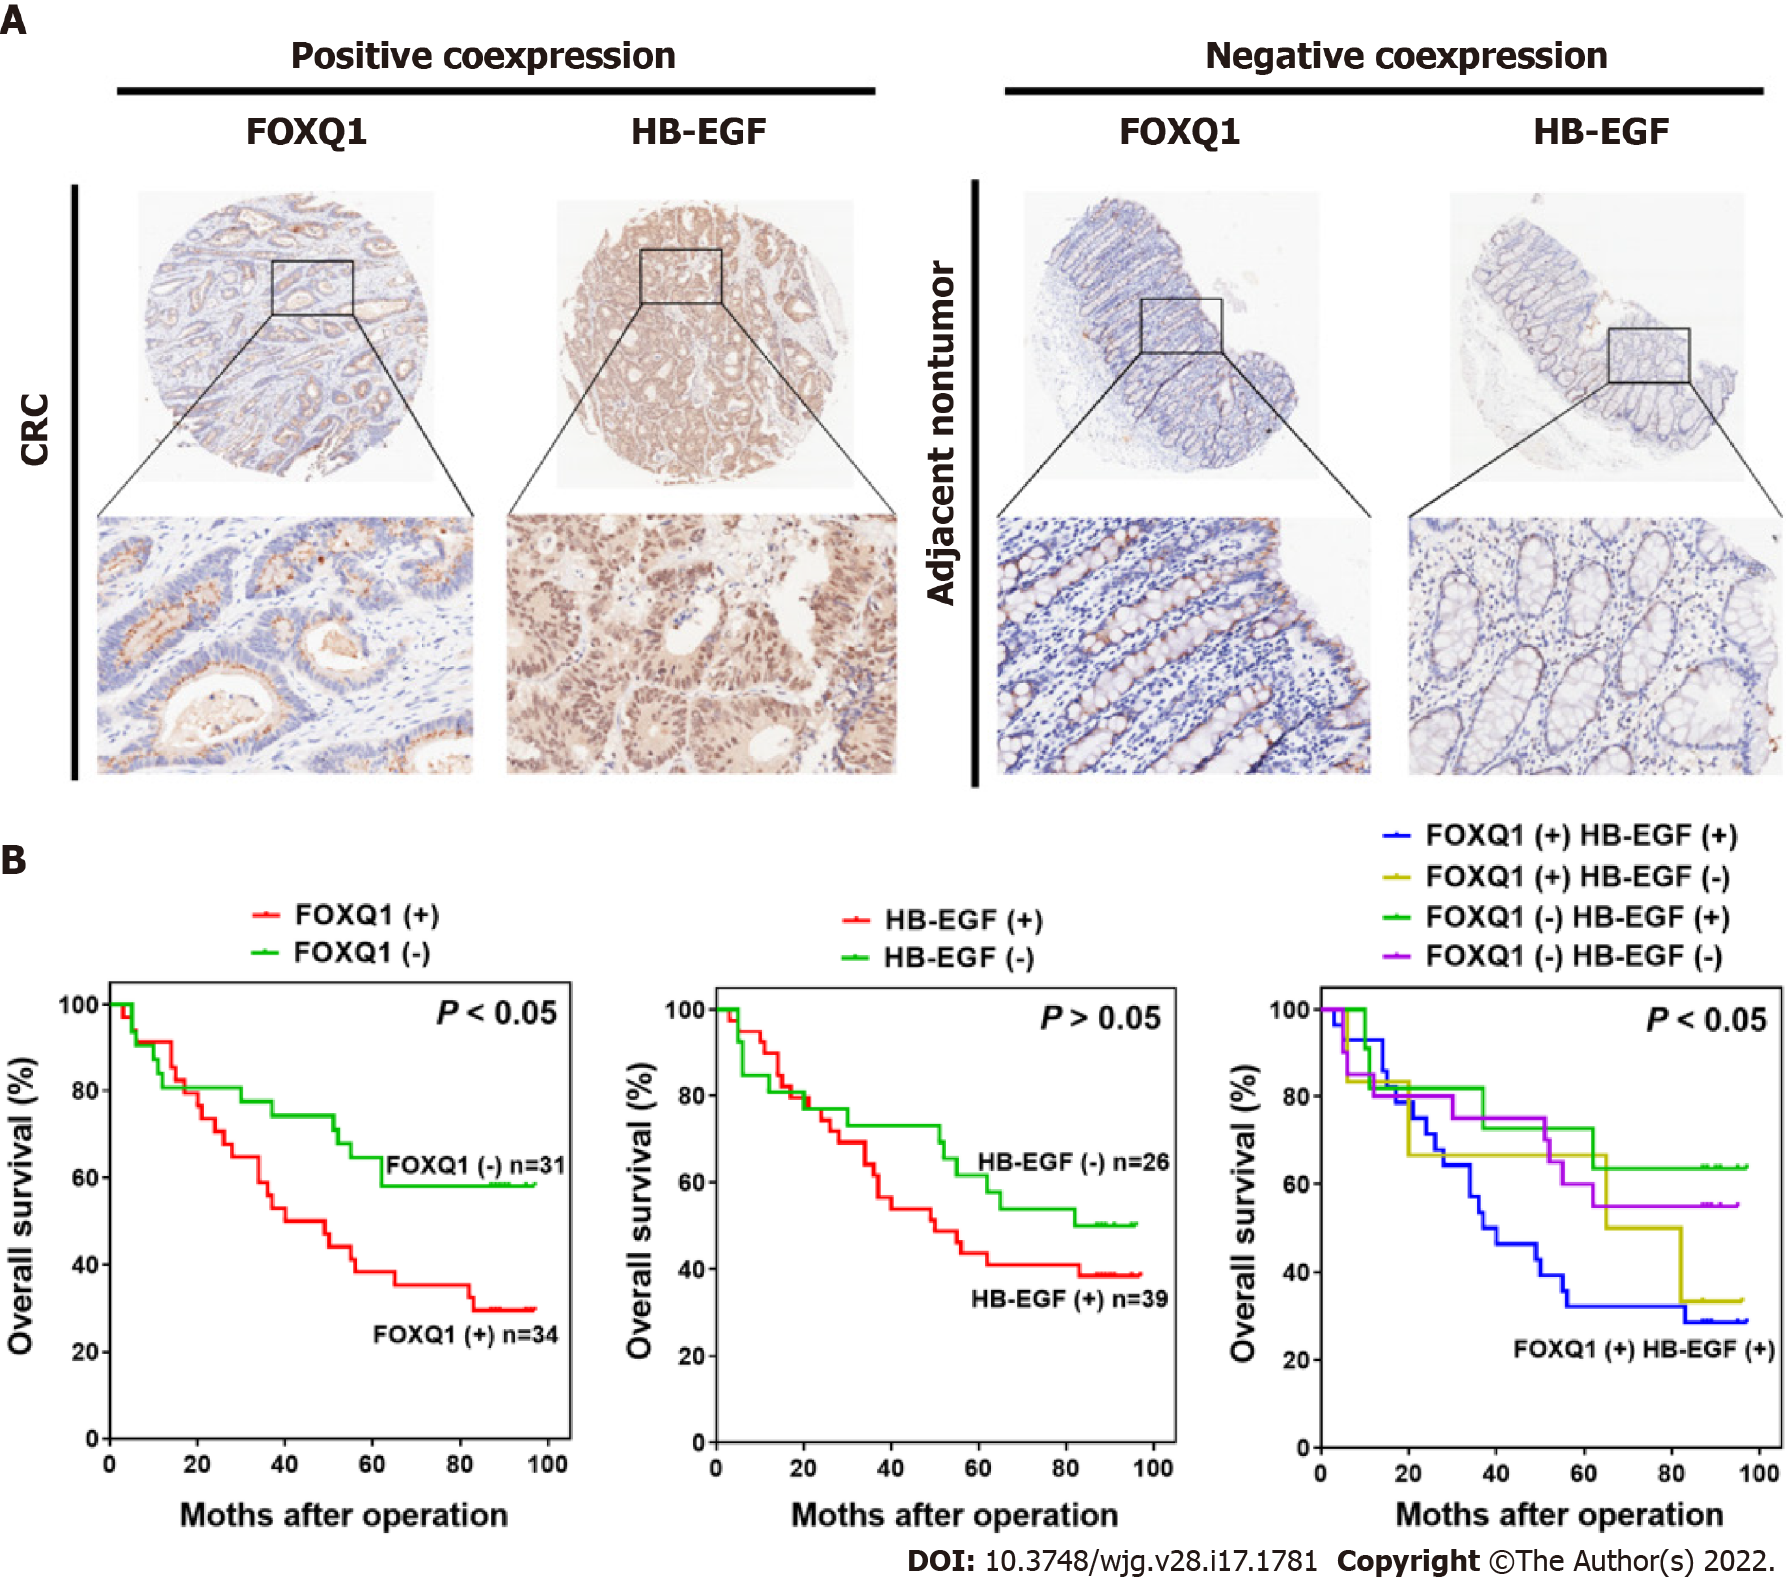
Figure 6 Prognostic value of the combination of forkhead Box q1 and heparin binding epidermal growth factor.
A: Representative immunohistochemical images of forkhead Box q1 (FOXQ1) and heparin binding epidermal growth factor (HB-EGF) positive coexpression and negative coexpression in human colorectal cancer tissues and adjacent nontumorous tissues. Scale bars represent 200 μm; B: Kaplan-Meier survival analysis was used to evaluate the overall survival rate in the following patients: FOXQ1-positive and FOXQ1-negative patients; HB-EGF-positive and HB-EGF-negative patients; and FOXQ1-positive and FOXQ1-negative coexpressing HB-EGF-positive and HBEGF-negative patients. aP < 0.05; bP < 0.01; cP < 0.001 indicate a significant difference between the indicated groups (log-rank test). FOXQ1: Forkhead Box q1; HB-EGF: Heparin binding epidermal growth factor.
- Citation: Zhang JJ, Cao CX, Wan LL, Zhang W, Liu ZJ, Wang JL, Guo Q, Tang H. Forkhead Box q1 promotes invasion and metastasis in colorectal cancer by activating the epidermal growth factor receptor pathway. World J Gastroenterol 2022; 28(17): 1781-1797
- URL: https://www.wjgnet.com/1007-9327/full/v28/i17/1781.htm
- DOI: https://dx.doi.org/10.3748/wjg.v28.i17.1781


