Copyright
©The Author(s) 2022.
World J Gastroenterol. Apr 28, 2022; 28(16): 1625-1640
Published online Apr 28, 2022. doi: 10.3748/wjg.v28.i16.1625
Published online Apr 28, 2022. doi: 10.3748/wjg.v28.i16.1625
Figure 1 Ultrasound and computed tomography images of a 19-year-old man with severe drug-induced hepatitis.
A: High frequency ultrasound image showing increased and heterogenous echo intensity of the liver parenchyma; B: Pre-contrast computed tomography image showing map-like hypodense area in the liver parenchyma and moderate ascites; C: The hypodense areas on (B) became hyperattenuating on portal venous phase image, showing “reverse enhancement”.
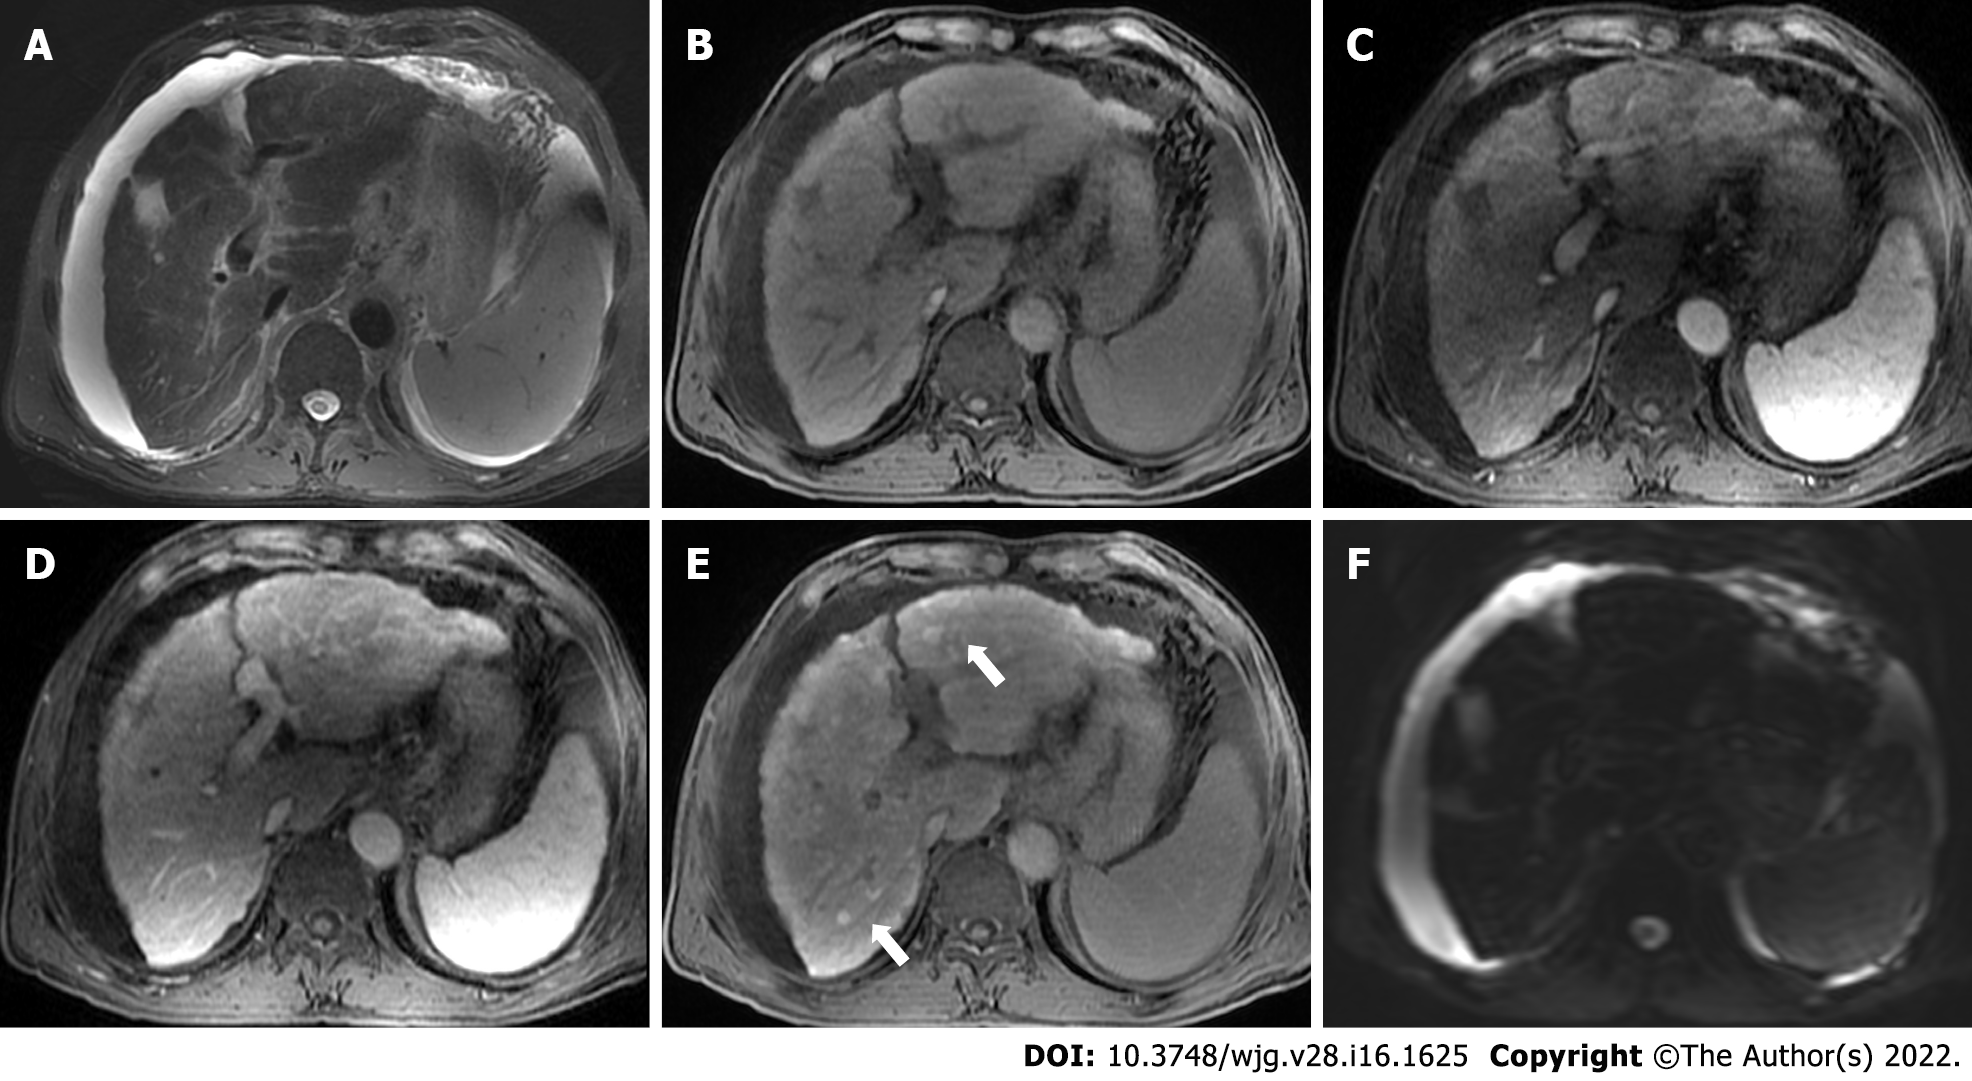
Figure 2 Gadoxetate-enhanced magnetic resonance images of a 70-year-old man with chronic hepatitis B.
T2-weighted image (A) shows signal loss of the liver parenchyma, suggesting iron overload. T1-weighted pre-contrast (B), arterial phase (C), and portal venous phase (D) images show nodular contour and patchy enhancement of the liver parenchyma. Hepatobiliary phase image demonstrates diffuse hyperintense nodules (E, black arrows) without diffusion restriction on diffusion-weighted imaging (F), indicating regenerative nodules. Moderate ascites was also noted.
Figure 3 Magnetic resonance images of a 63-year-old man with hilar cholangiocarcinoma.
Axial (A) and coronal (B) portal venous phase images demonstrate thickened hilar bile duct wall (white arrows). The extrahepatic bile duct is absent on magnetic resonance cholangiopancreatography image (C, white arrowhead), and the intrahepatic bile ducts are dilated and distorted (“vine-sign”).
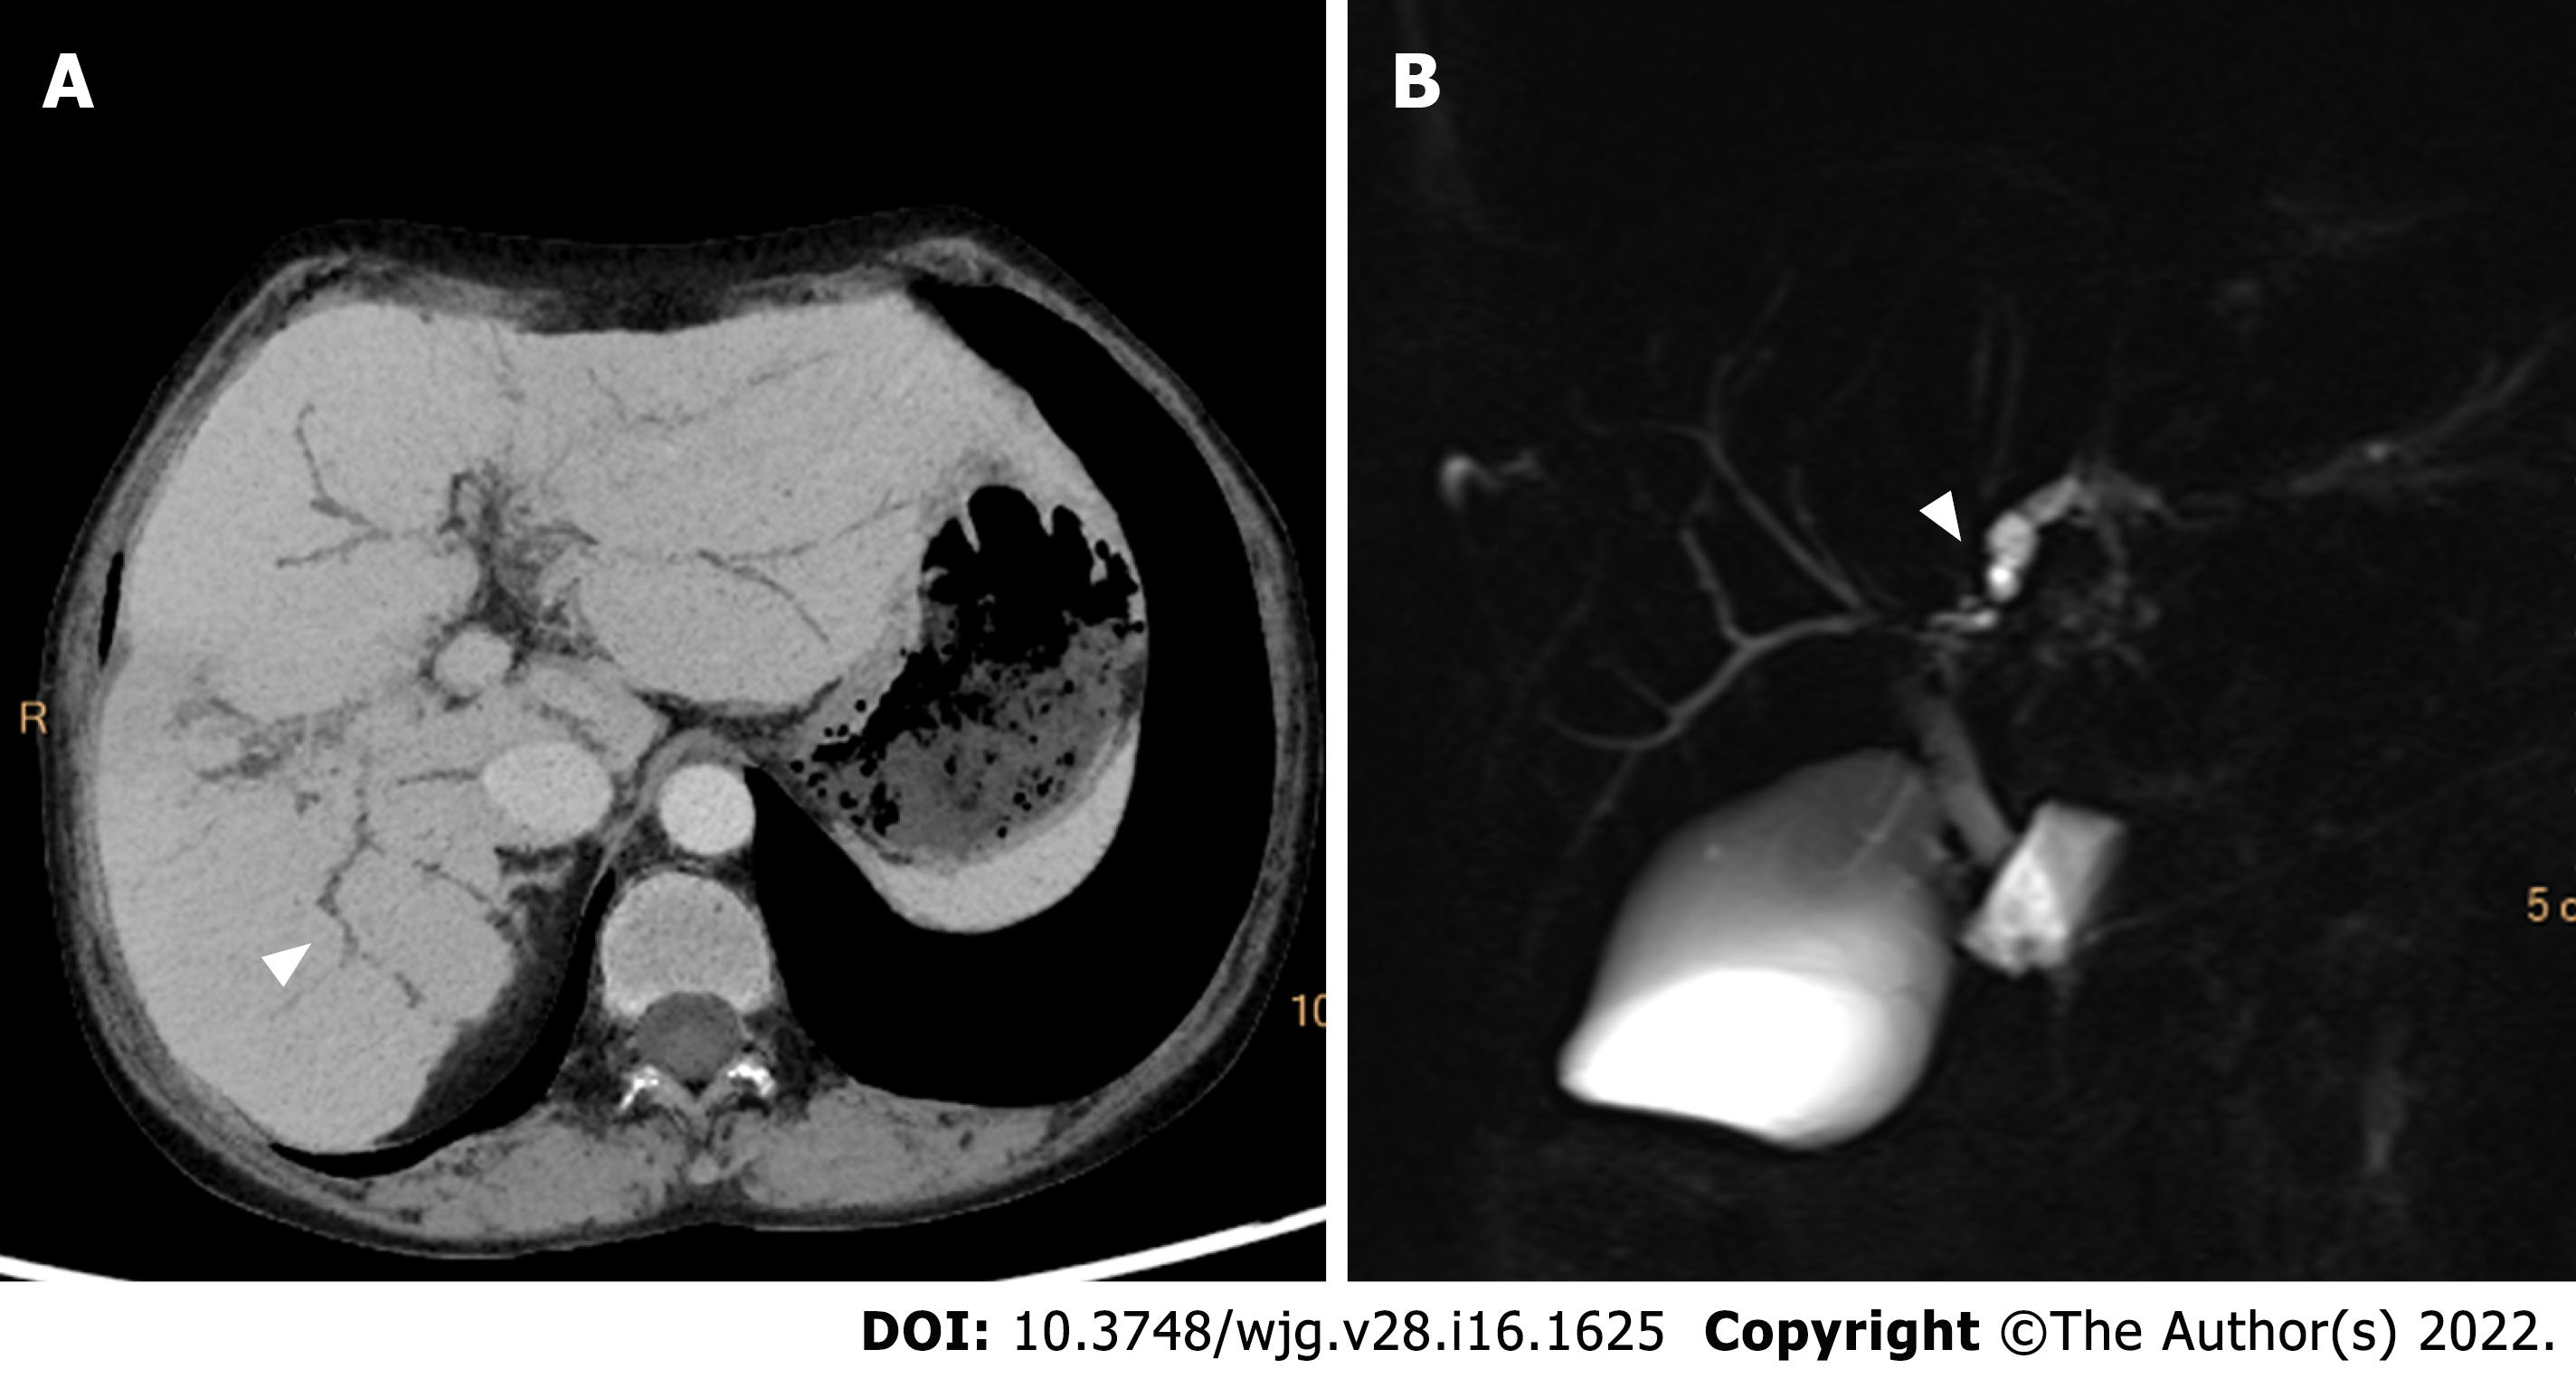
Figure 4 Computed tomography and magnetic resonance cholangiopancreatography images of a-42-year-old woman with primary sclerosing cholangitis.
Minimum density projection computed tomography image of portal venous phase (A) and magnetic resonance cholangiopancreatography image (B) show a “beading appearance” of the intrahepatic bile ducts (white arrowheads).
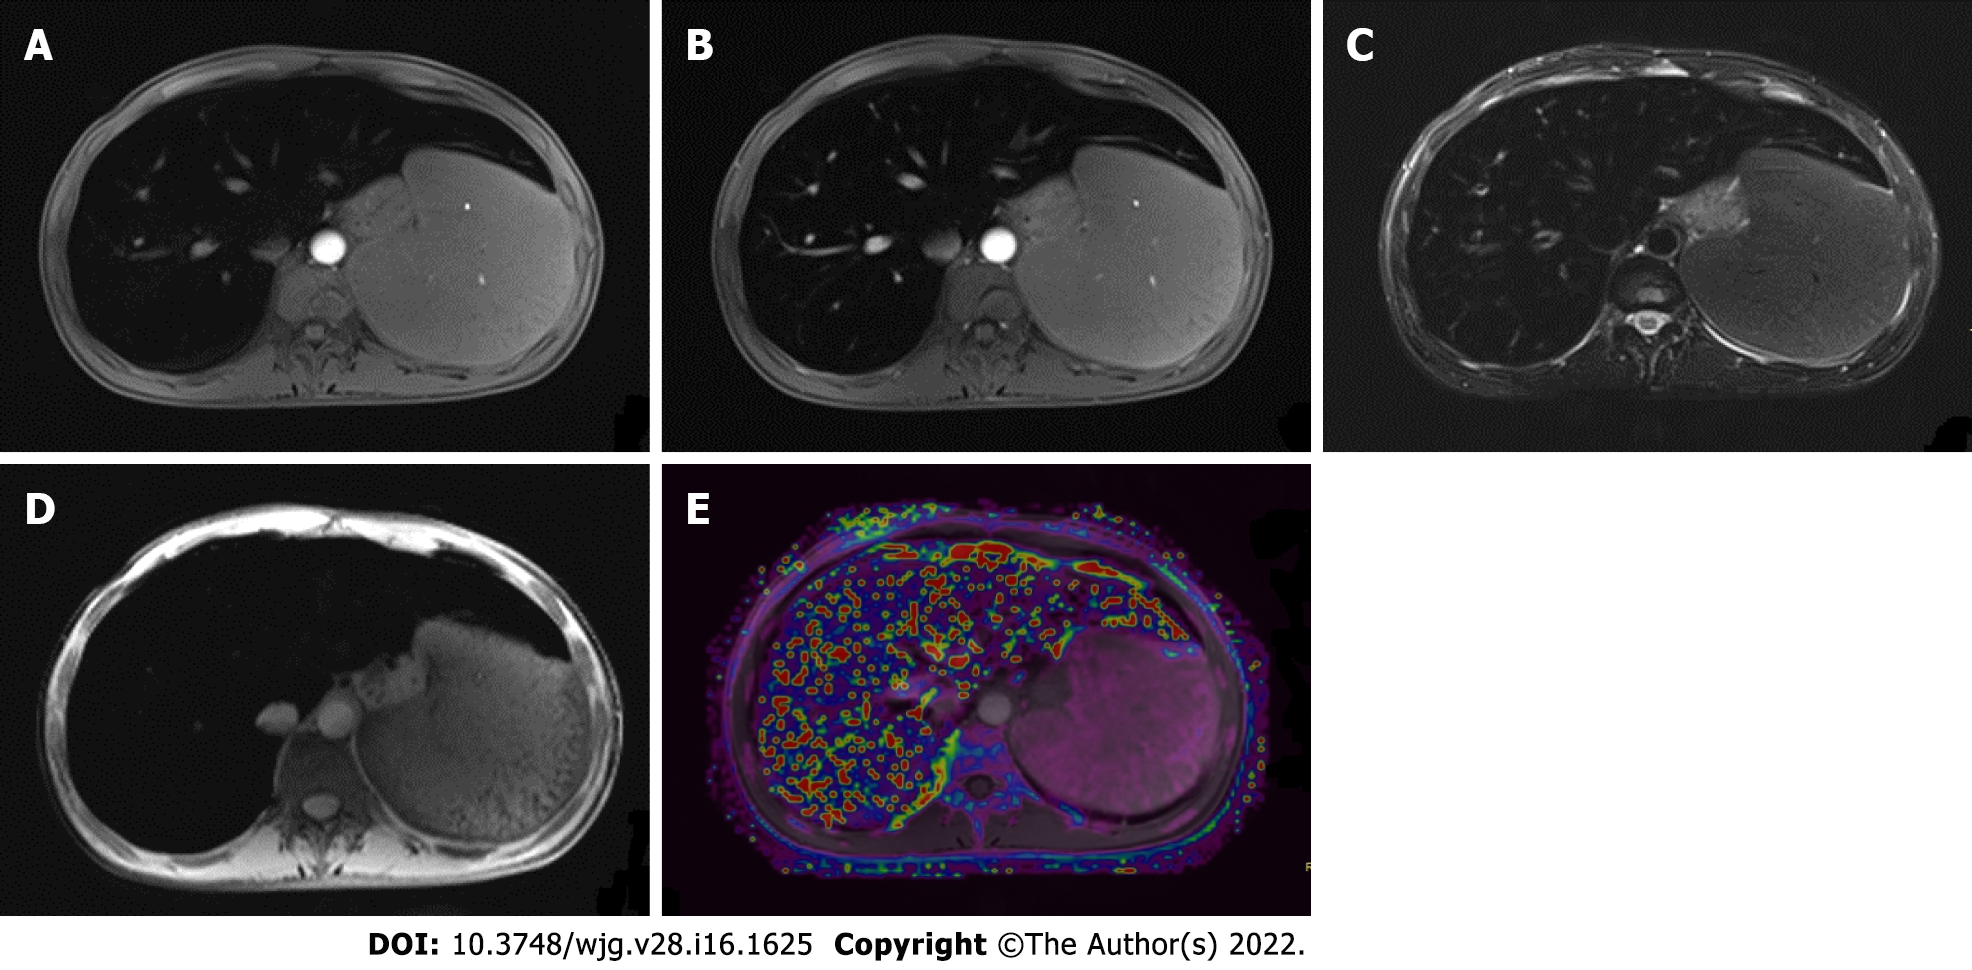
Figure 5 Magnetic resonance images of a 26-year-old man with hemochromatosis.
Pre-contrast T1-weighted image (A), portal venous phase T1-weighted image (B), T2-weighted image (C), and SWI image (D) showed signal intensity in liver parenchyma, while R2* mapping (E) shows increased signal intensity in the liver, demonstrating severe iron overload. R2: Relaxation rate.
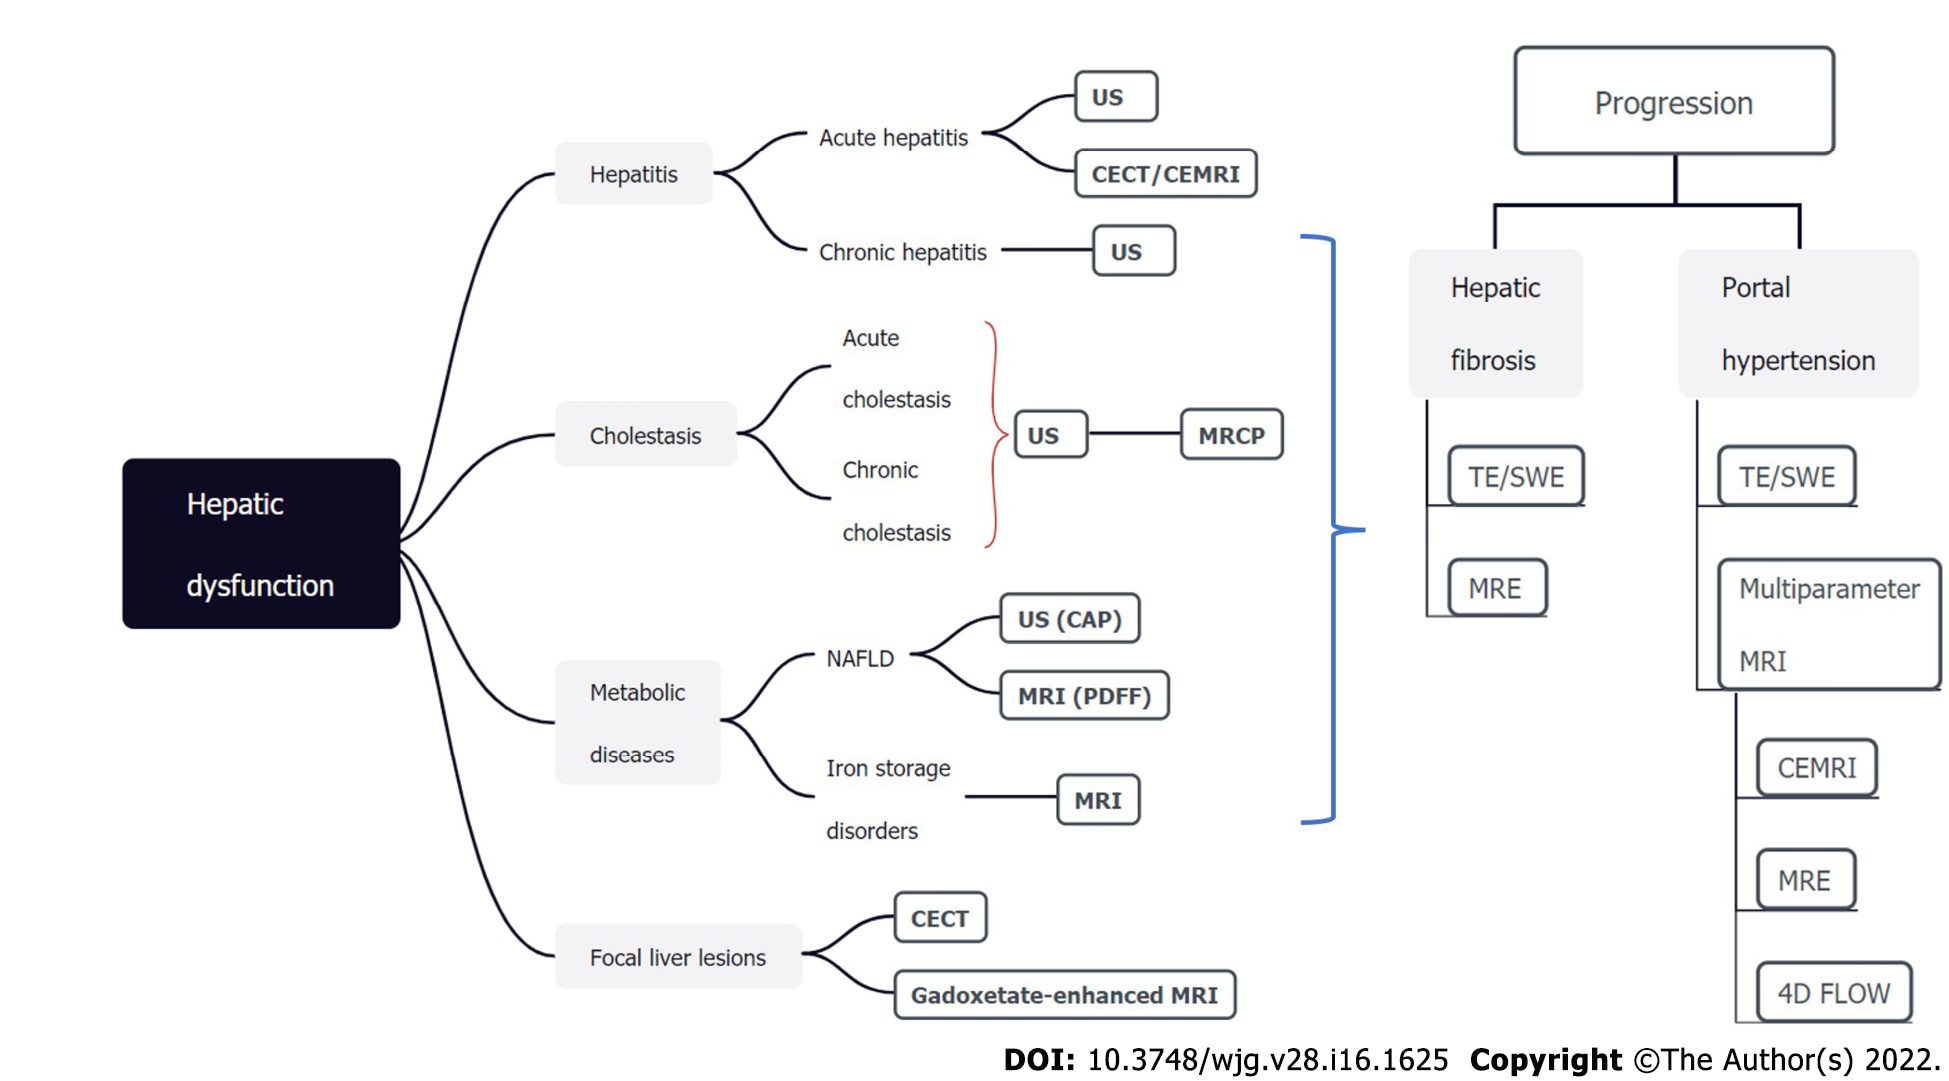
Figure 6 Noninvasive imaging modalities for assessing hepatic dysfunction.
The bold modalities are recommended and should be the first-line methods. US: Ultrasound; CT: Computed tomography; MRI: Magnetic resonance imaging; TE: Transient elastography; SWE: Shear wave elastography; MRE: MRI elastography; MRCP: Magnetic resonance cholangiopancreatography; NAFLD: Nonalcoholic fatty liver disease; PDFF: Proton density fat-fraction; CAP: Controlled attenuation parameter; CECT: Contrast-enhanced CT; CEMRI: Contrast-enhanced MRI.
- Citation: Duan T, Jiang HY, Ling WW, Song B. Noninvasive imaging of hepatic dysfunction: A state-of-the-art review. World J Gastroenterol 2022; 28(16): 1625-1640
- URL: https://www.wjgnet.com/1007-9327/full/v28/i16/1625.htm
- DOI: https://dx.doi.org/10.3748/wjg.v28.i16.1625


