Copyright
©The Author(s) 2022.
World J Gastroenterol. Apr 14, 2022; 28(14): 1479-1493
Published online Apr 14, 2022. doi: 10.3748/wjg.v28.i14.1479
Published online Apr 14, 2022. doi: 10.3748/wjg.v28.i14.1479
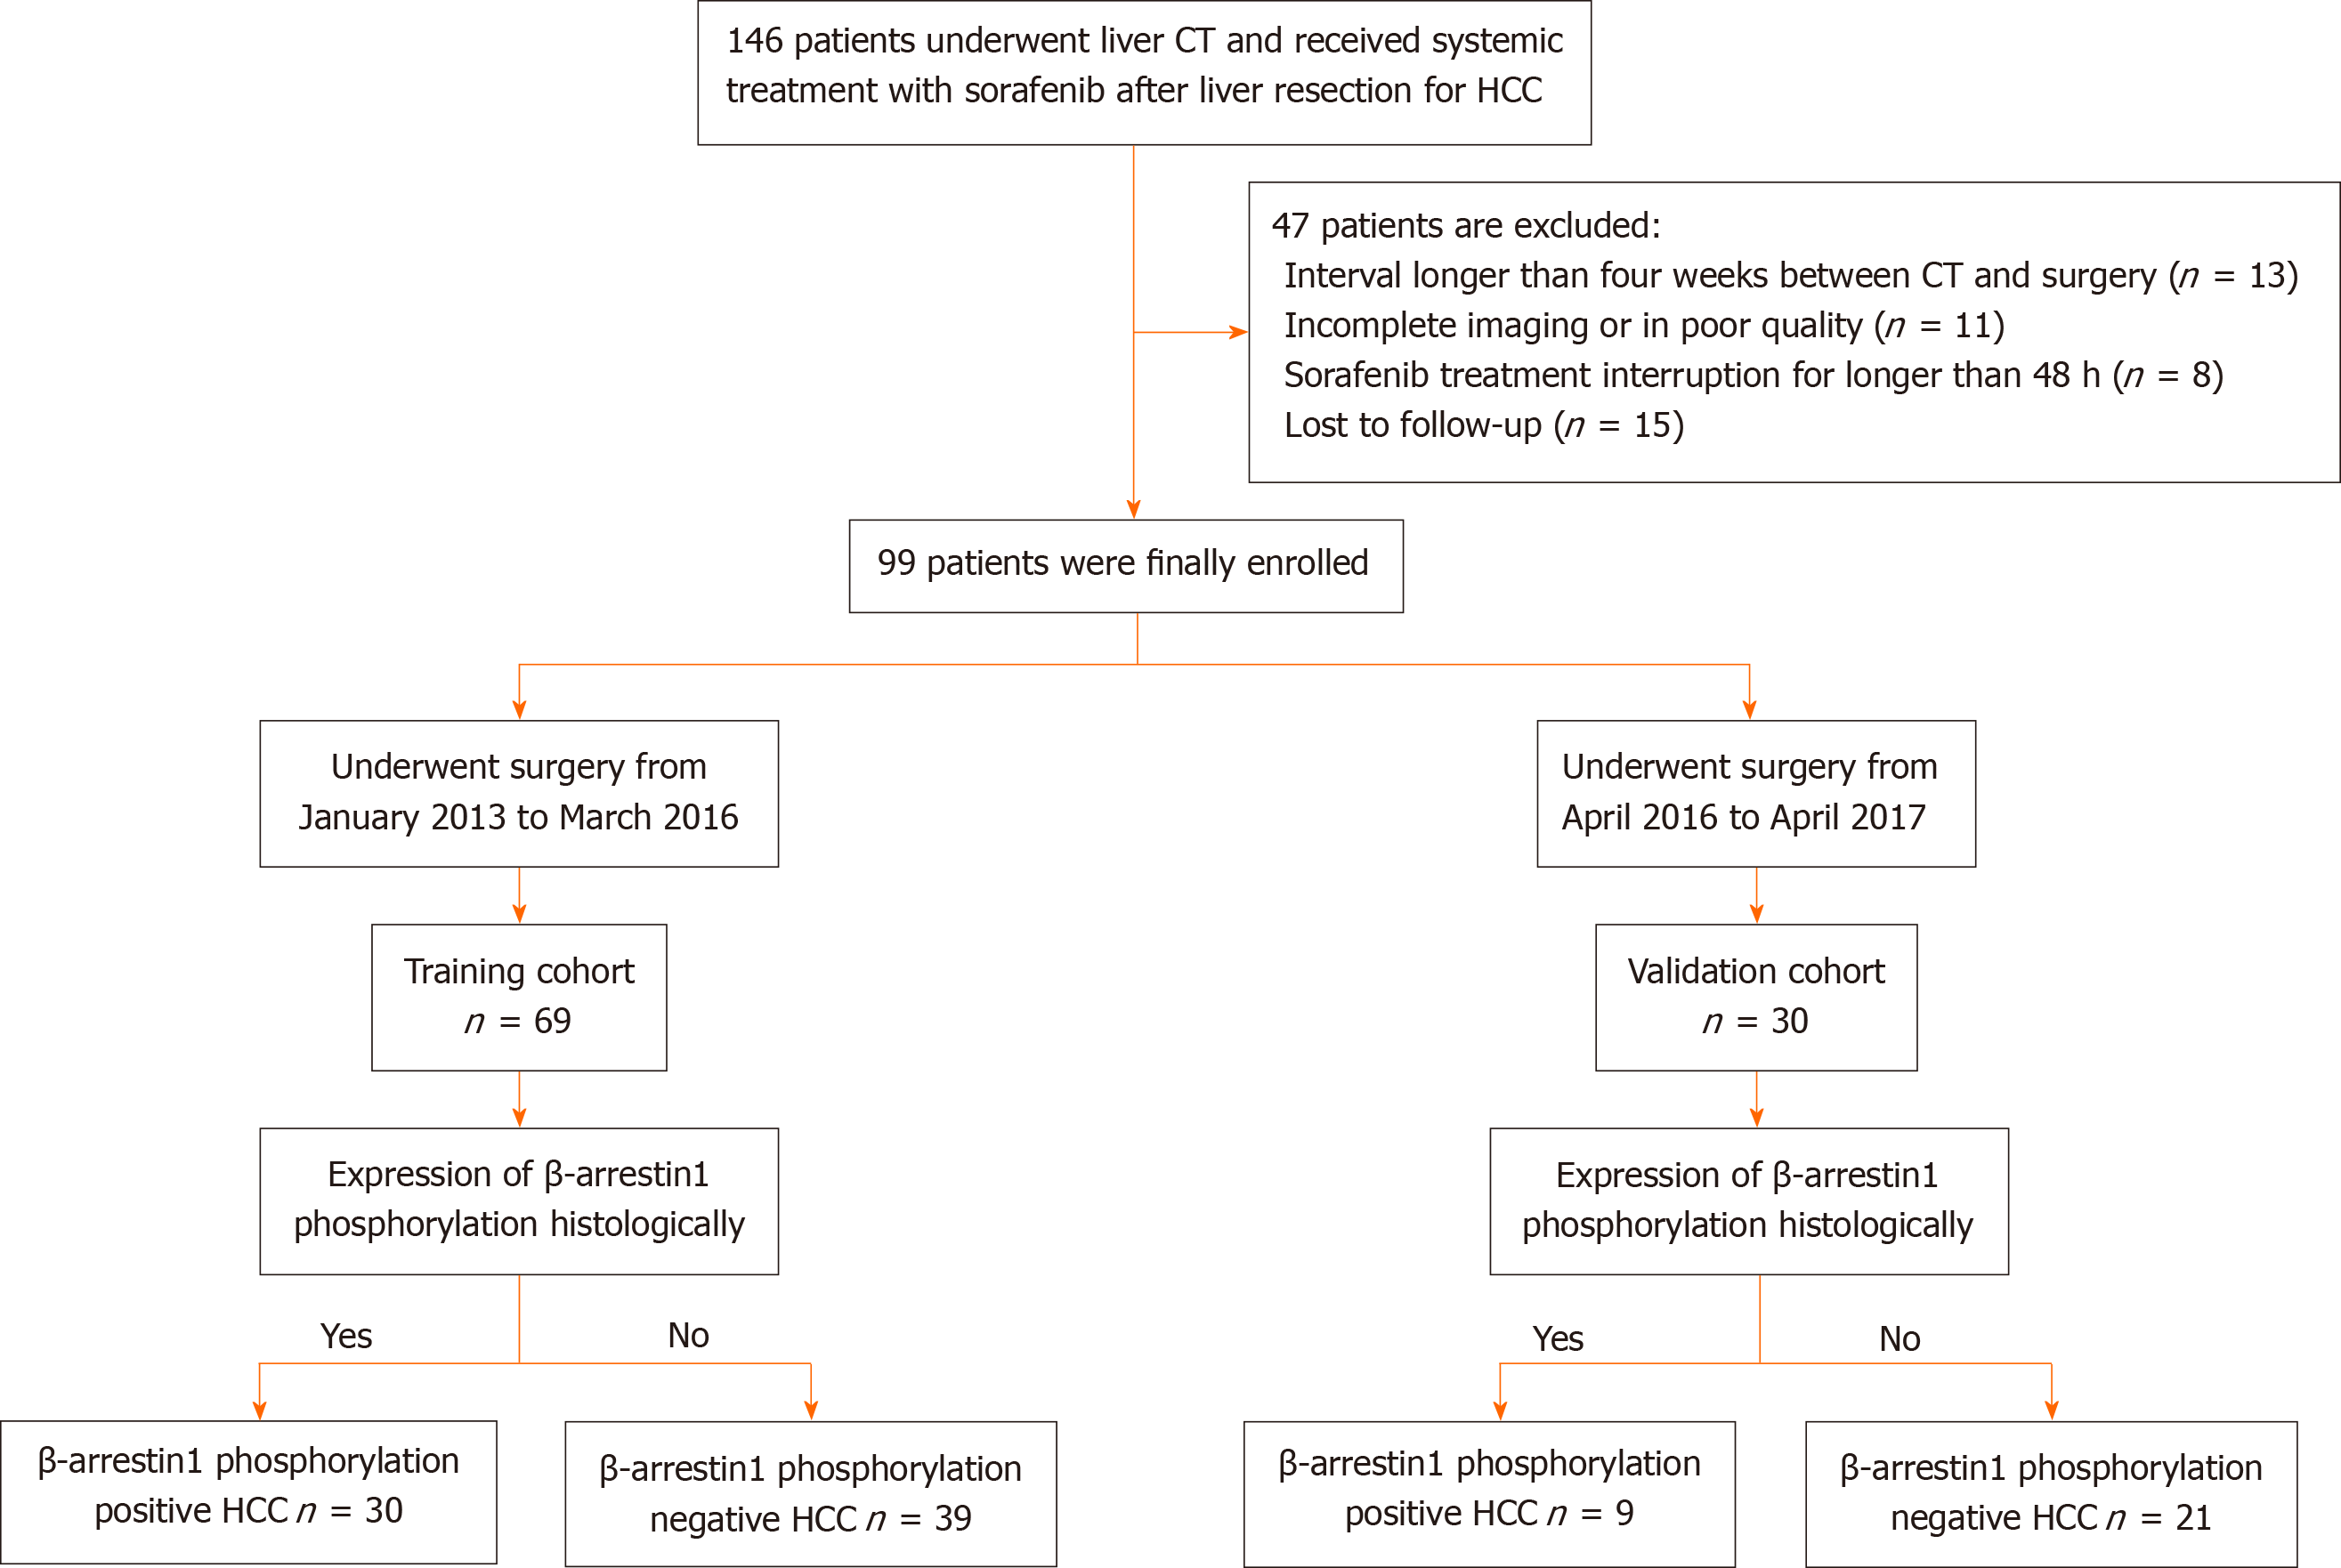
Figure 1 Patient recruitment process.
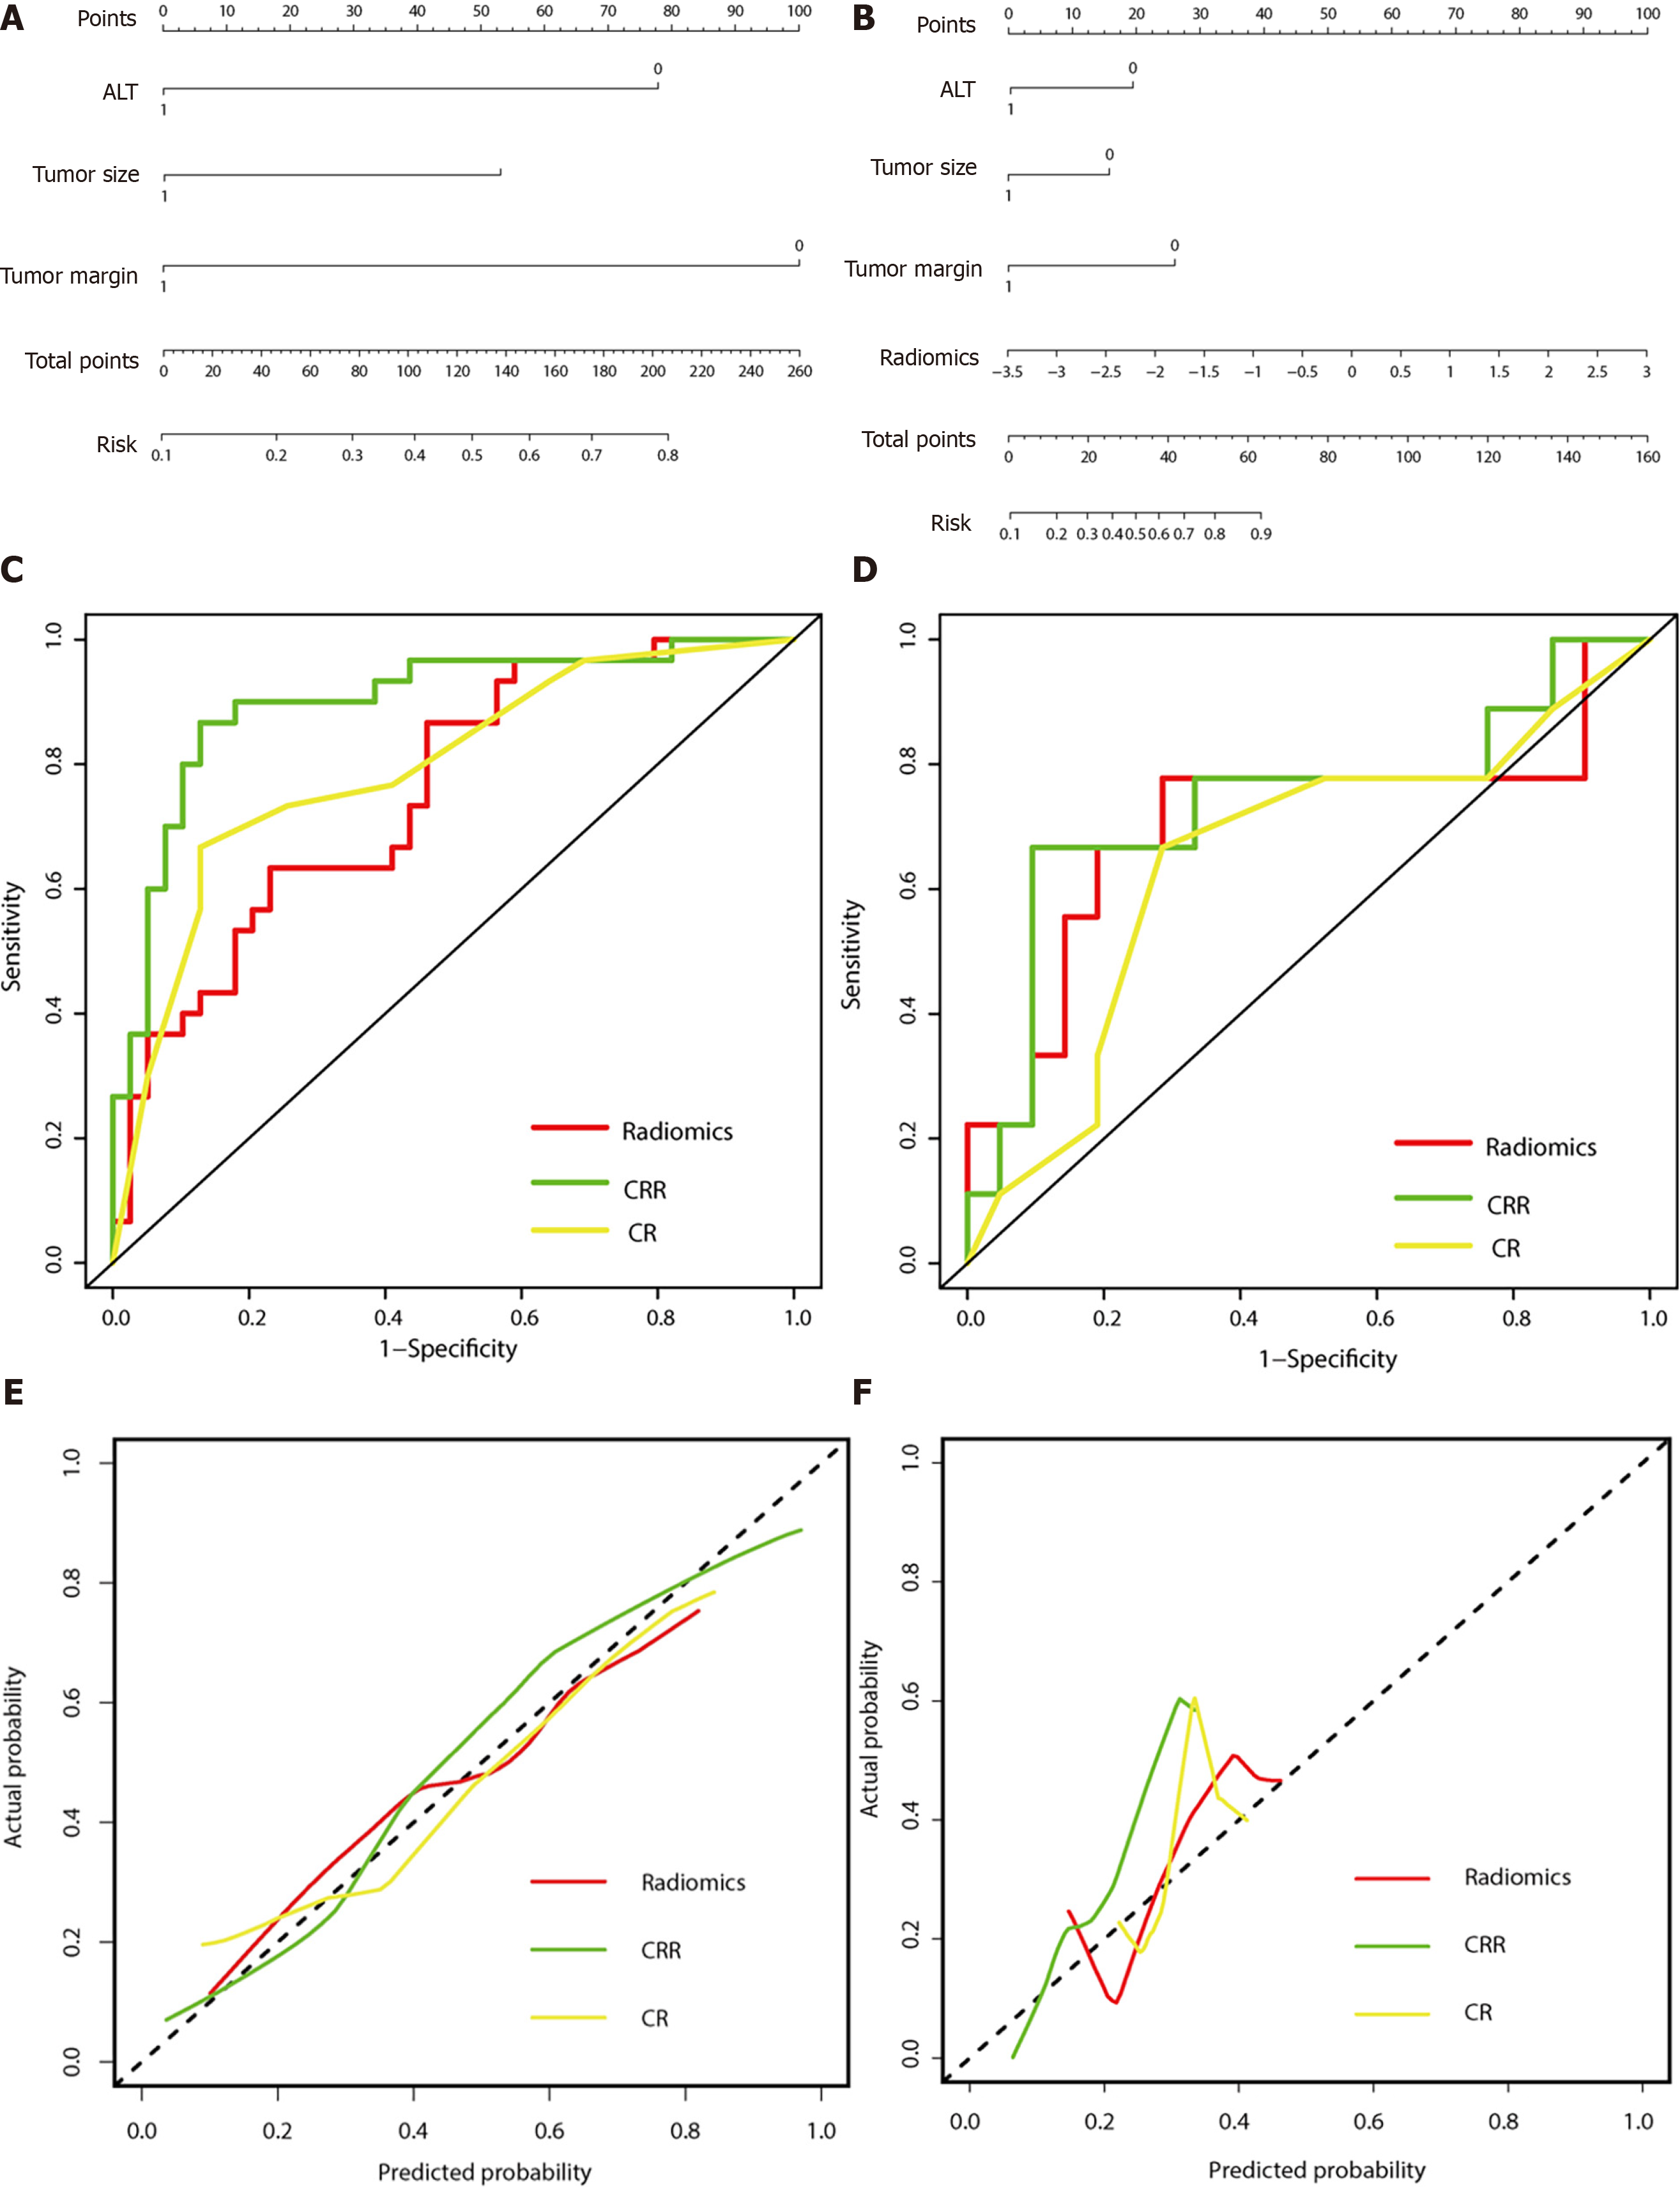
Figure 2 Performance of the three models.
A: The developed clinico-radiological (CR) nomogram; B: The developed clinico-radiological-radiomics (CRR) nomogram. Predictor points are found on the uppermost point scale that corresponds to each variable. On the bottom scale, the points for all variables are added and translated into a β-arrestin1 phosphorylation positivity probability. C: Comparison of receiver operating characteristic (ROC) curves of the radiomics model, CR model and CRR model in the training cohort; D: Comparison of receiver operating characteristic (ROC) curves of the radiomics model, CR model and CRR model in the validation cohort. E: Calibration curves of the three models in the training cohort; F: Calibration curves of the three models in the validation cohort. The actual high expression of p-β-arrestin1 is represented on the y-axis, and the predicted probability is represented on the x-axis. The closer fit of the solid line to the ideal black dotted line indicates a better calibration.
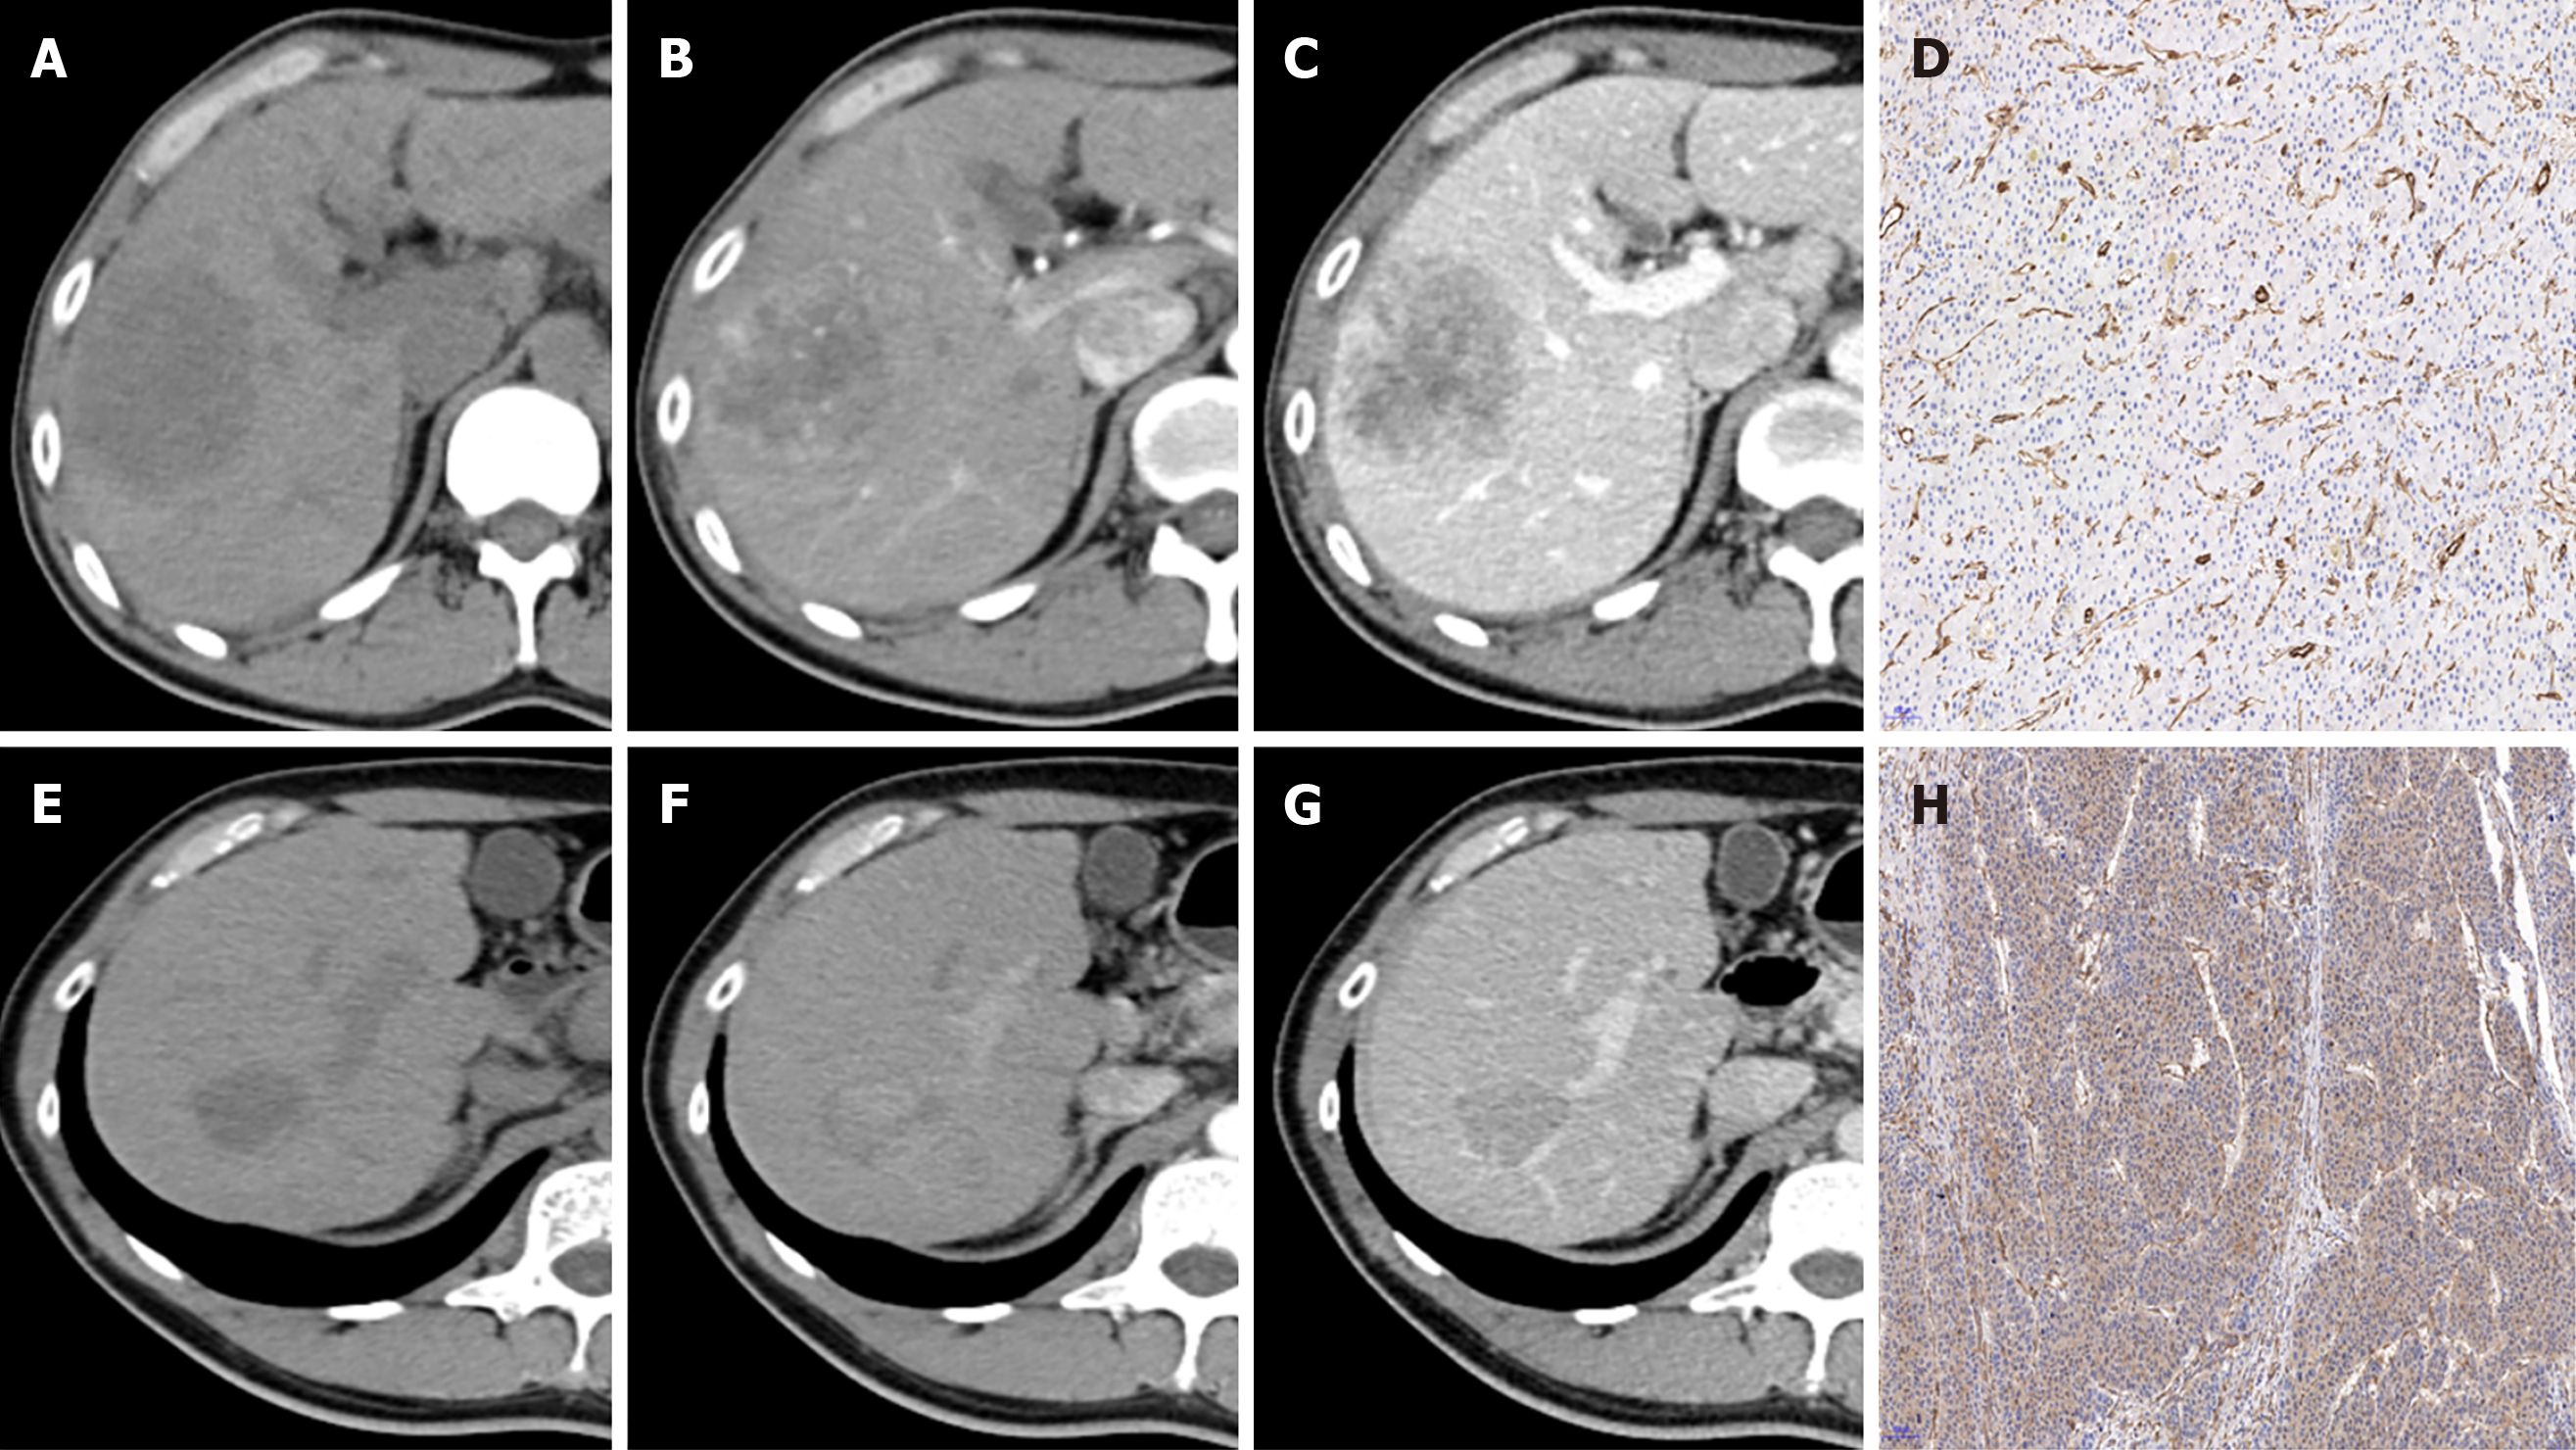
Figure 3 Representative images of contrast-enhanced computed tomography and β-Arrestin1 phosphorylation (magnification, × 100).
A: CT images of a 45-year-old man with a 6.3-cm hepatocellular carcinoma (HCC) in the right liver lobe in the plain phase; B: The tumor shows heterogeneous hyperenhancement in the arterial phase; C: The tumor shows washout at the portal venous phase with intratumor necrosis, an ill-defined capsule and a non-smooth tumor margin. D: Immunohistochemical staining shows a β-arrestin1 phosphorylation-negative status at 100× magnification.
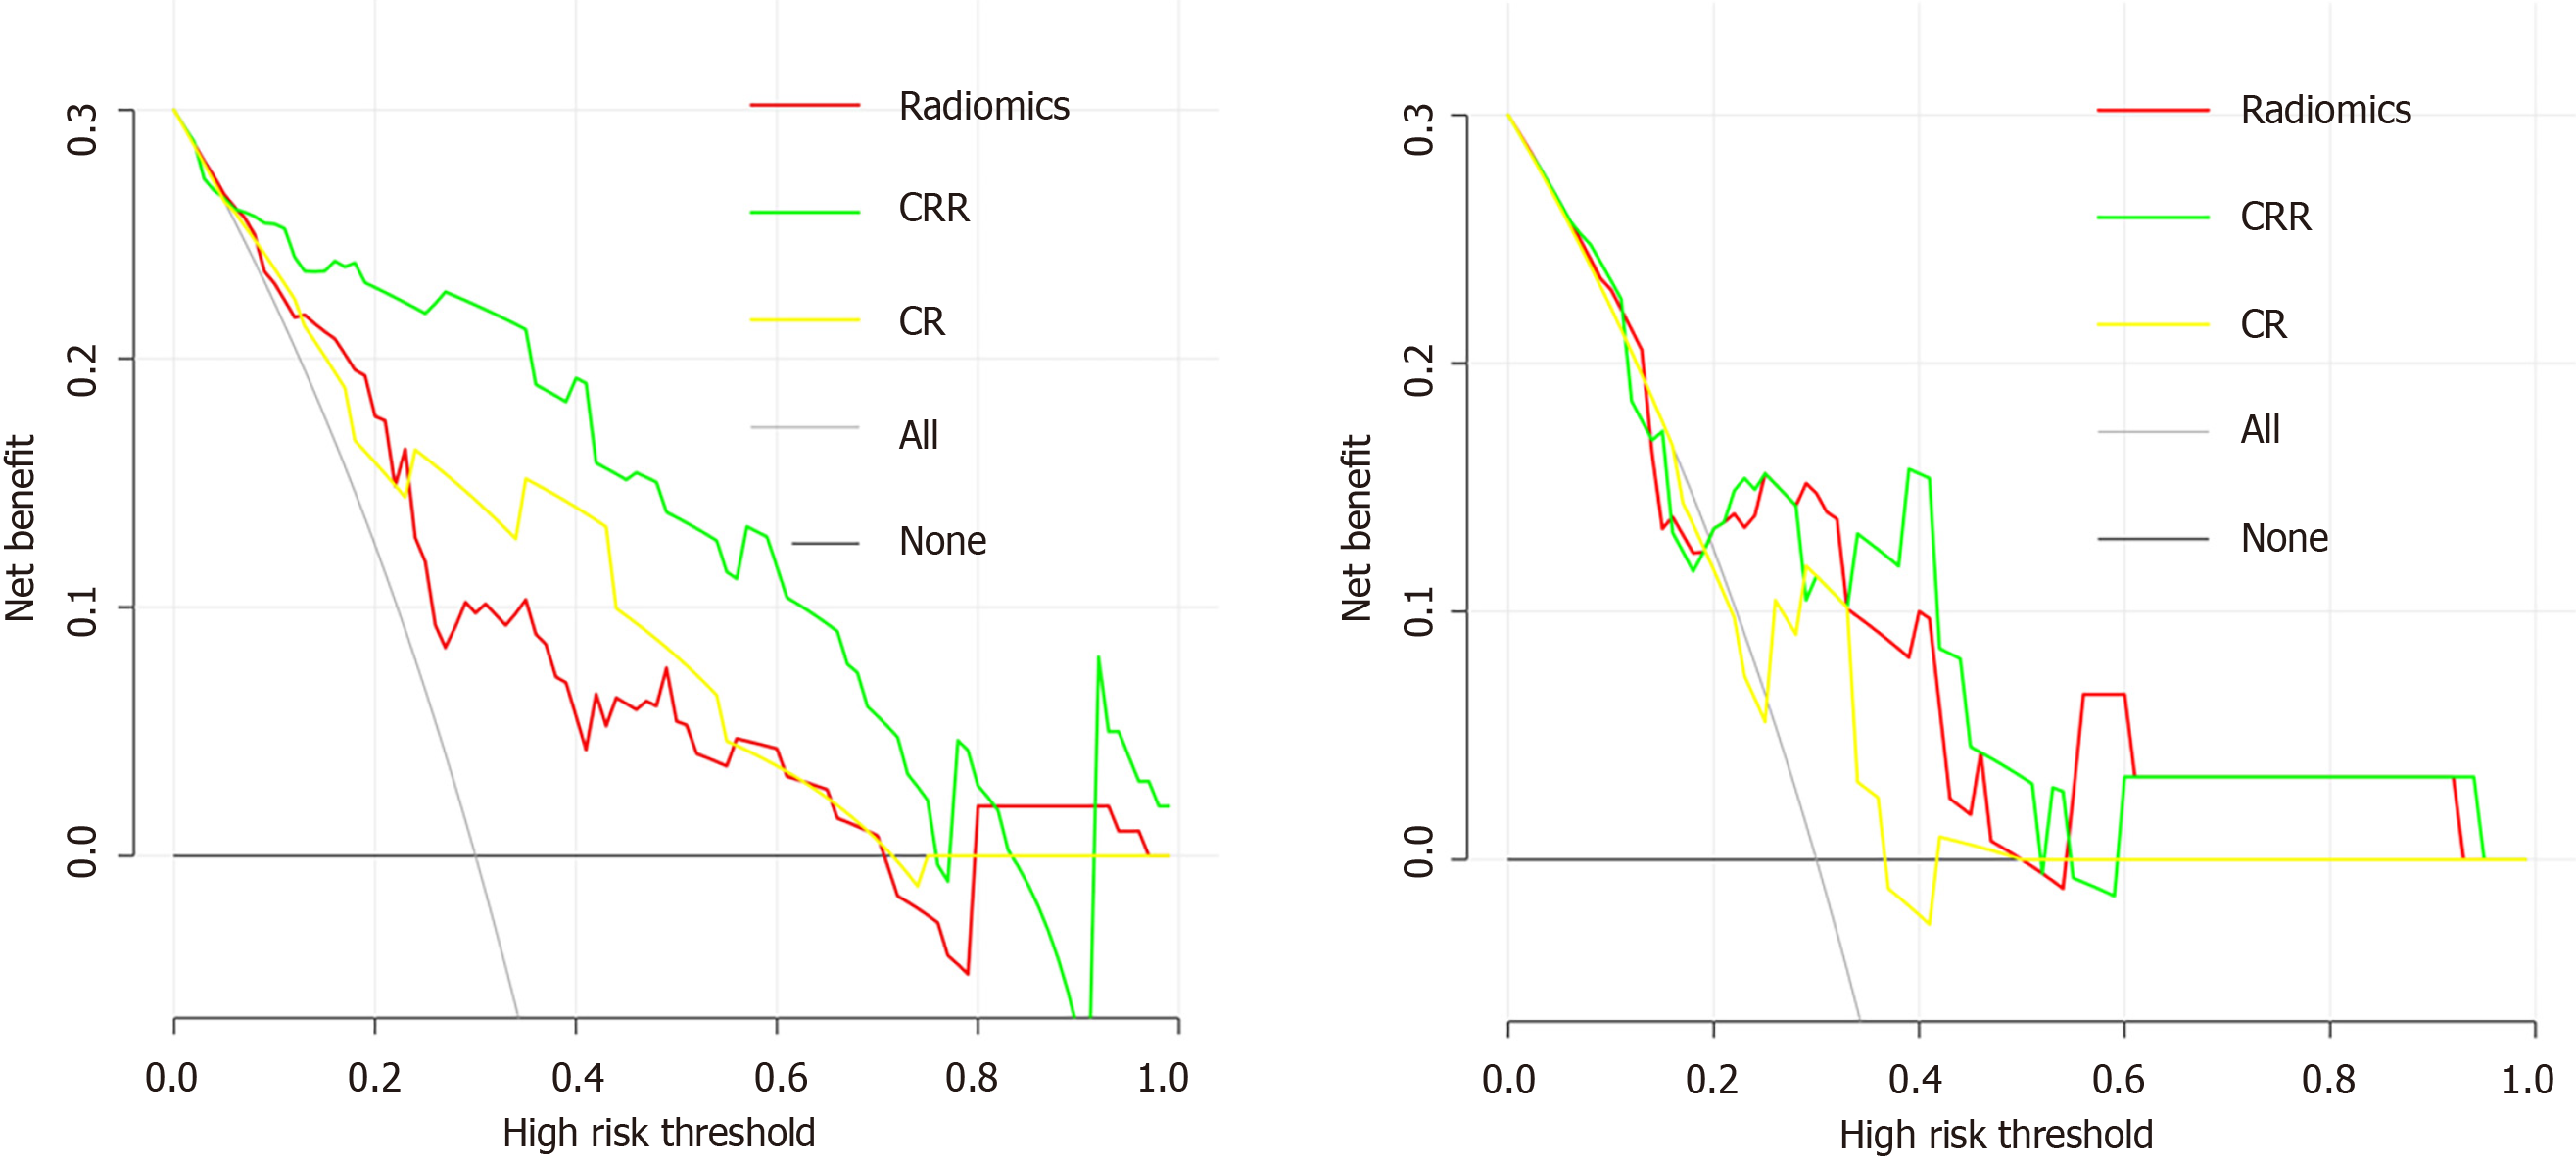
Figure 4 Decision curve analysis for each model.
A: Decision curve analysis in the training cohort; B: Decision curve analysis in the validation cohort. The y-axis measures the net benefit, and the x-axis is the threshold probability. The gray line represents the hypothesis that all patients are β-arrestin1 phosphorylation-positive. The black line represents the hypothesis that all patients are β-arrestin1 phosphorylation-negative. Among the three models, the clinico-radiological-radiomics (CRR) model provided the highest net benefit compared with the radiomics and clinico-radiological (CR) models.
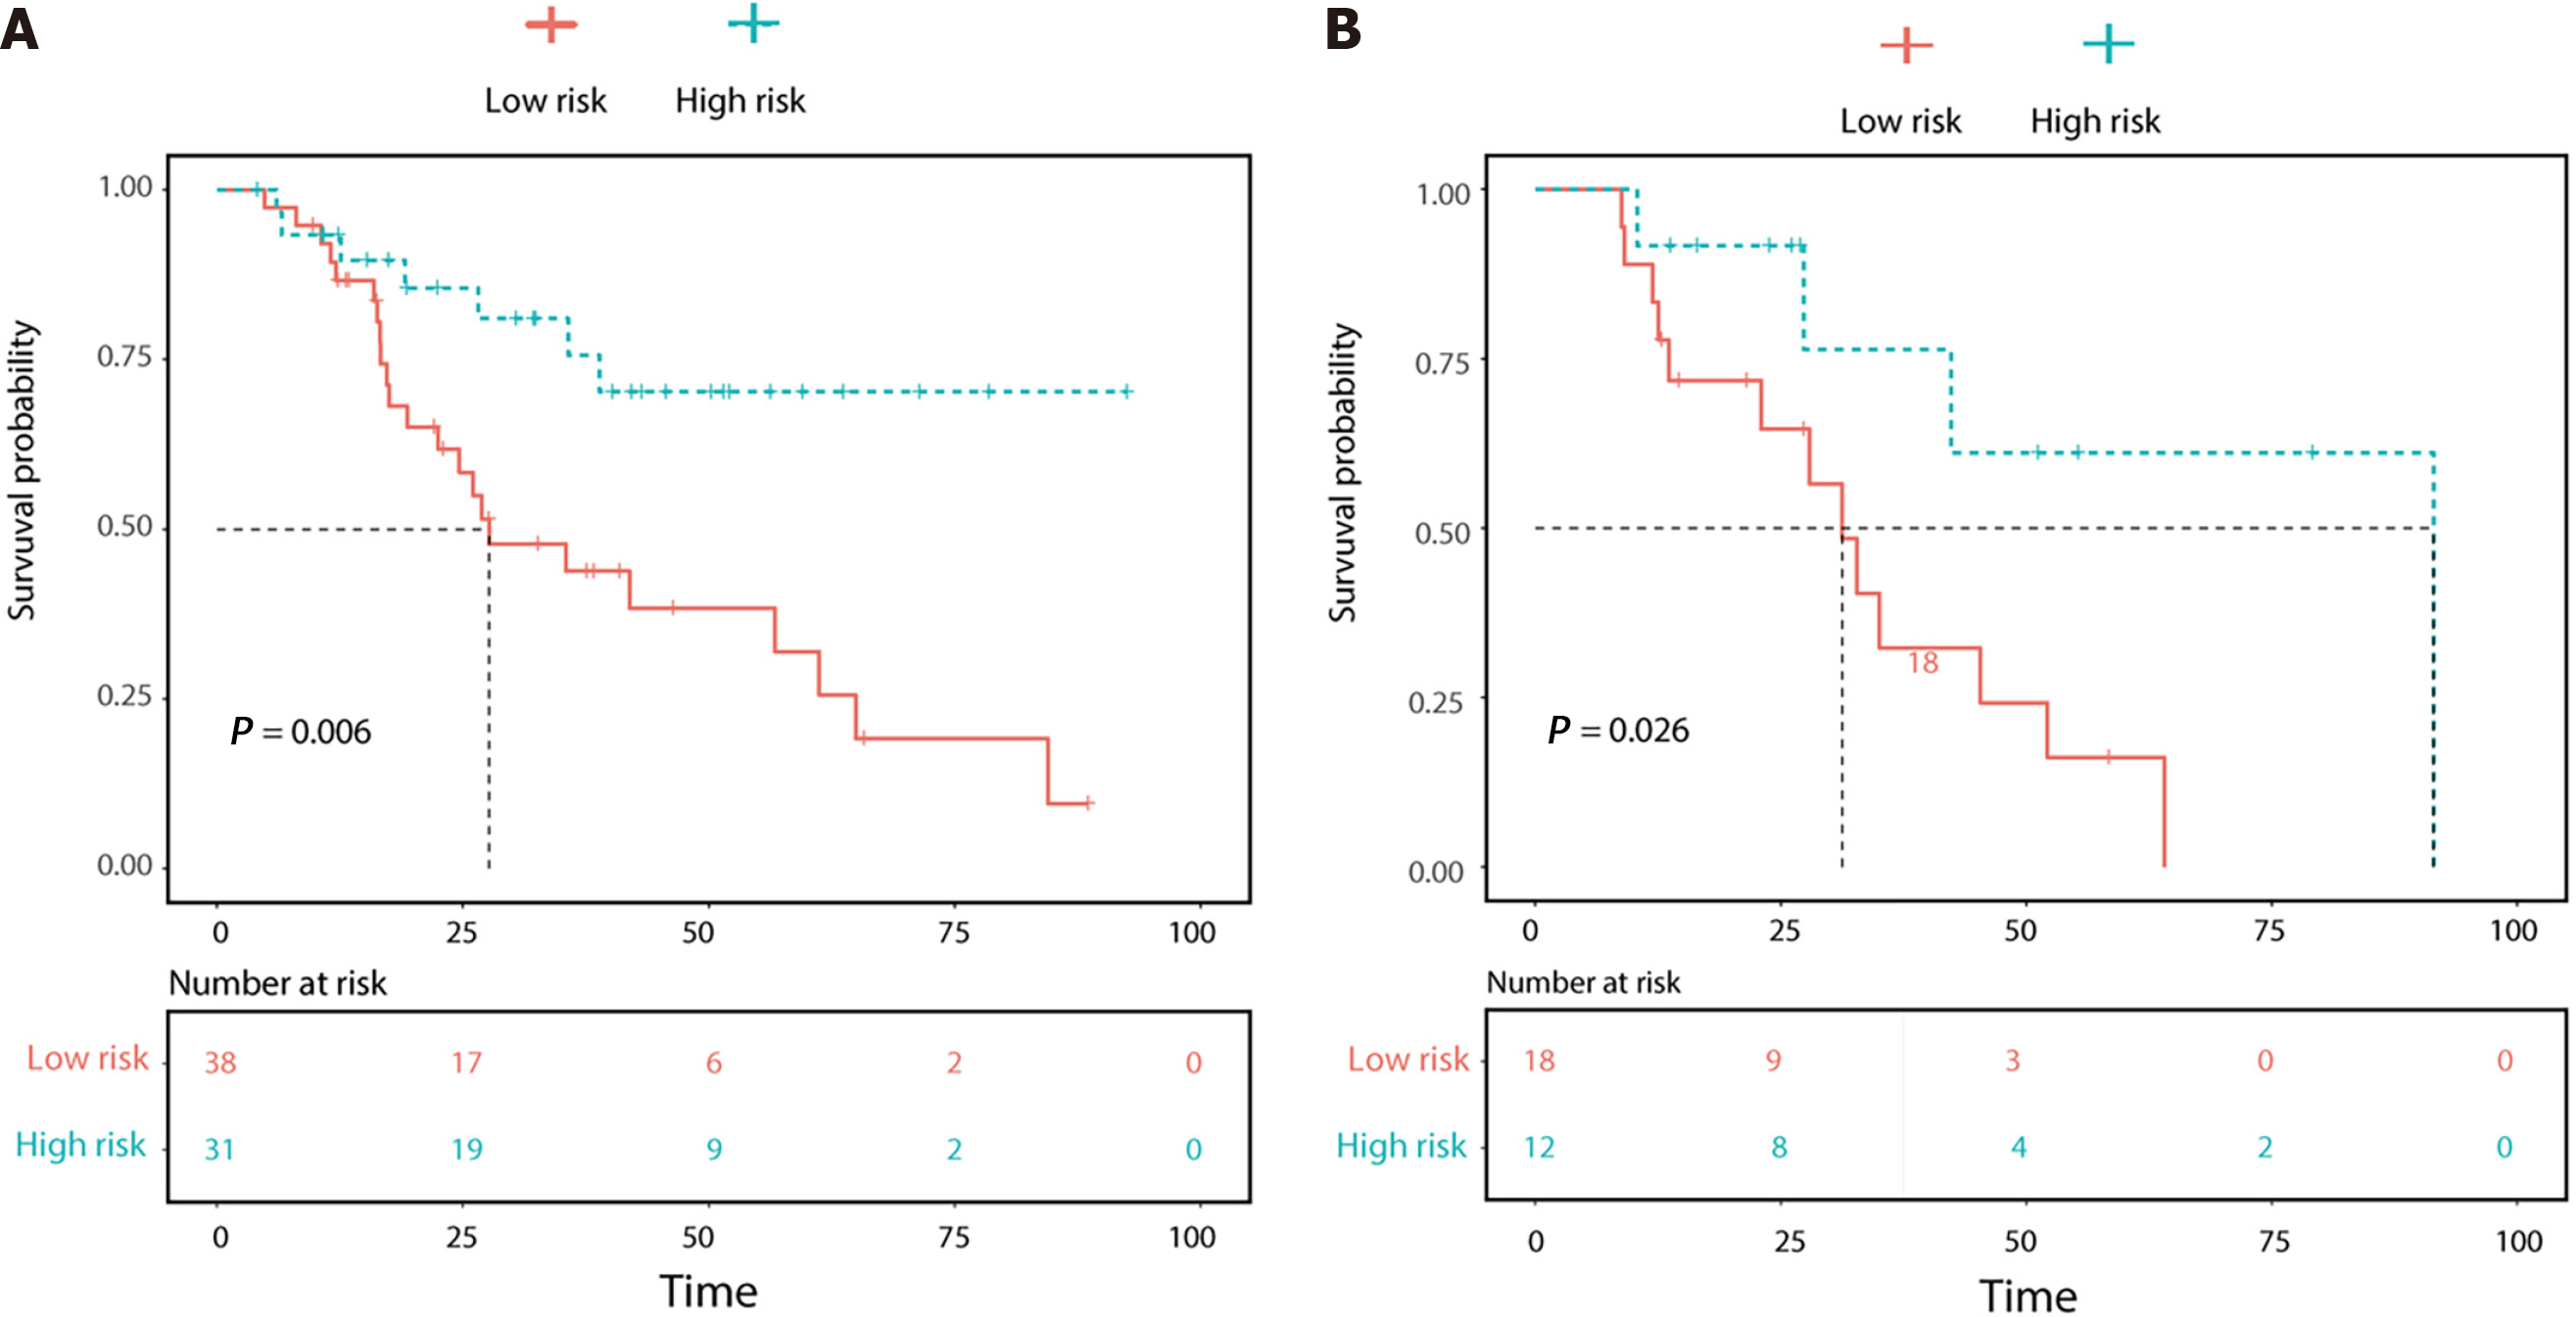
Figure 5 Overall survival (OS) curve analysis.
A: The OS curve estimates by clinic-radiological-radiomics model in patients with β-Arrestin1 phosphorylation positive and β-Arrestin1 phosphorylation negative in the training cohort; B: The OS curve estimates by clinic-radiological-radiomics model in patients with β-Arrestin1 phosphorylation positive and β-Arrestin1 phosphorylation negative in the validation cohort.
- Citation: Che F, Xu Q, Li Q, Huang ZX, Yang CW, Wang LY, Wei Y, Shi YJ, Song B. Radiomics signature: A potential biomarker for β-arrestin1 phosphorylation prediction in hepatocellular carcinoma. World J Gastroenterol 2022; 28(14): 1479-1493
- URL: https://www.wjgnet.com/1007-9327/full/v28/i14/1479.htm
- DOI: https://dx.doi.org/10.3748/wjg.v28.i14.1479


