Copyright
©The Author(s) 2022.
World J Gastroenterol. Apr 14, 2022; 28(14): 1444-1454
Published online Apr 14, 2022. doi: 10.3748/wjg.v28.i14.1444
Published online Apr 14, 2022. doi: 10.3748/wjg.v28.i14.1444
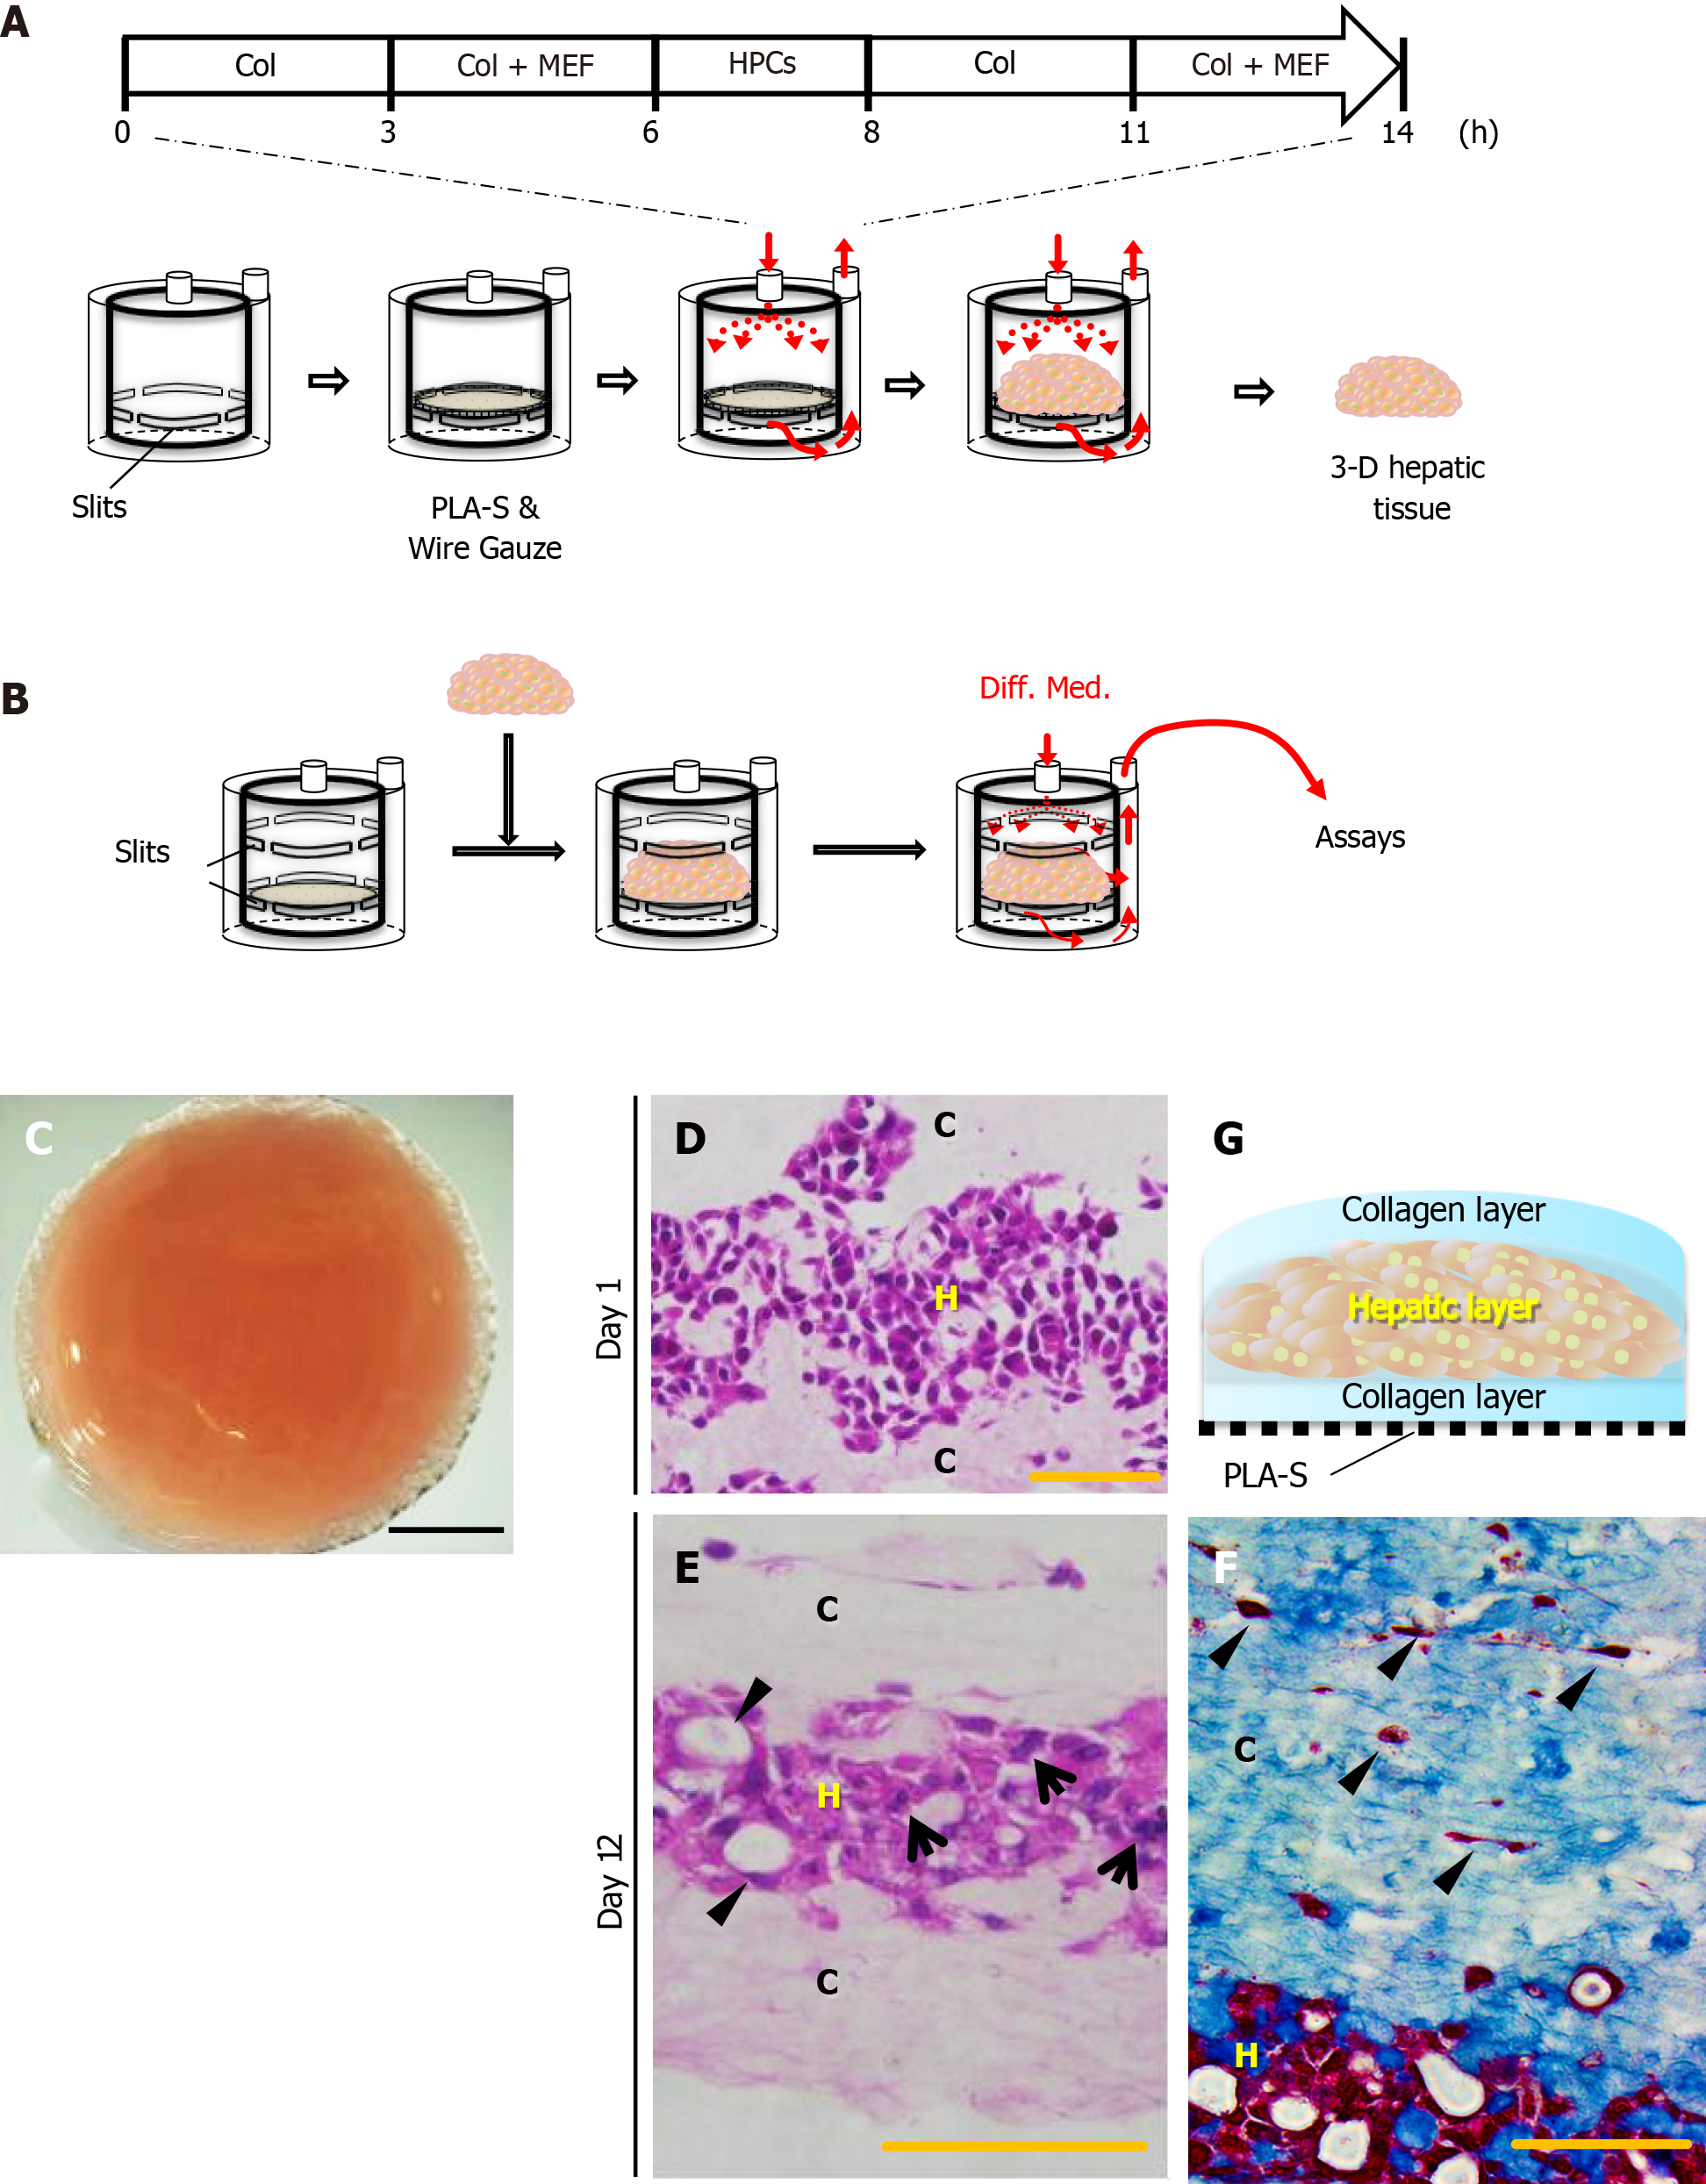
Figure 1 Reconstruction of the three-dimensional liver tissue culture model using hepatic progenitor cells.
A and B: A schematic illustration showing reconstruction of the liver tissue culture model using a bioreactor; preparation steps (A), and culture steps (B); C: Micrographs of a reconstructed three-dimensional (3-D) liver tissue culture model with dense collagen fibrils; D and E: Histological analyses: hematoxylin-eosin staining of a section of the 3-D liver tissue culture model on day 1 (D) and day 12 (E). Arrows indicate binuclear populations, like hepatocytes. Arrowheads indicate a bile duct–like structure; F: Histological analyses: AZAN staining of a section of the 3-D liver tissue culture model on day 12. Arrowheads indicate fibroblasts at condensed collagen fibril matrices. Bar corresponds to (C) 5 mm, (D) 50 μm, and (E) and (F) 100 μm. Col: Collagen; HPCs: Portal branch-ligated-hepatic progenitor cells; PLA-S: Polylactic acid sheet; C: Collagen layer; H: Hepatic layer.
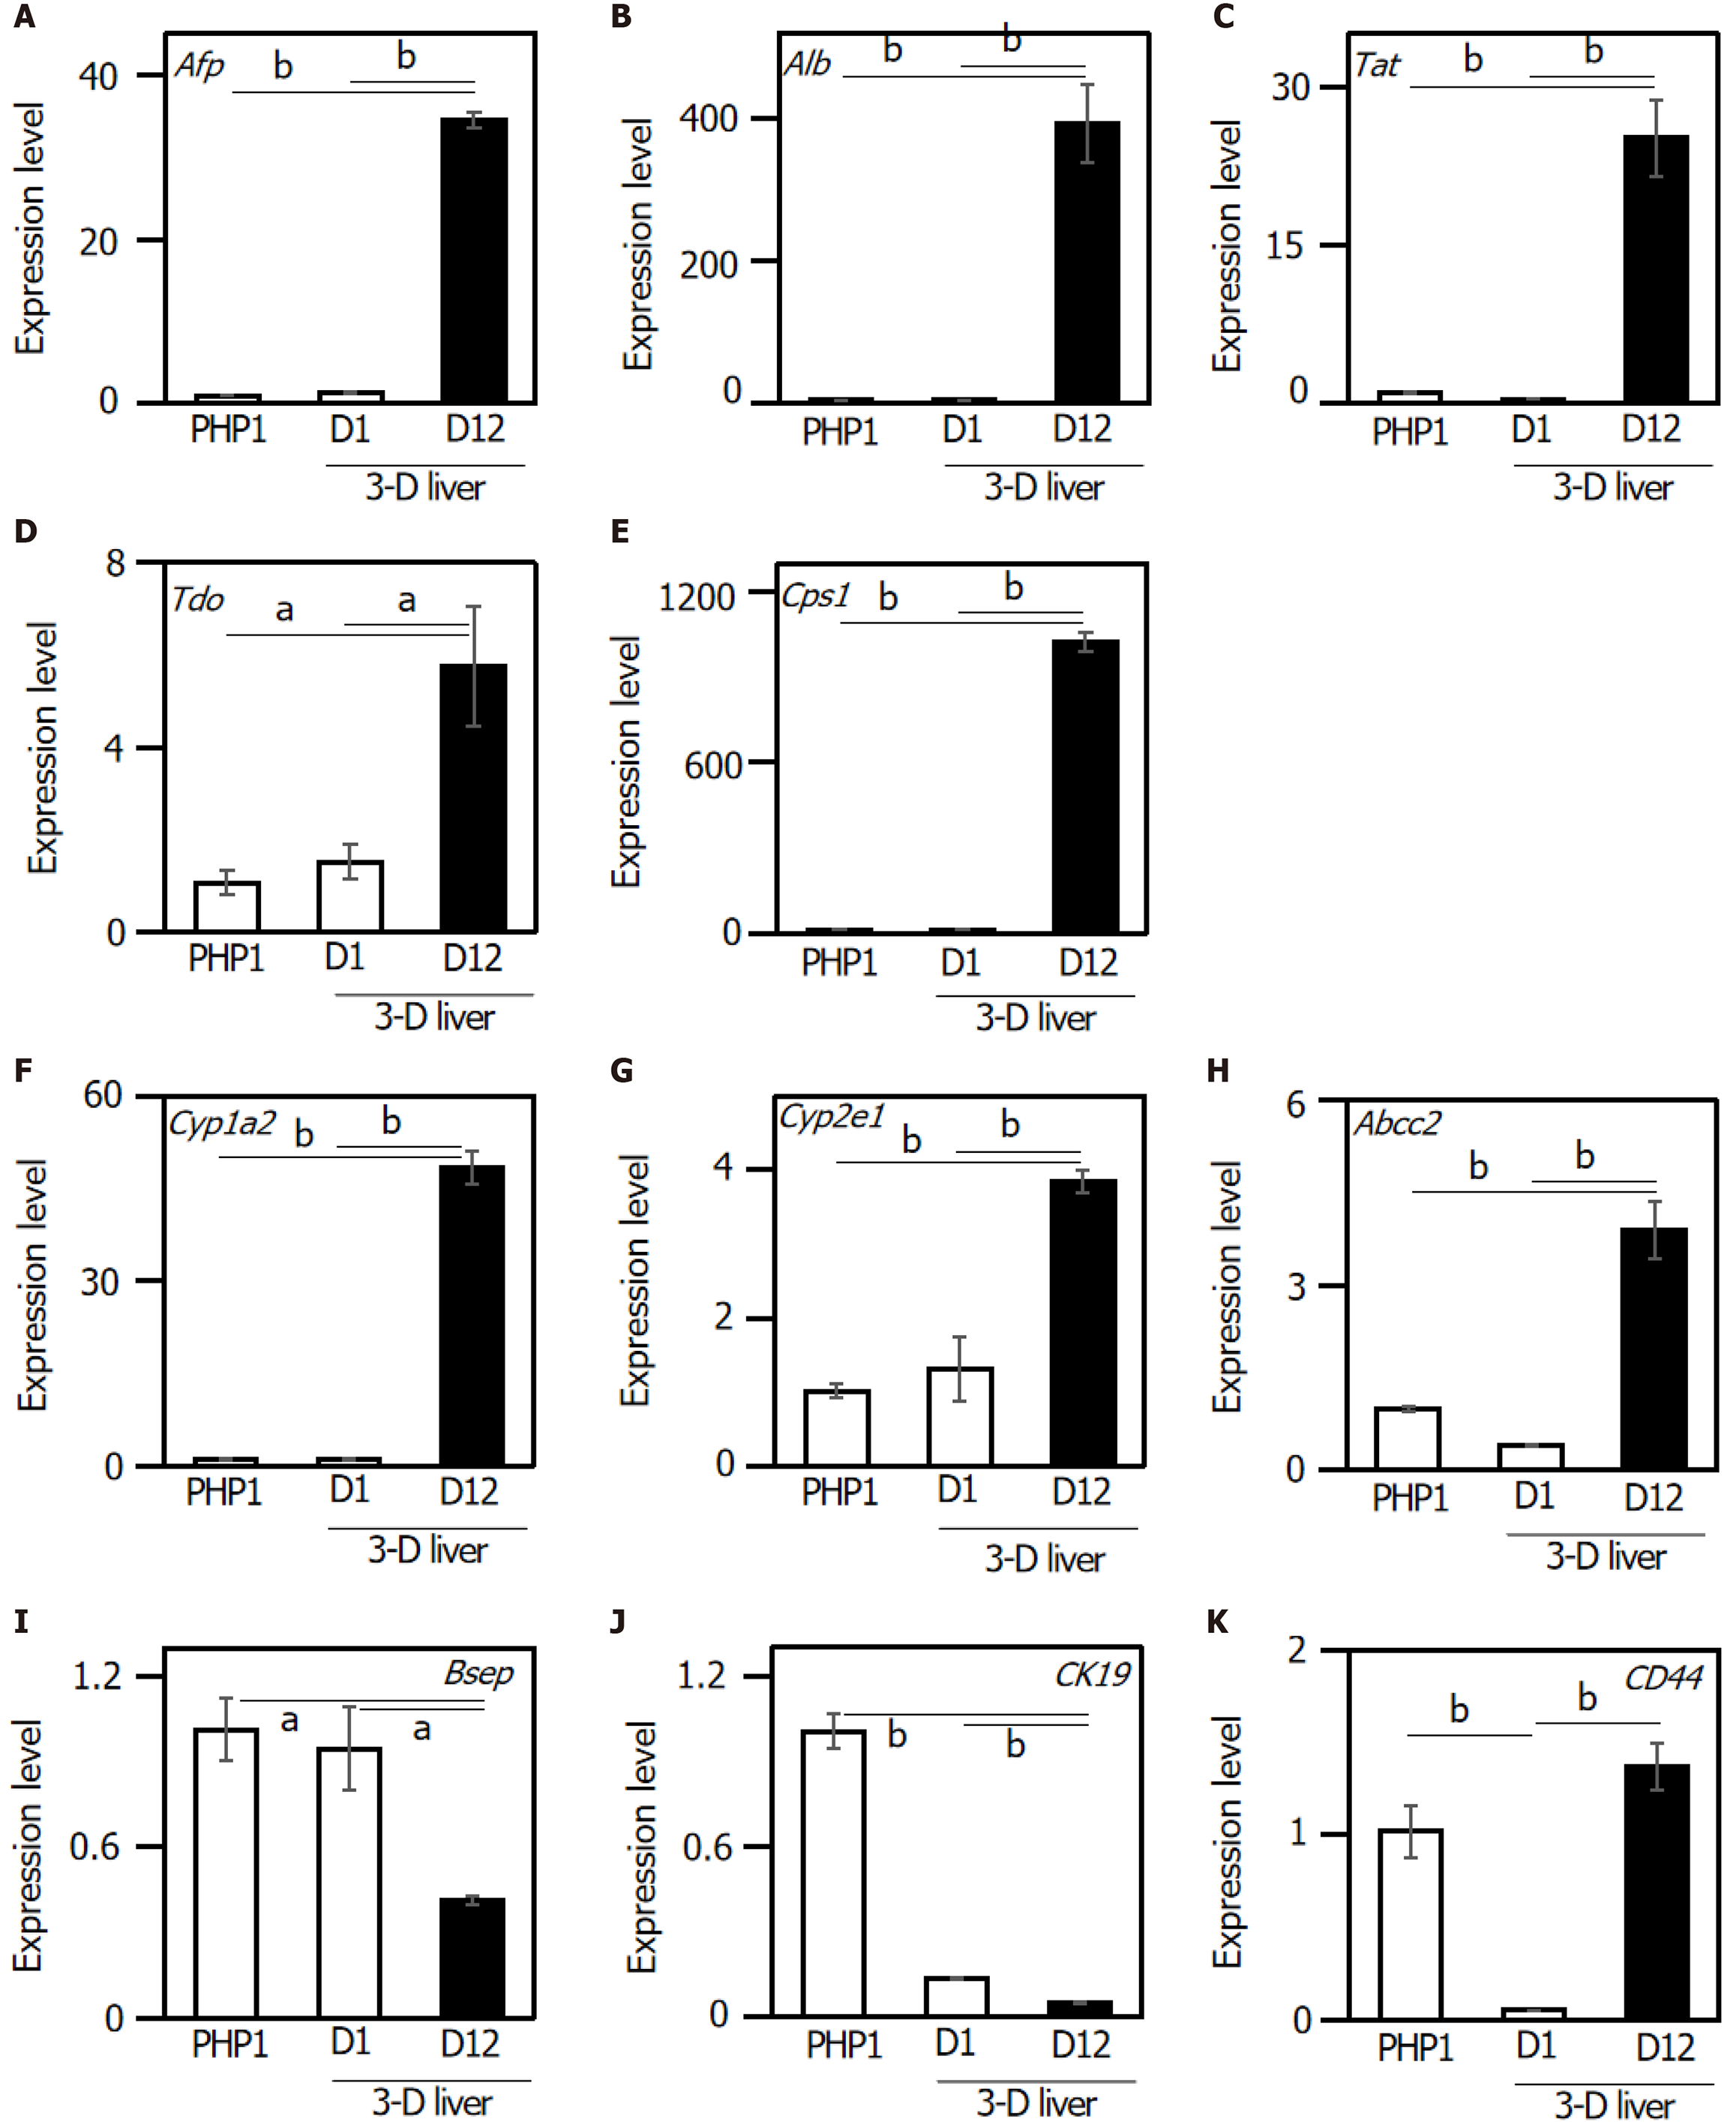
Figure 2 Relative gene expression levels in the three-dimensional liver tissue culture model cultured in a bioreactor on day 1 and day 12.
Relative gene expression levels were analyzed in the three-dimensional liver tissue culture model. A: Afp; B: Albumin; C: Tat; D: Tdo; E: Cps1; F: Cyp1a2; G: Cyp2e1; H: Abcc2; I: Bsep; J: CK19; K: CD44. Hprt was used as an internal control. Statistical comparisons were made using the Tukey-Kramer method. Data are shown as means ± SE, n = 3, aP < 0.05 and bP < 0.01. Afp: Alpha-fetoprotein; Tat: Tyrosine aminotransferase; Tdo: Tryptophan 2,3-dioxygenase; Cps1: Carbamoyl-phosphate synthetase 1; Cyp1a2: Cytochrome P450, family 1, sub-family a2; Cyp2e1: Cytochrome P450, family 2, sub-family e1; Abcc2: ATP-binding cassette, sub-family C (CFTR/MRP), member 2; Bsep: Bile salt export pump; ABCB11: ATP-binding cassette, sub-family B member 11; CK19: Cytokeratin 19; CD44: Hyaluronic Acid Binding Protein.
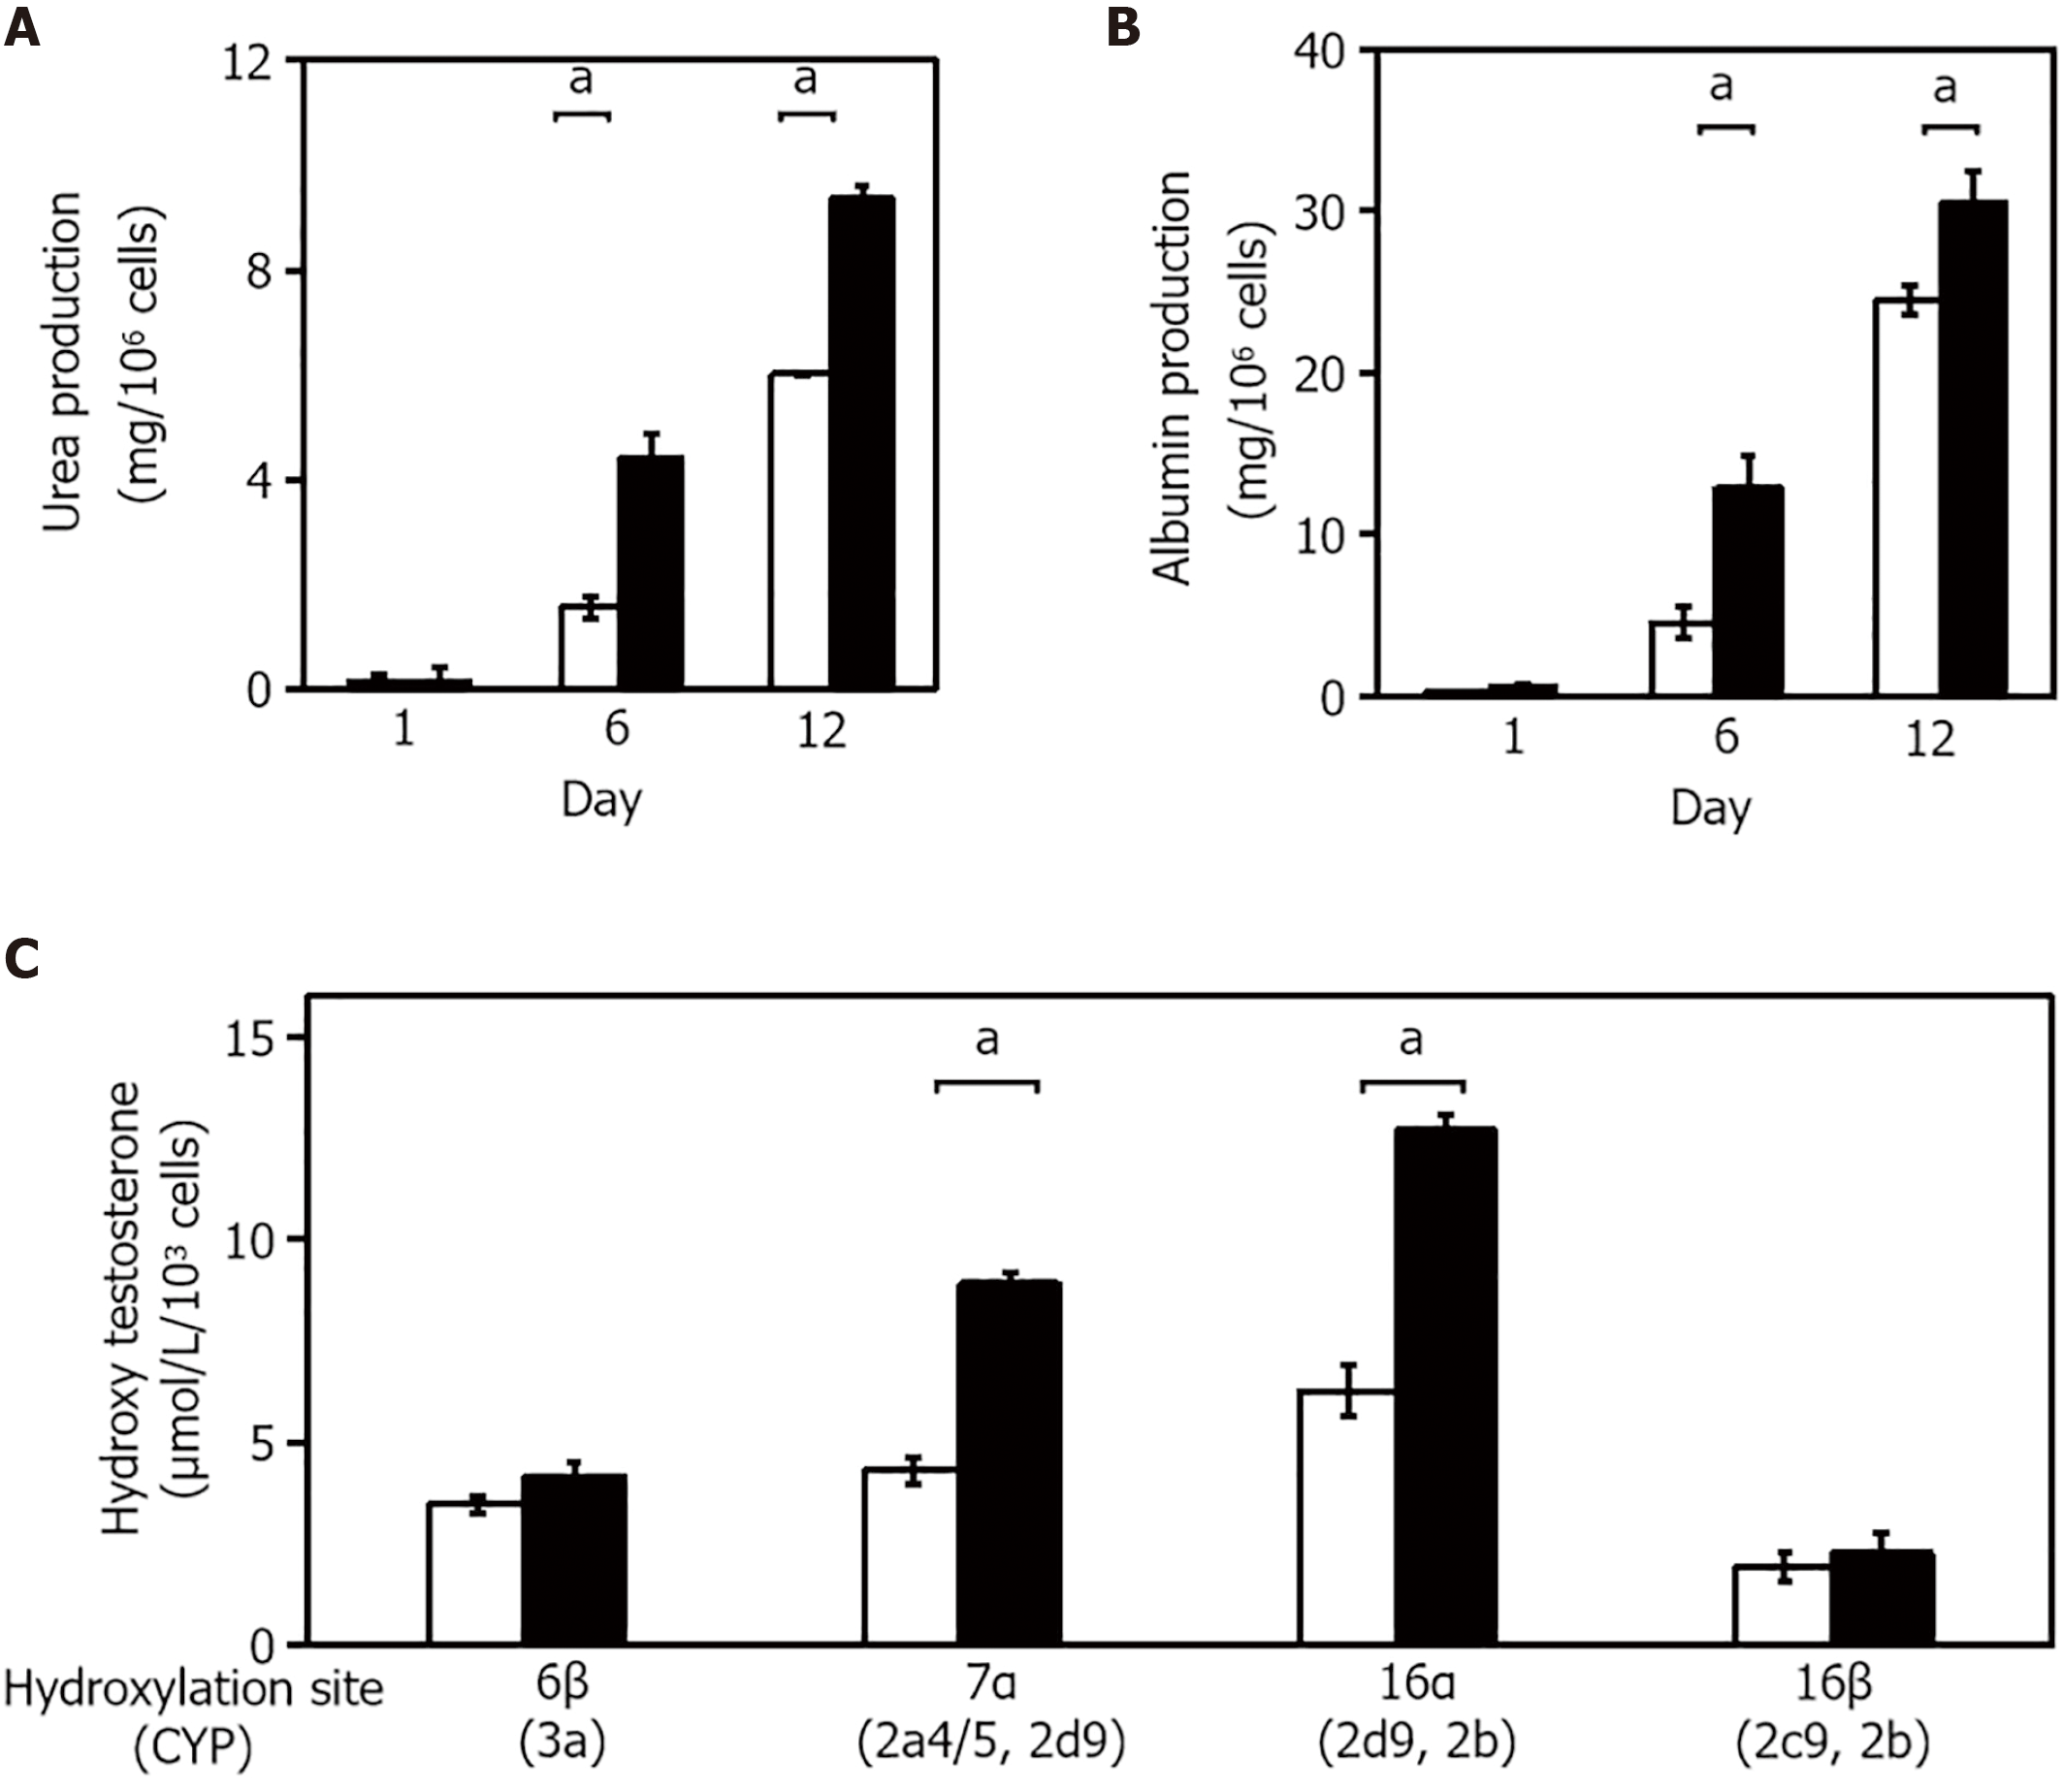
Figure 3 Validation of hepatic functions in the three-dimensional liver tissue culture model.
A and B: Urea (A) and albumin (B) production levels in the culture medium in each culture condition; C: Hydroxylation activity of testosterone in the three-dimensional (3-D) liver tissue culture model. The amount of each hydroxylated testosterone in culture medium. Culture medium was changed every 2 d over the course of the measurement period. 2-D culture (open columns) and 3-D culture (closed columns) system. Statistical comparisons were made using the Welch t-test. Data are shown as means ± SE, n = 3, aP < 0.01.
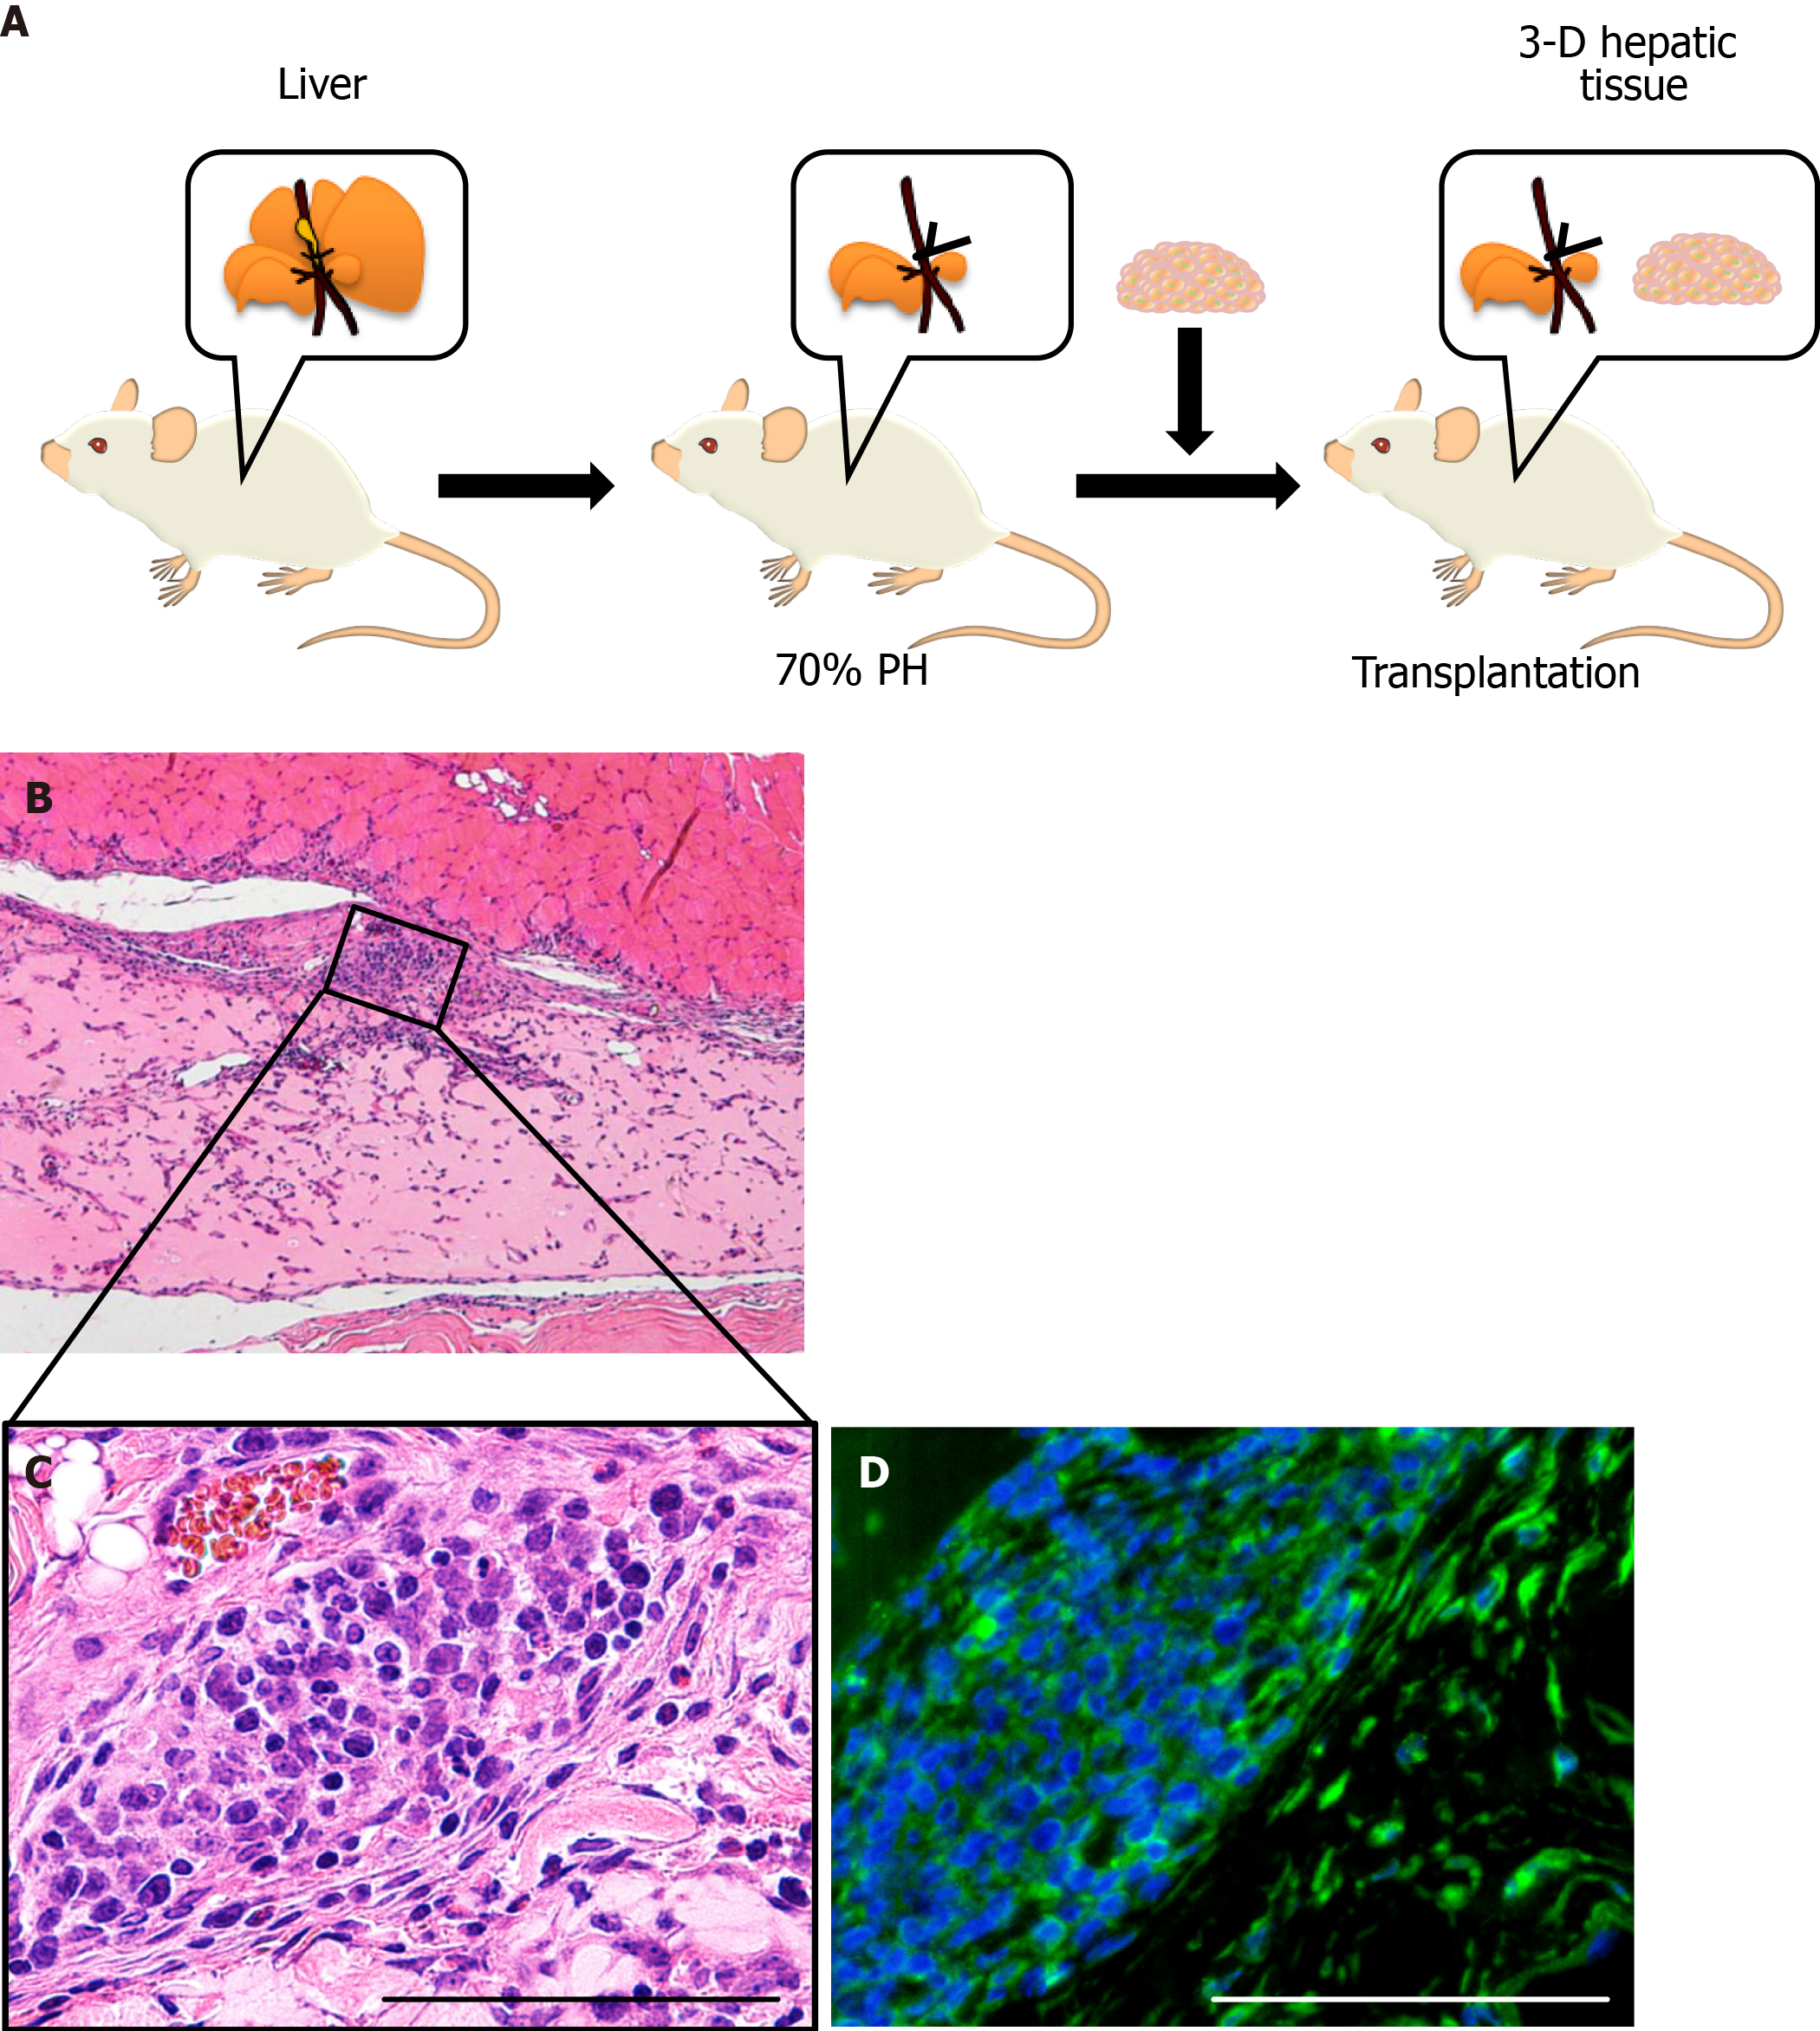
Figure 4 Transplanted three-dimensional liver tissue culture models in partially hepatectomized model mice.
A: A schematic illustration showing the transplantation of the three-dimensional (3-D) liver tissue culture model; B: Histological analyses and hematoxylin-eosin staining of the section for the 3-D liver tissue culture model after transplantation; C: Higher magnification of the inscribed area in (B). The vascularization was observable at condensed collagen fibril matrices. Arrowheads indicate new blood vessels; D: Immunohistochemical analysis of the 3-D liver tissue culture model of albumin-positive hepatic cells after being transplanted using anti-albumin (green) antibodies. Bar corresponds to 100 μm.
- Citation: Tamai M, Adachi E, Kawase M, Tagawa YI. Syngeneic implantation of mouse hepatic progenitor cell-derived three-dimensional liver tissue with dense collagen fibrils. World J Gastroenterol 2022; 28(14): 1444-1454
- URL: https://www.wjgnet.com/1007-9327/full/v28/i14/1444.htm
- DOI: https://dx.doi.org/10.3748/wjg.v28.i14.1444


