Copyright
©The Author(s) 2022.
World J Gastroenterol. Apr 7, 2022; 28(13): 1347-1361
Published online Apr 7, 2022. doi: 10.3748/wjg.v28.i13.1347
Published online Apr 7, 2022. doi: 10.3748/wjg.v28.i13.1347
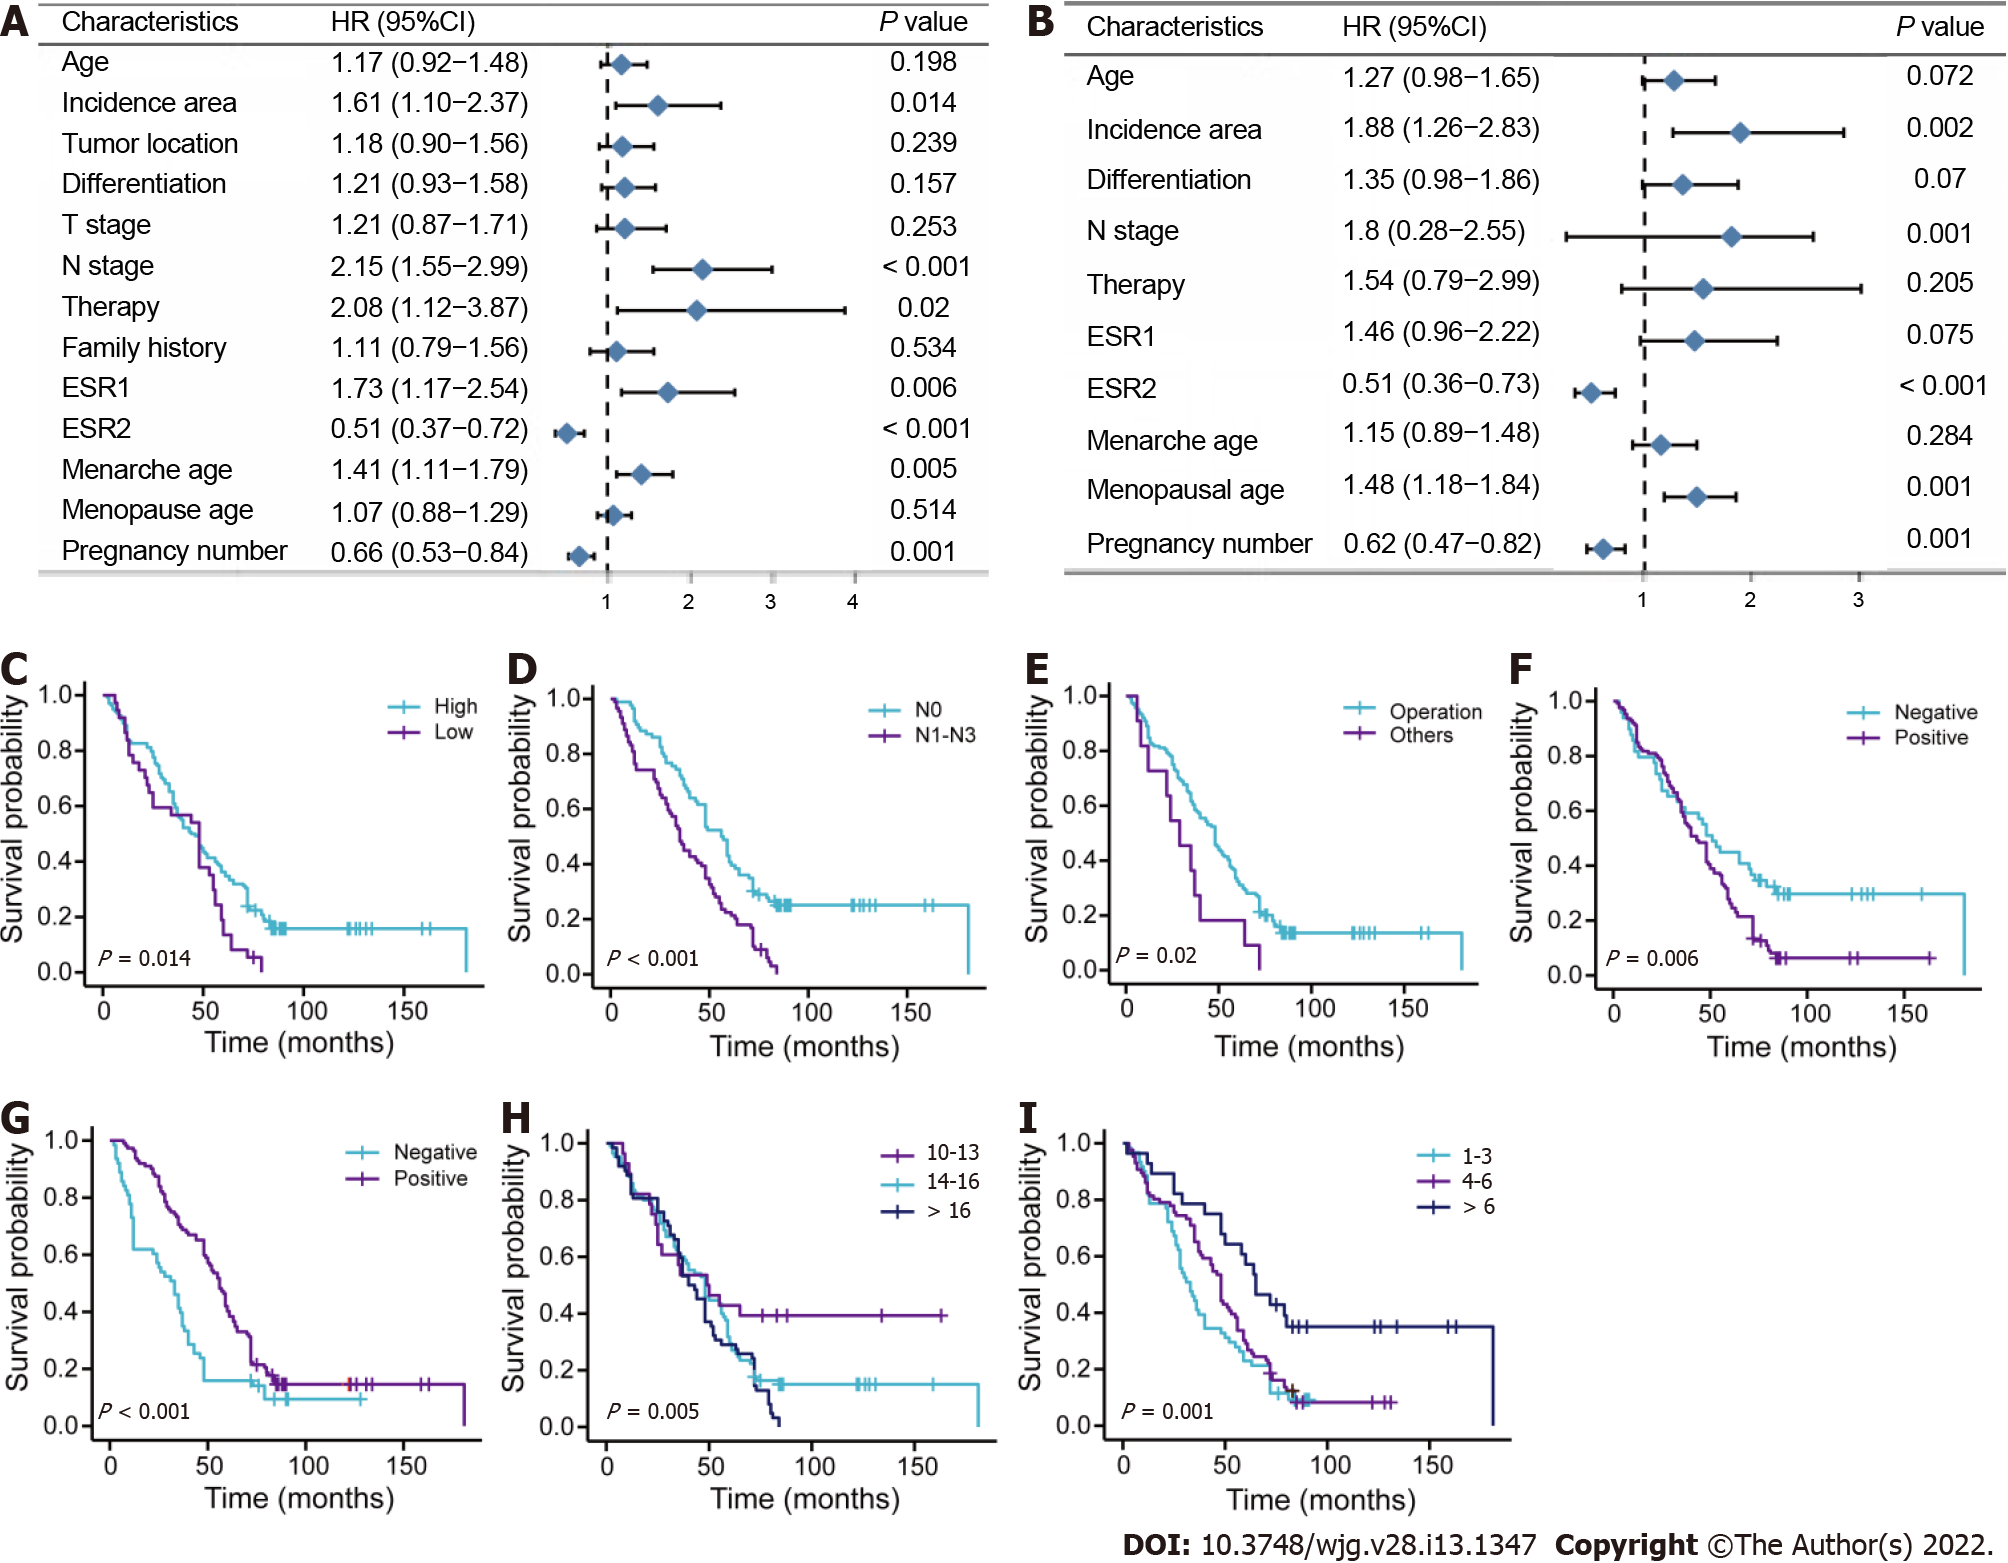
Figure 1 Survival analysis for female patients with esophageal squamous cell carcinoma in primary training cohort.
A: Univariate analysis; B: Multivariate analysis; C-I: Survival curves for patients with incidence area, lymph node metastasis, surgery methods, estrogen receptor alpha, estrogen receptor beta, menarche age, and pregnancy number, respectively. T: Tumor invasion depth; ESR1: Estrogen receptor alpha; ESR2: Estrogen receptor beta; N: Lymph node metastasis.
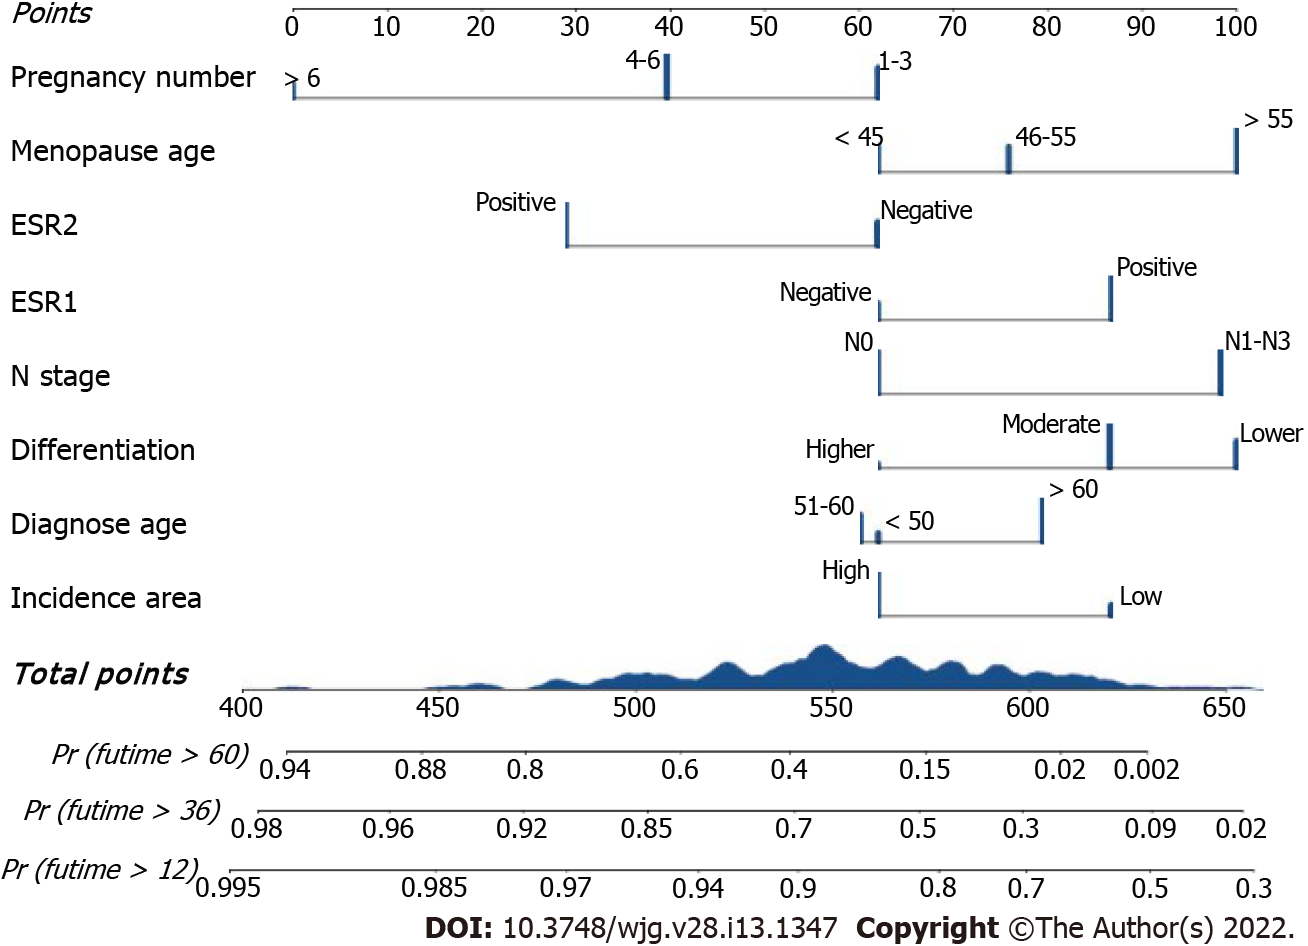
Figure 2 The Clinical-reproductive model for predicting 1-, 3-, and 5-yr overall survival probability in female patients with esophageal squamous cell carcinoma.
ESR1: Estrogen receptor alpha; ESR2: Estrogen receptor beta; N: Lymph node metastasis.
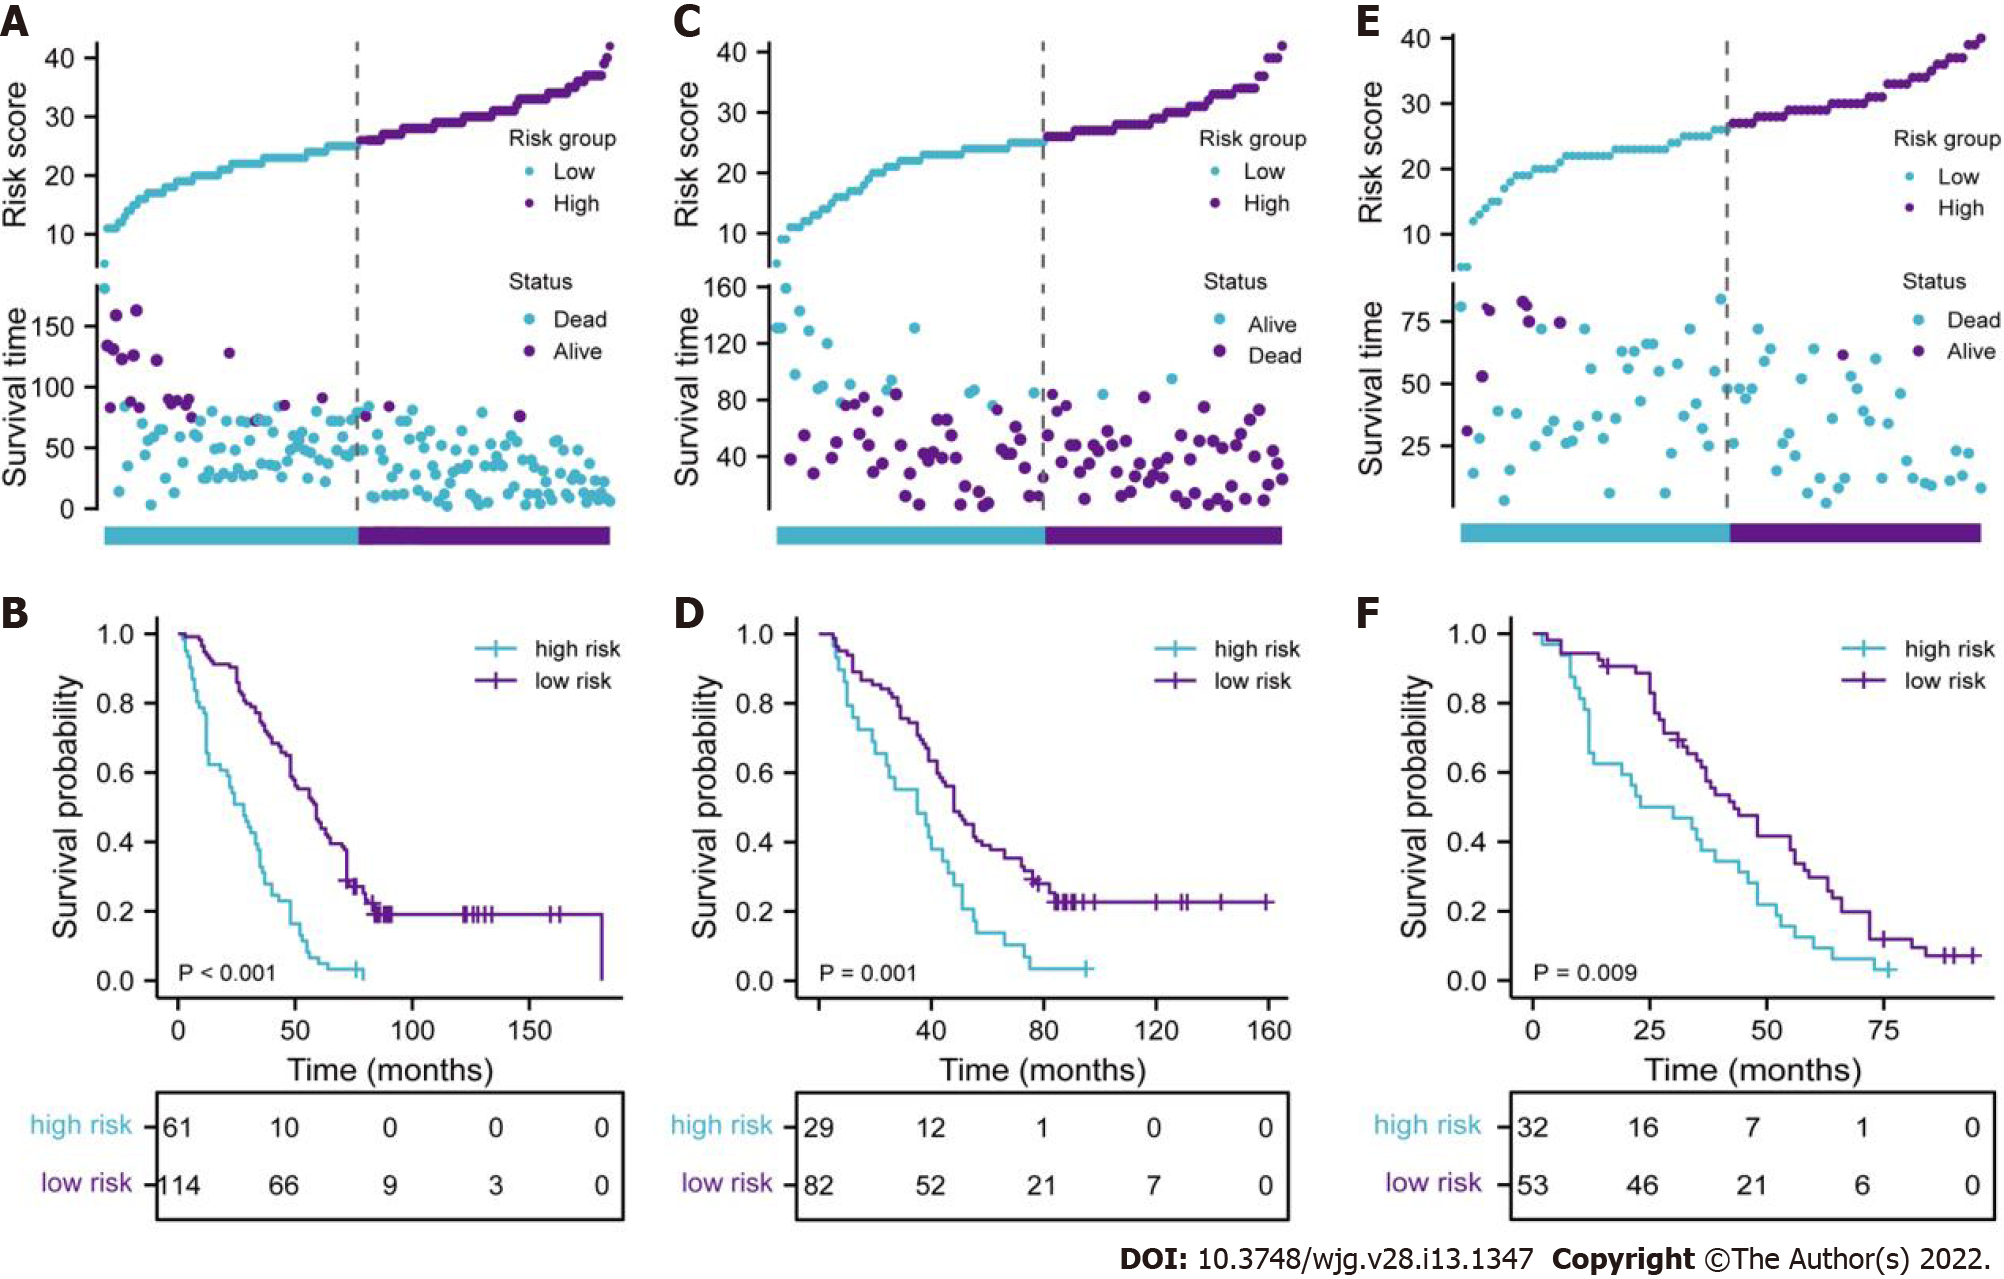
Figure 3 Evaluation of full model performance in the primary training set and confirmation based on both internal and external validation sets.
A, C, and E: Distribution of risk scores and survival status in primary training, internal and external validation sets, respectively; B, D, and F: Kaplan-Meier survival curves in primary training, internal and external validation sets, respectively.
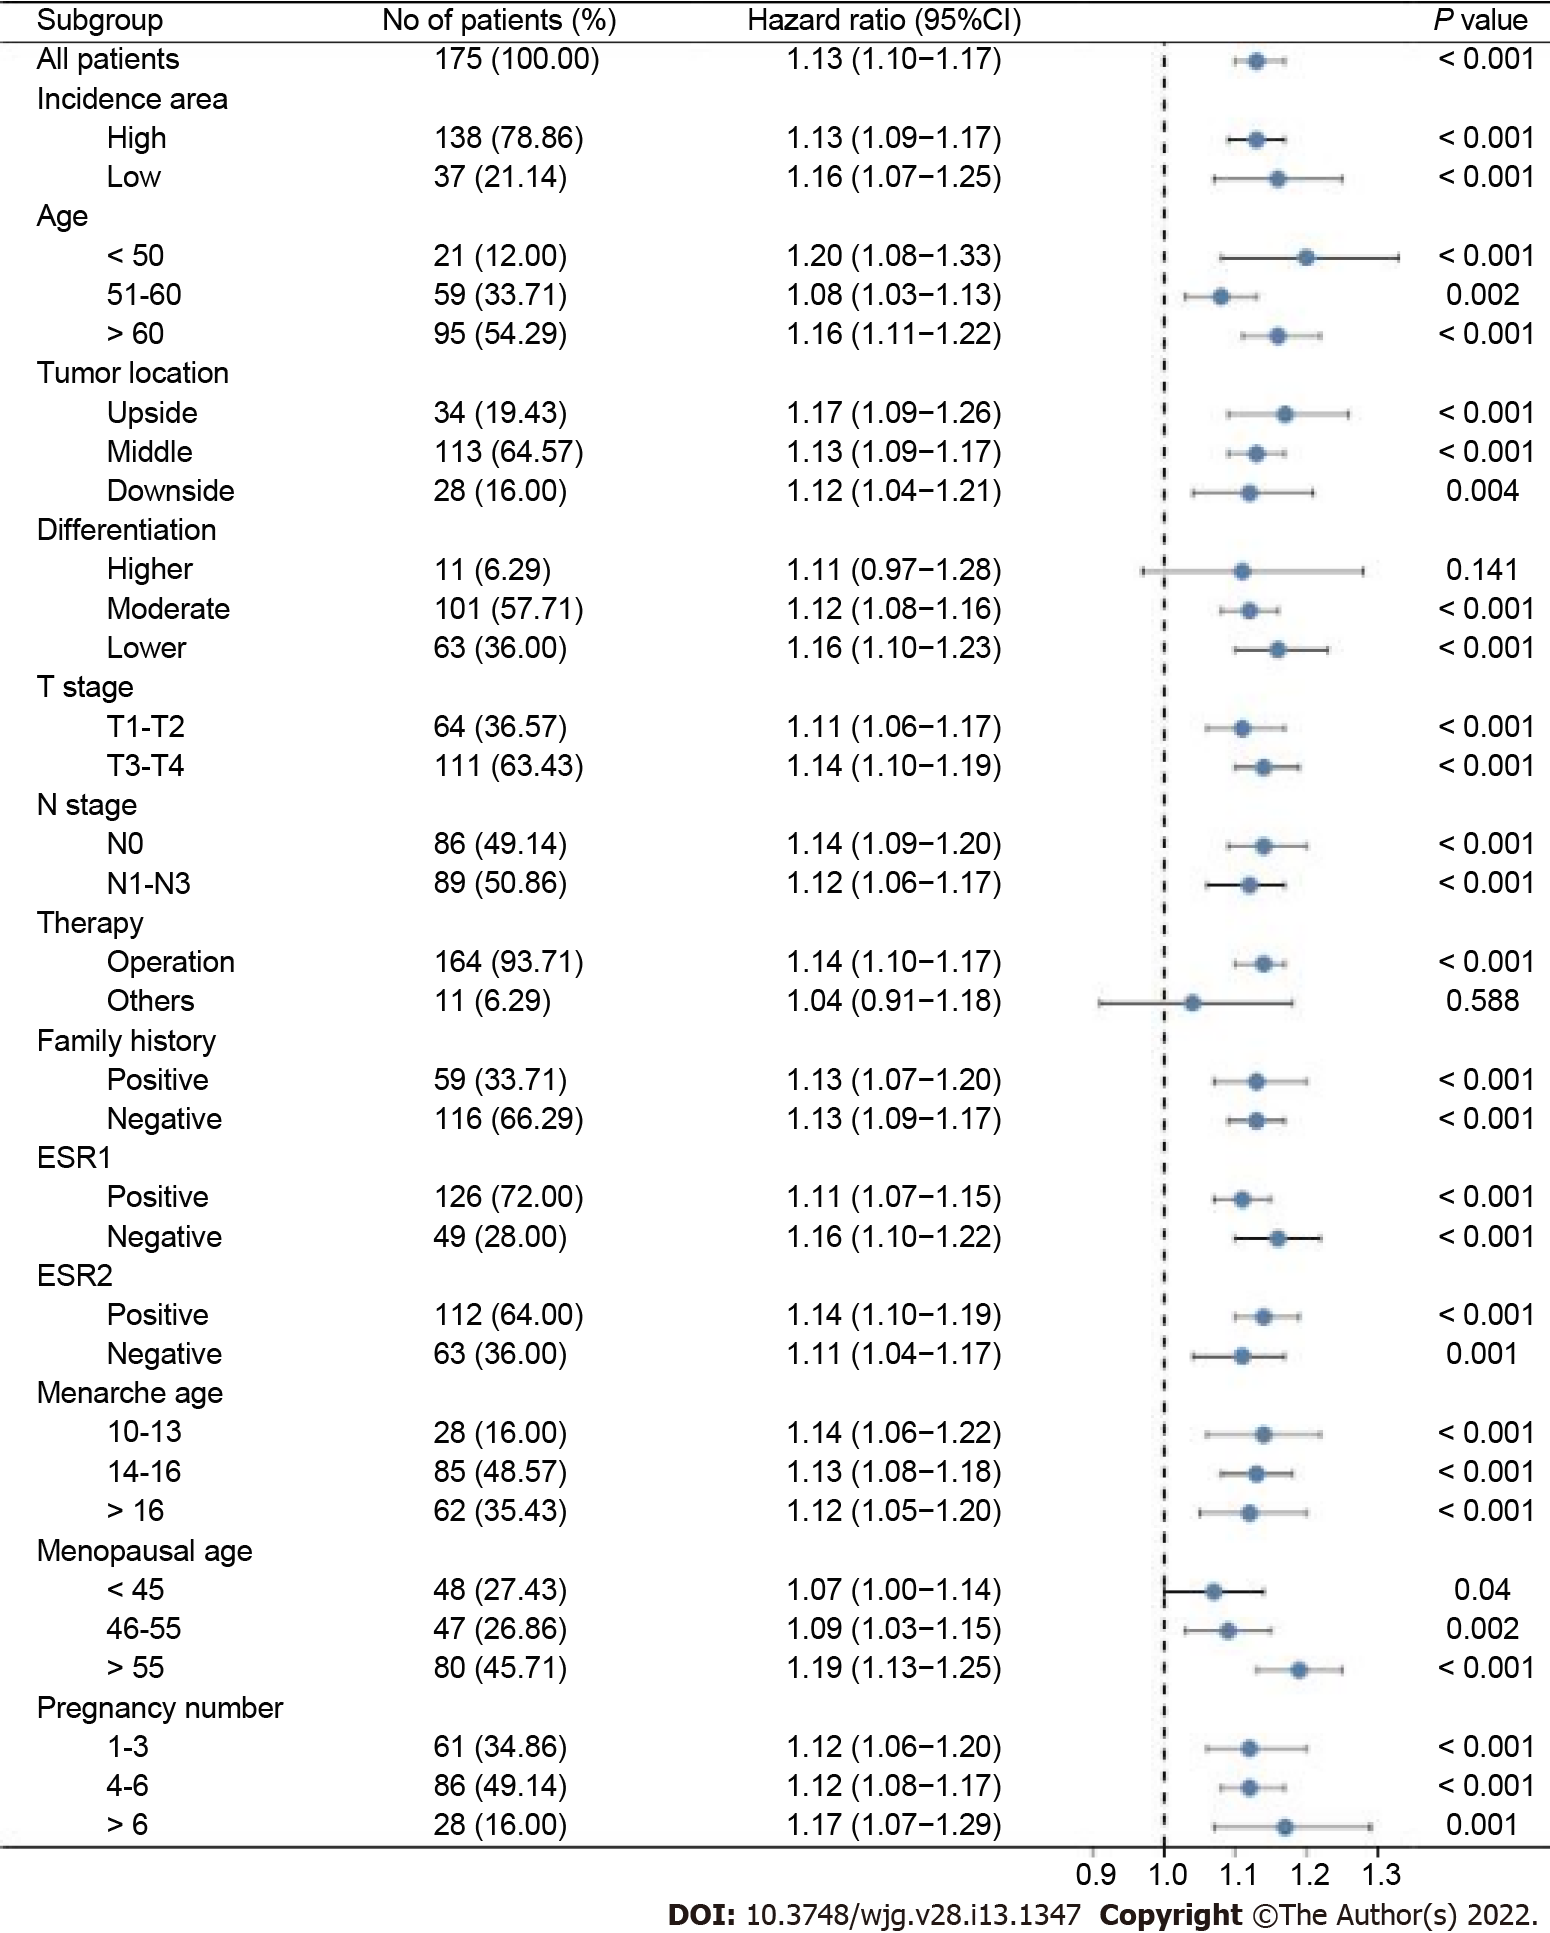
Figure 4 Stratified analysis of the clinical-reproductive model in different subgroups.
T: Tumor invasion depth, N: Lymph node metastasis; ESR1: Estrogen receptor alpha; ESR2: Estrogen receptor beta.
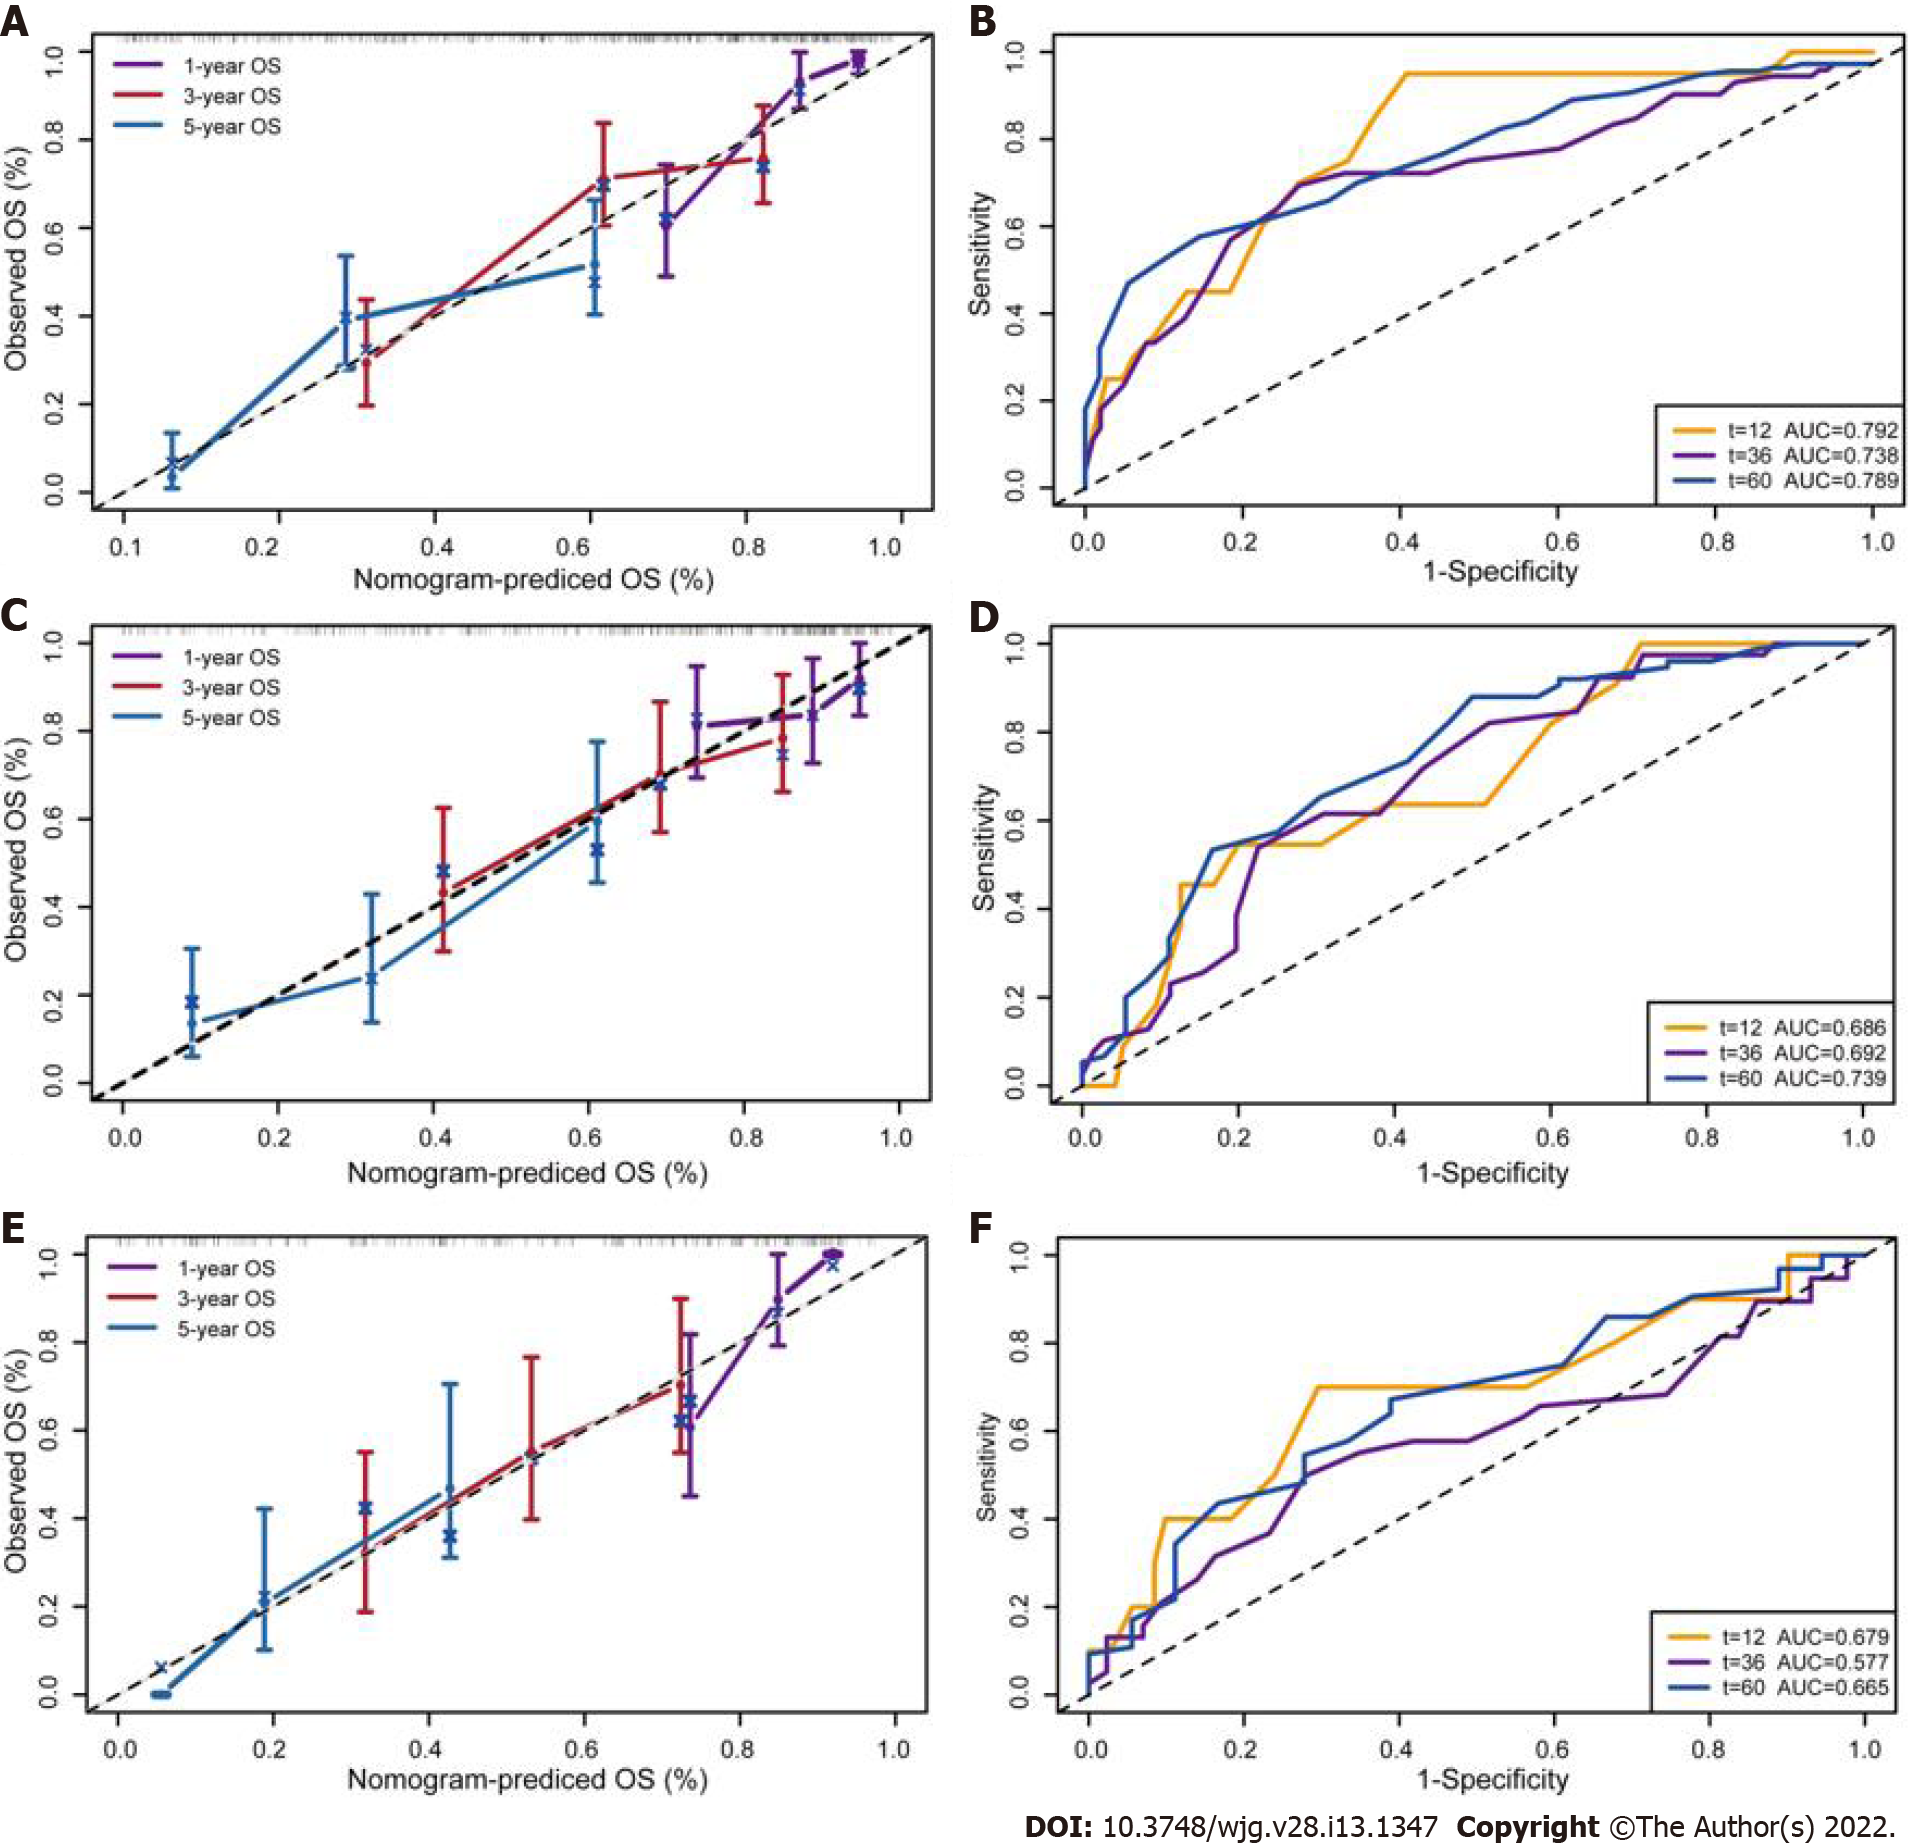
Figure 5 Calibration curves and time-dependent receiver operating characteristic curves for validation of clinical-reproductive model in the primary training, internal and external validation cohorts.
A and B: Calibration curves for predicting 1-, 3-, and 5-yr overall survival and time-dependent receiver operating characteristic (ROC) curves in primary training cohort; C and D: Calibration curves and time-dependent ROC curves in internal validation cohort; E and F: Calibration curves and time-dependent ROC curves in external validation cohort. OS: Overall survival.
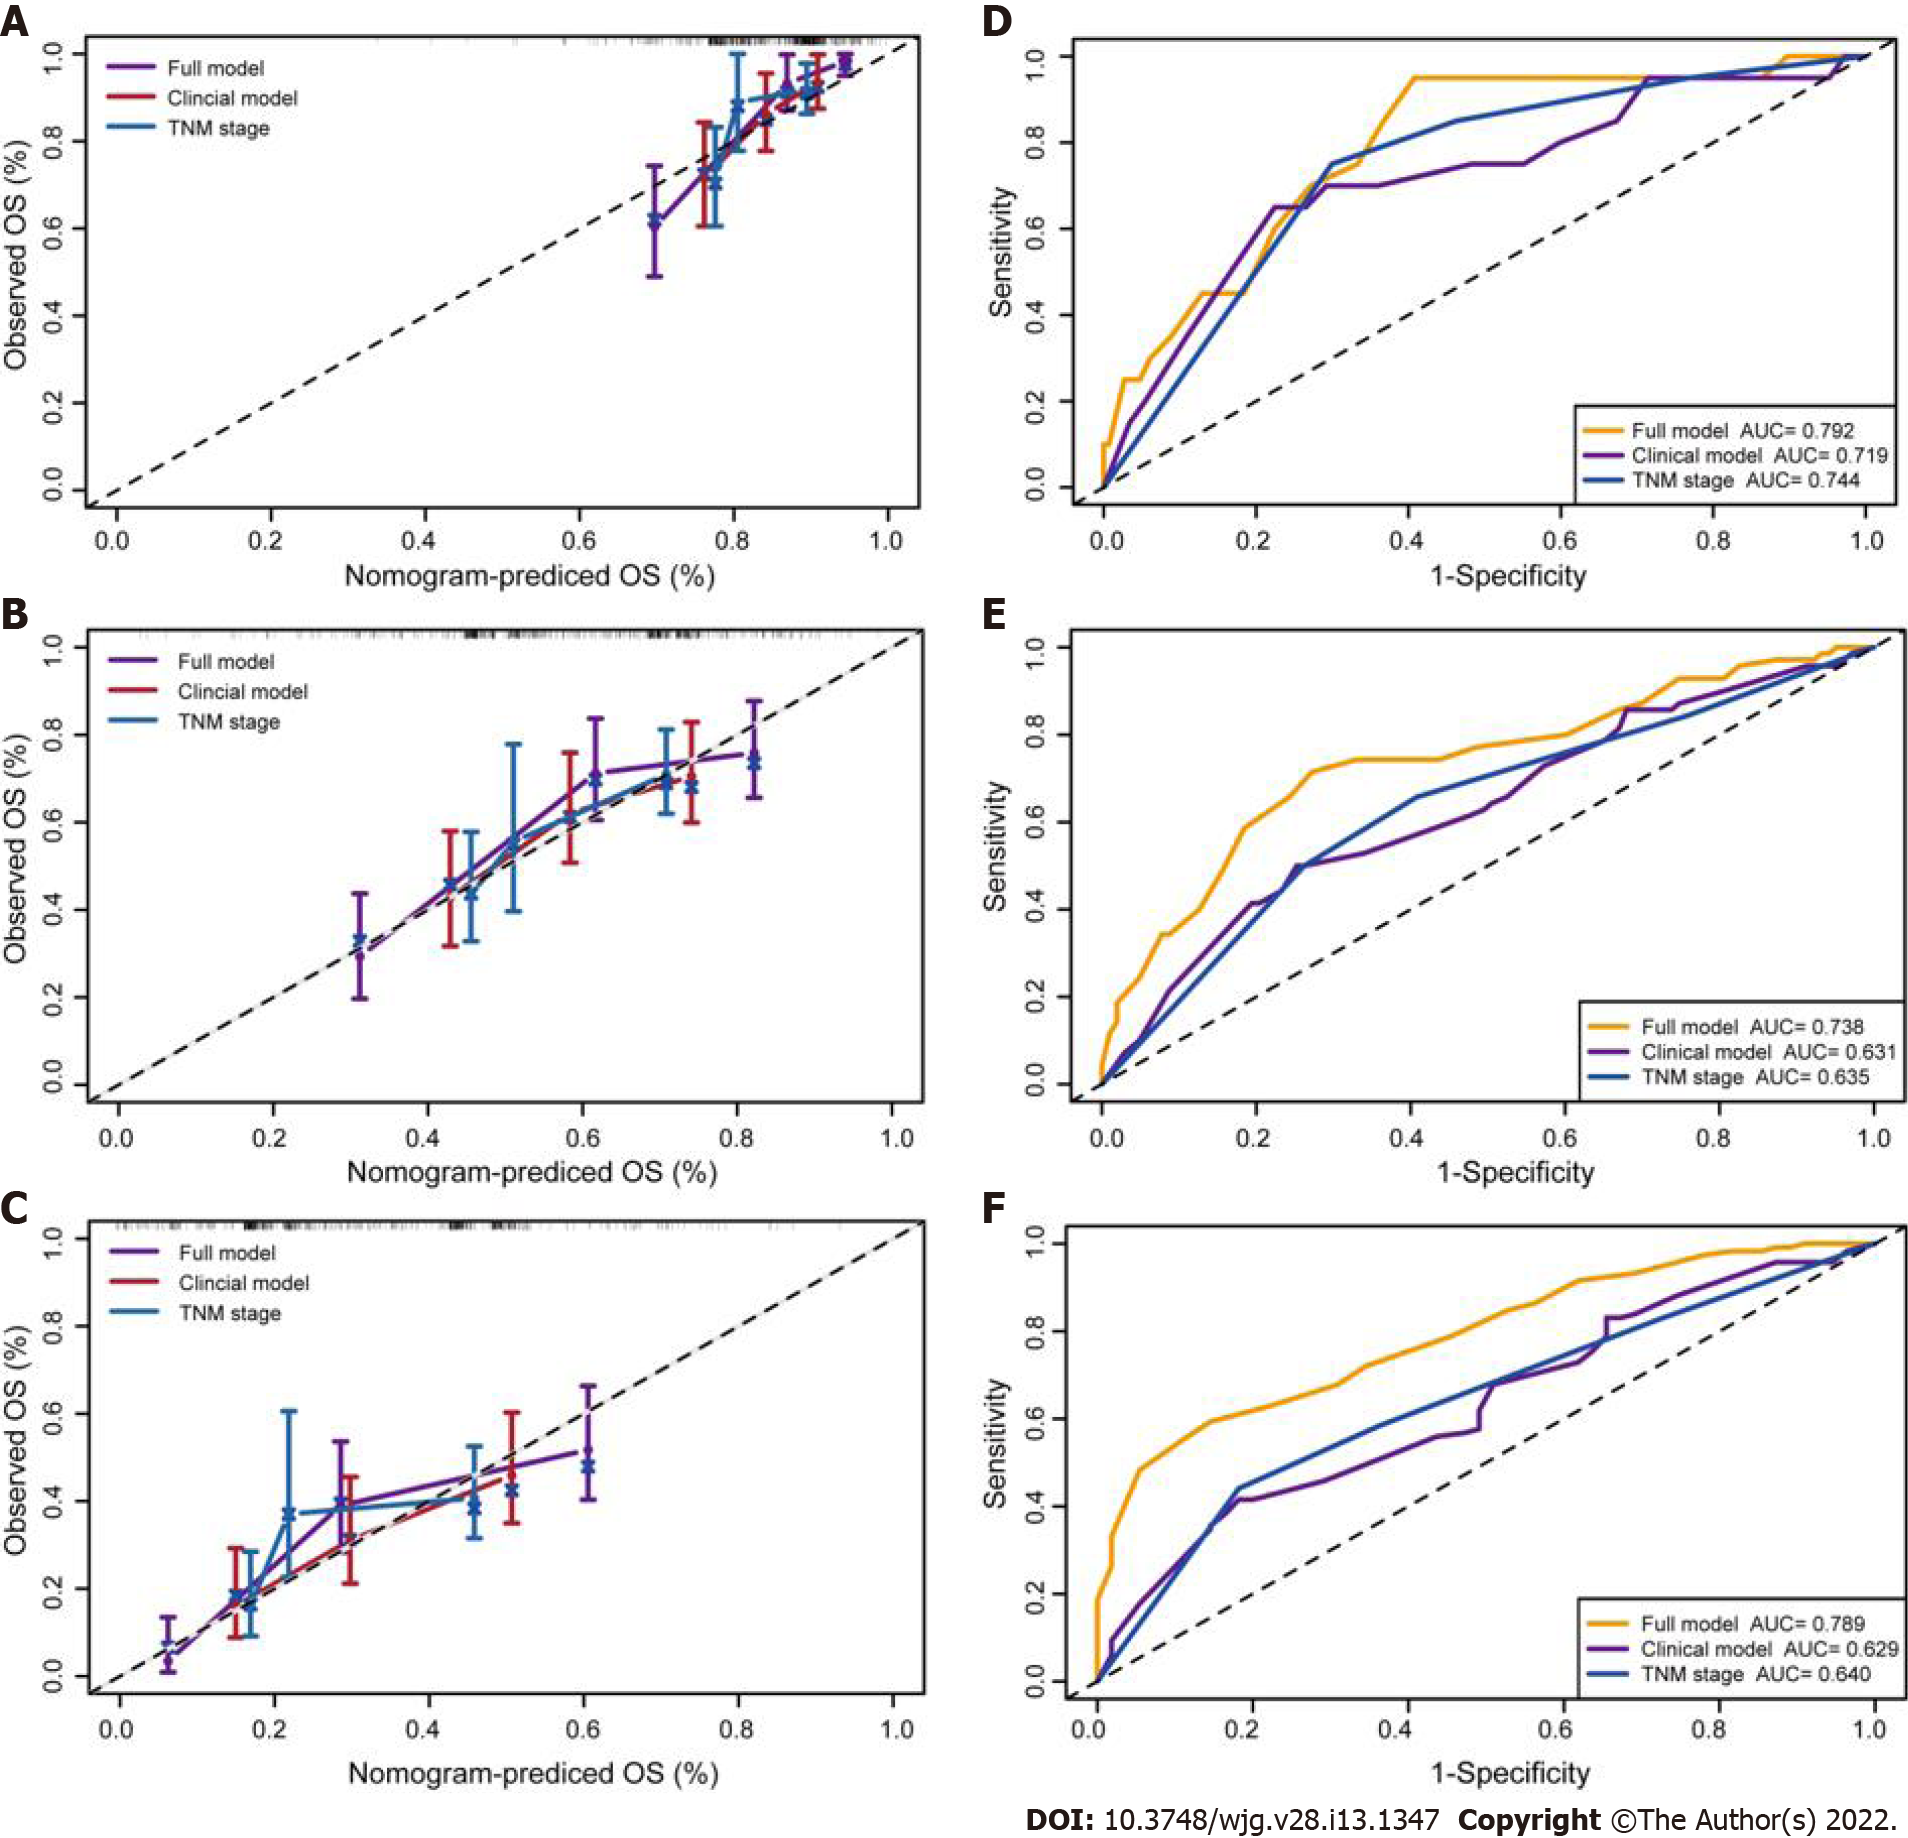
Figure 6 Calibration curves and time-dependent receiver operating characteristic curves of 1-, 3-, and 5-yr overall survival prediction for the full model, clinical model and tumor-node-metastasis stage in the primary training set.
A-C: Calibration curves for predicting 1-, 3-, and 5-yr overall survival (OS) in primary training set, respectively; D-F: Time-dependent receiver operating characteristic curves of 1-, 3-, and 5 yr OS prediction in primary training cohort, respectively. Full model: Pregnancy number + menopausal age + estrogen receptor alpha + estrogen receptor beta + N stage + differentiation + diagnose age + incidence area; Clinical model: N stage + differentiation + diagnose age + incidence area; TNM stage: Tumor-node-metastasis stage.
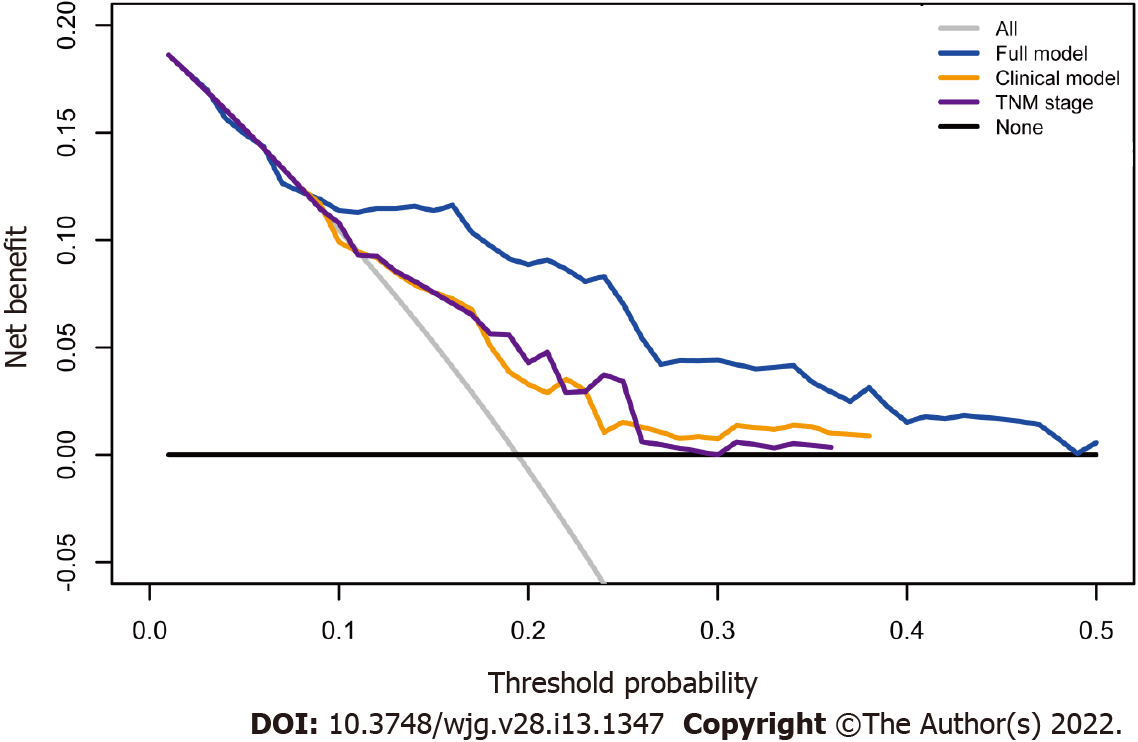
Figure 7 Decision curve analysis for full model, clinical model, and tumor node metastasis stage.
Black line: All patients were dead. Gray line: None of patients was dead. Full model: Pregnancy number + menopausal age + estrogen receptor alpha + estrogen receptor beta + N stage + differentiation + diagnose age + incidence area; Clinical model: N stage + differentiation + diagnose age+ incidence area; TNM stage: Tumor-node-metastasis stage.
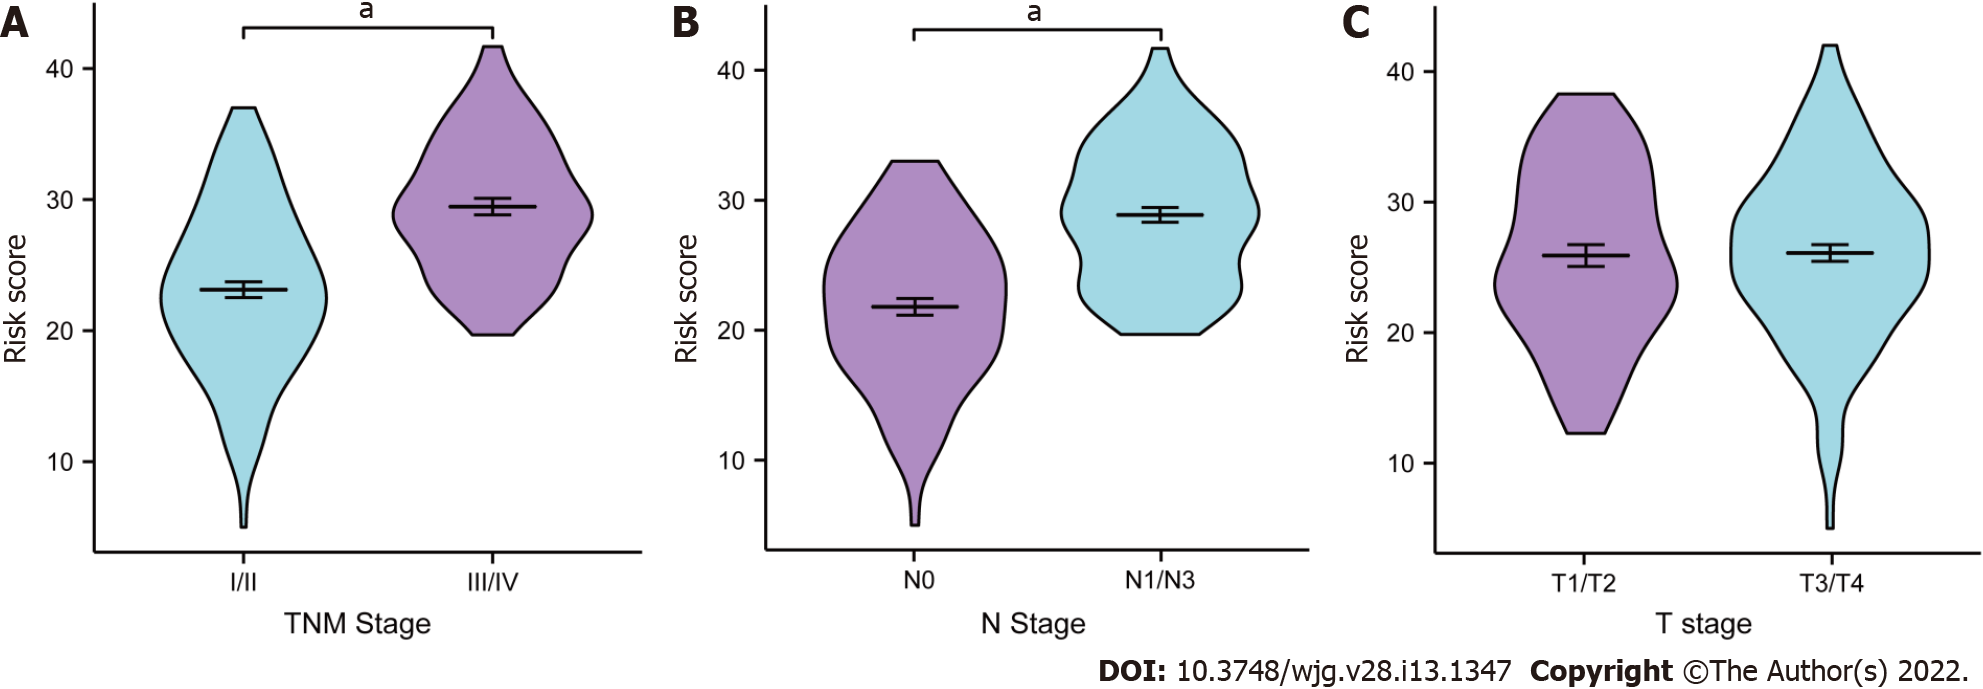
Figure 8 Clinical relevance of full model.
Distribution of the risk score based on different tumor-node-metastasis (TNM) stage, lymph node metastasis (N) stage, and tumor invasion depth (T) stage in the primary training cohort. A: TNM stage; B: N stage; C: T stage. aP < 0.001. T: Tumor invasion depth, N: Lymph node metastasis; TNM stage: Tumor-node-metastasis stage.
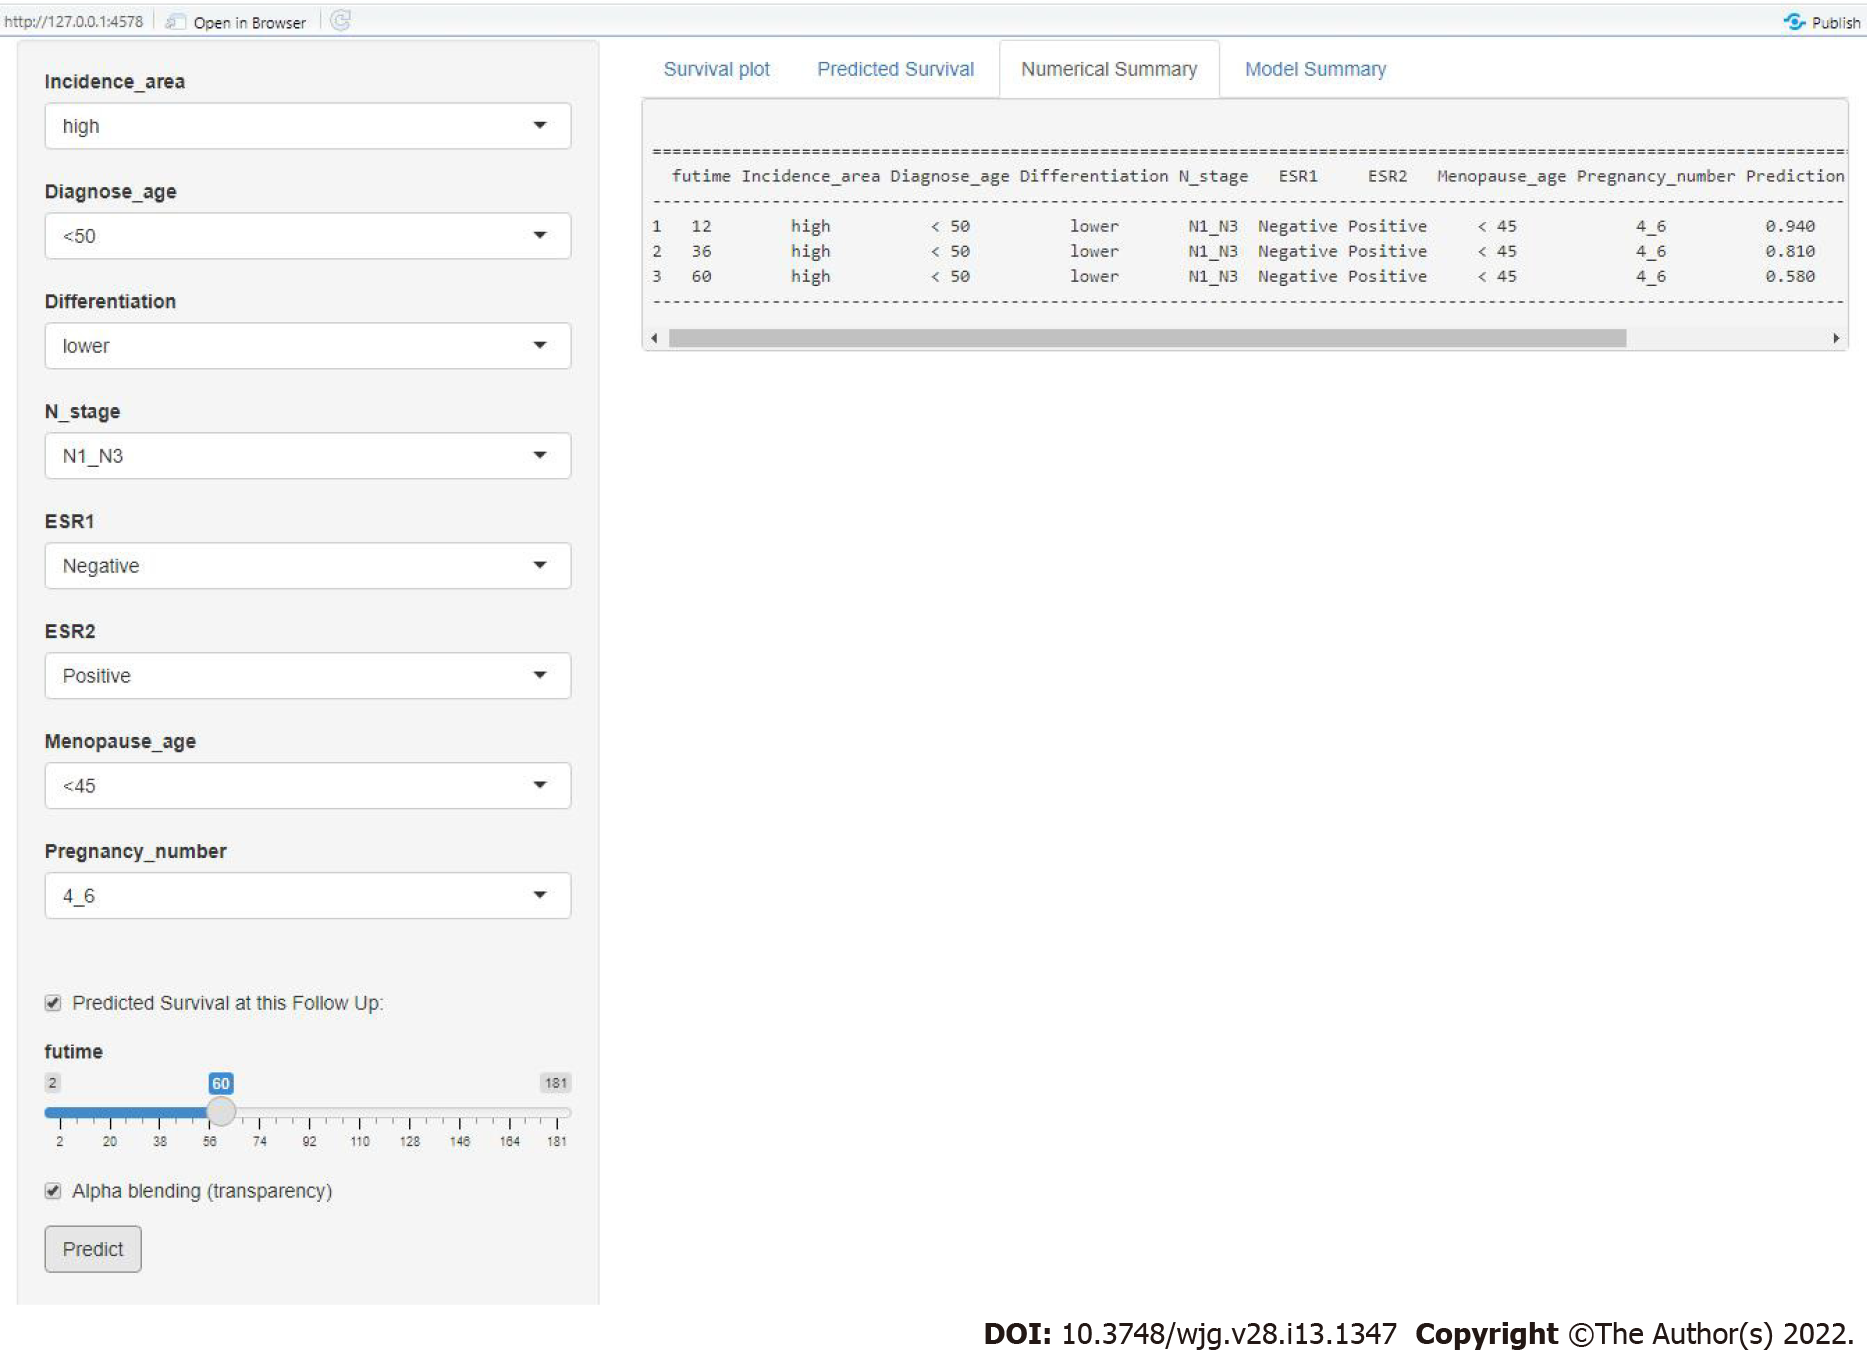
Figure 9 Screenshot from the web-based nomogram for predicting 1-, 3-, and 5-yr overall survival for female patients with esophageal squamous cell carcinoma.
N: Lymph node metastasis; ESR1: Estrogen receptor alpha; ESR2: Estrogen receptor beta.
- Citation: Zhang DY, Ku JW, Zhao XK, Zhang HY, Song X, Wu HF, Fan ZM, Xu RH, You D, Wang R, Zhou RX, Wang LD. Increased prognostic value of clinical–reproductive model in Chinese female patients with esophageal squamous cell carcinoma. World J Gastroenterol 2022; 28(13): 1347-1361
- URL: https://www.wjgnet.com/1007-9327/full/v28/i13/1347.htm
- DOI: https://dx.doi.org/10.3748/wjg.v28.i13.1347


