Copyright
©The Author(s) 2022.
World J Gastroenterol. Mar 14, 2022; 28(10): 1024-1054
Published online Mar 14, 2022. doi: 10.3748/wjg.v28.i10.1024
Published online Mar 14, 2022. doi: 10.3748/wjg.v28.i10.1024
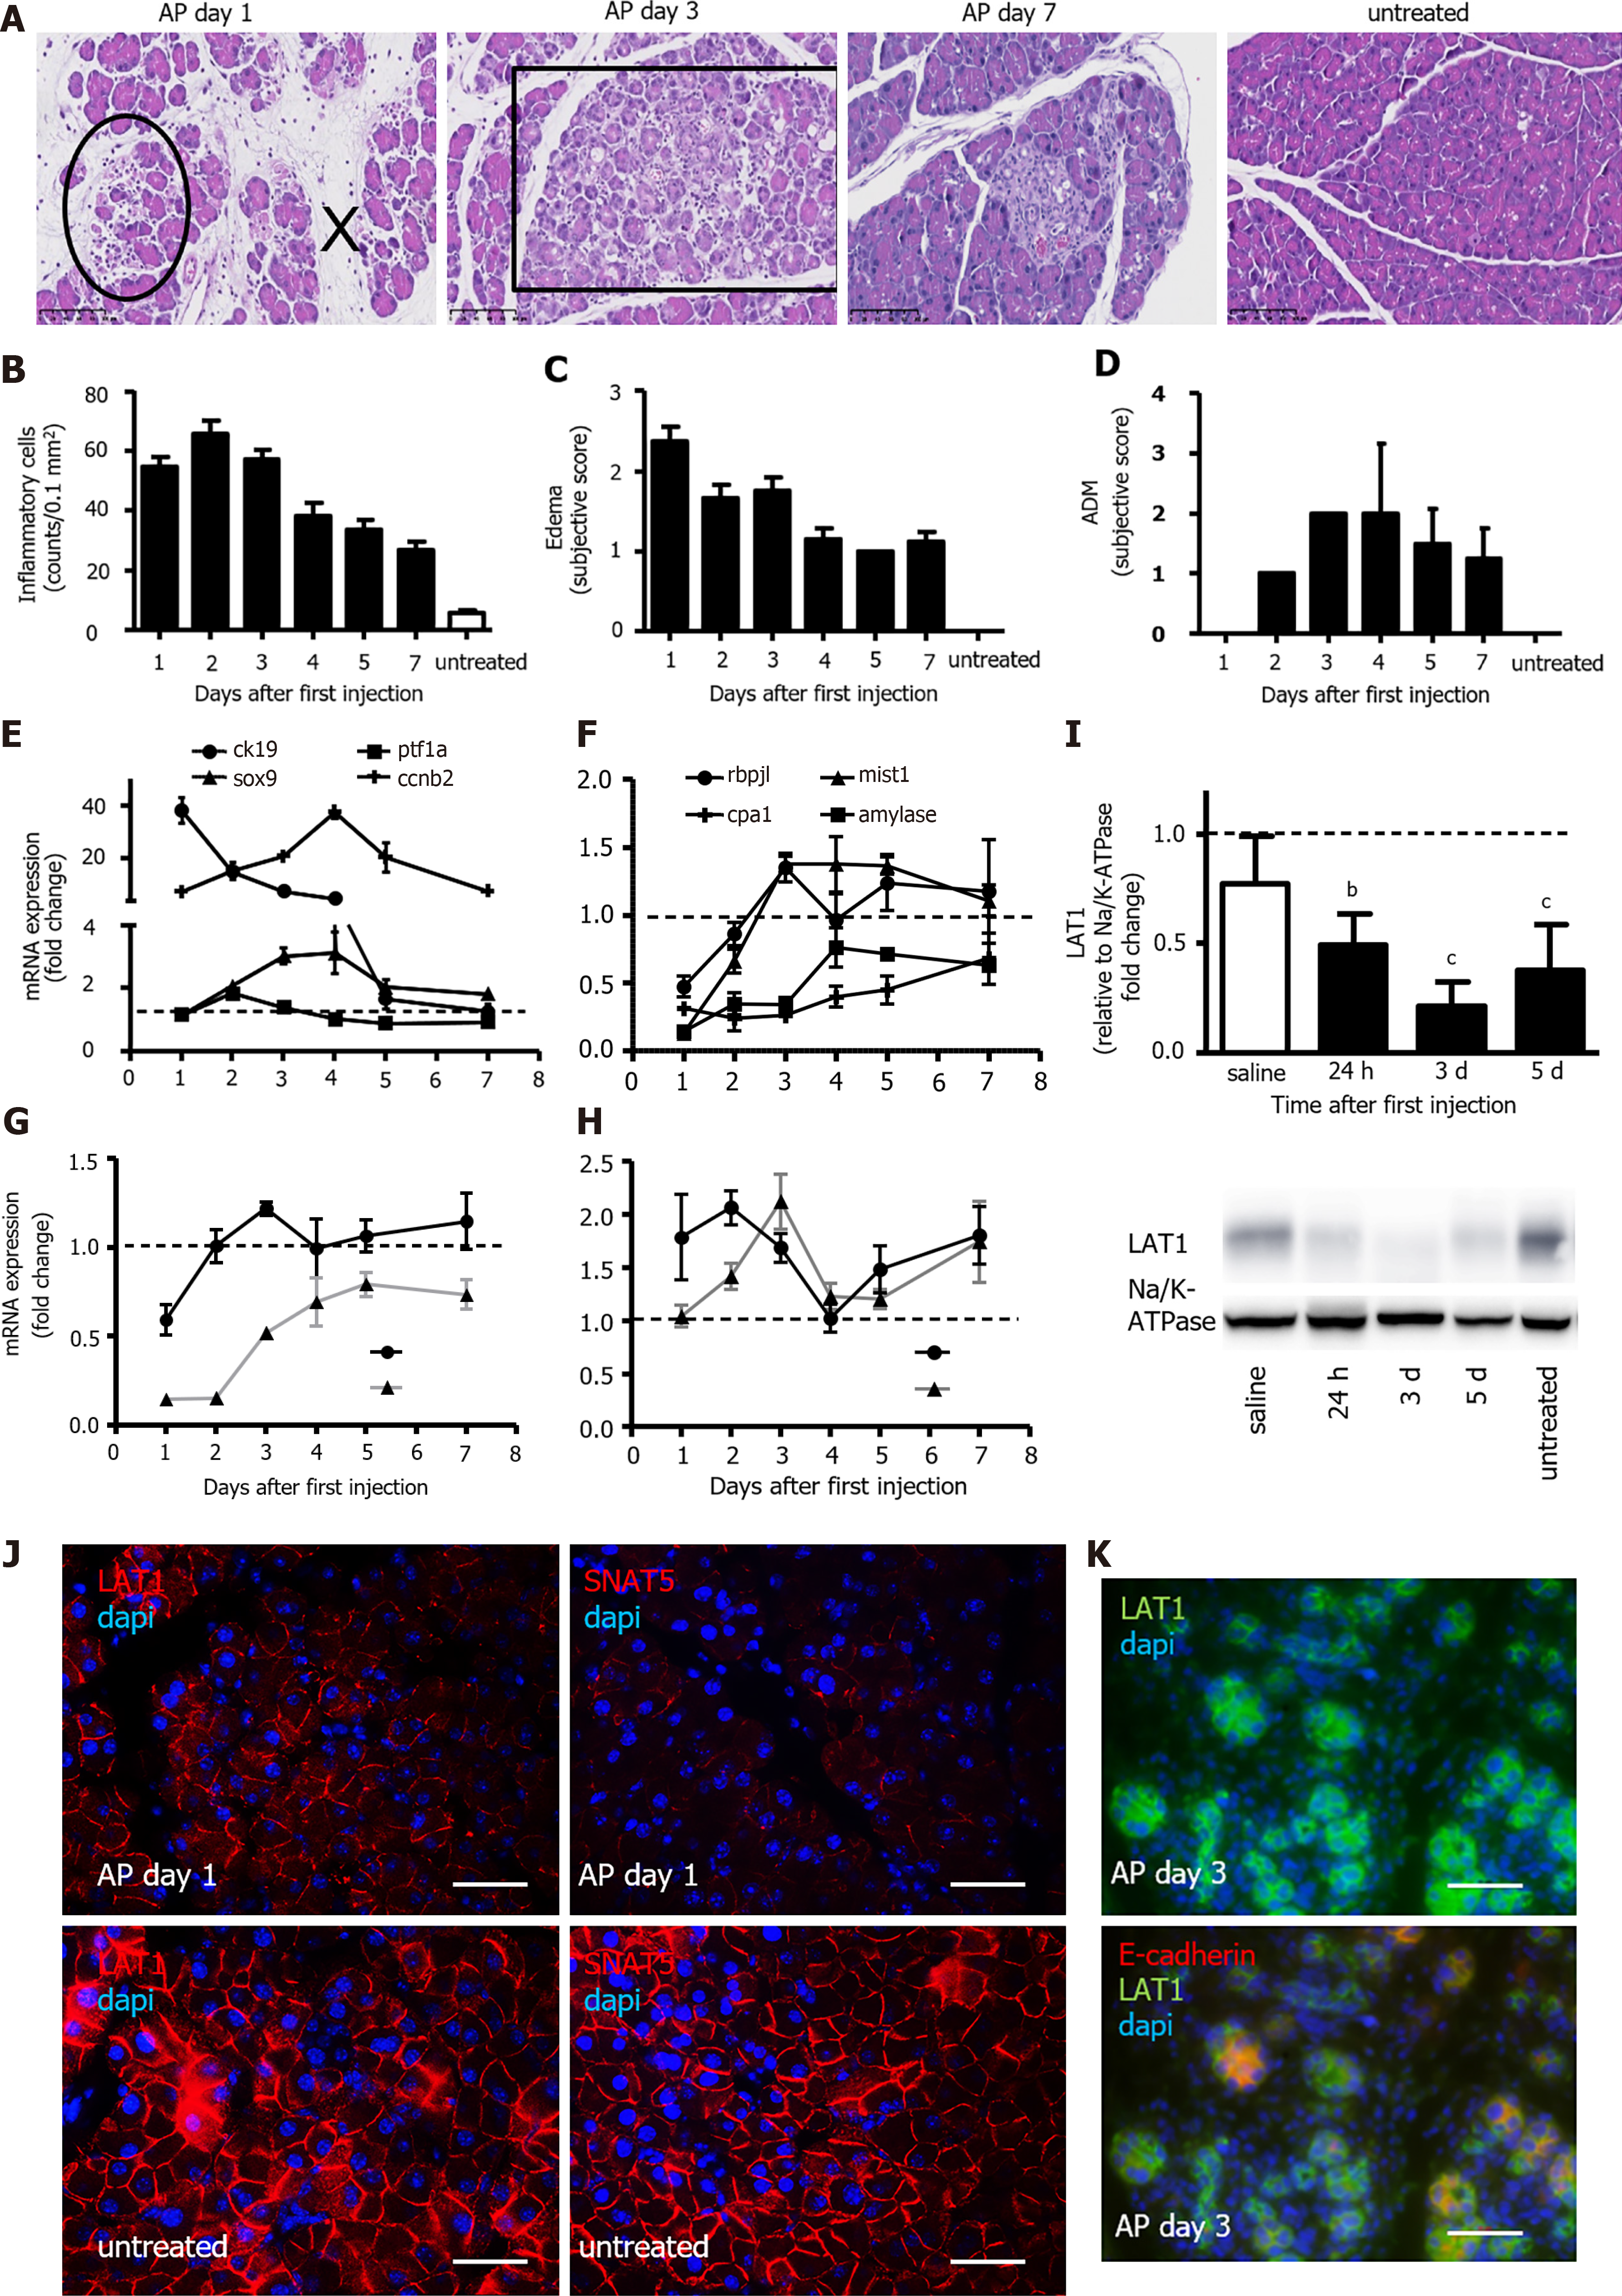
Figure 1 During recovery from acute pancreatitis, the expression of the amino acid transporter LAT1 was changed in a different way alongside dedifferentiation and the appearance of maturity markers for acinar cells.
A-D: Morphological analysis of the pancreas after the induction of acute pancreatitis (AP). A: HE stain depicting changes during the observed time period. Circle: inflammatory cells, x: edema, square: acinar-to-ductal metaplasia (ADM); B: Quantification of inflammatory cells as counts per 0.1 mm2 field; C: Edema; D: ADM score from 0 to 3; E-F: Variation of dedifferentiation and maturity markers over seven days; mRNA expression for genes of E: dedifferentiation (ck19, SRY-box transcription factor 9 (sox9), pancreas associated transcription factor 1a (ptf1a)) and proliferation (cyclin b2 (ccnb2)) as well as F: organ-specific maturity (recombining binding protein suppressor of hairless-like protein (rbpjl), basic helix-loop-helix family member A15 (mist1), amylase, and carboxypeptidase 1 (cpa1)) in pancreas was analyzed via qPCR and expressed as a fold change that was compared to untreated controls, n = 4. The line indicates the expression level found in the control animals; G-H: Variations of amino acid transporter (AAT) gene expression alongside injury and regeneration. mRNA expression of G: SNAT3 (slc38a3) and SNAT5 (slc38a5) and H: LAT1 (slc7a5) and LAT2 (slc7a8) was examined via qPCR and expressed as a fold change that was compared to untreated controls (n = 4). The line indicates the expression level found in the control animals; I-K: LAT1 expression decreased but did not disappear during injury and regeneration; I: LAT1 protein was analyzed with Western blotting (10% SDS-PAGE gel and membrane fraction of cell lysates), and it showed a band at approximately 39 kDa. The results were expressed relative to Na/K-ATPase and were normalized in line with untreated animals. The line represents the level in untreated animals. Mean ± SEM, n = 4. Statistical analysis was conducted with ANOVA and Bonferroni and then compared with the saline-injected negative control. aP < 0.05, bP < 0.01, cP < 0.001; J: LAT1 and SNAT5 were located at the basolateral membrane of acinar cells. The paraffin-embedded mouse pancreas was stained red for LAT1 or SNAT5, and the nuclei were stained in blue (4′,6-diamidino-2-phenylindole or DAPI). The panels on the left depict LAT1 24 h after AP induction (upper), and the untreated controls are below them. The panels on the right depict SNAT5 24 h after AP (upper) and the untreated controls are shown underneath. The bar length corresponds to 50 μm. K: LAT1 was present in dedifferentiated acinar cells, which were characterized by the absence of E-cadherin co-expression. The paraffin-embedded mouse pancreas was stained for LAT1 (green) and E-cadherin (red), and the nuclei were stained in blue (dapi). The top panel only depicts LAT1, while the bottom panel is overlayed with E-cadherin; in both instances, this is three days after AP induction. The bar length corresponds to 50 μm.
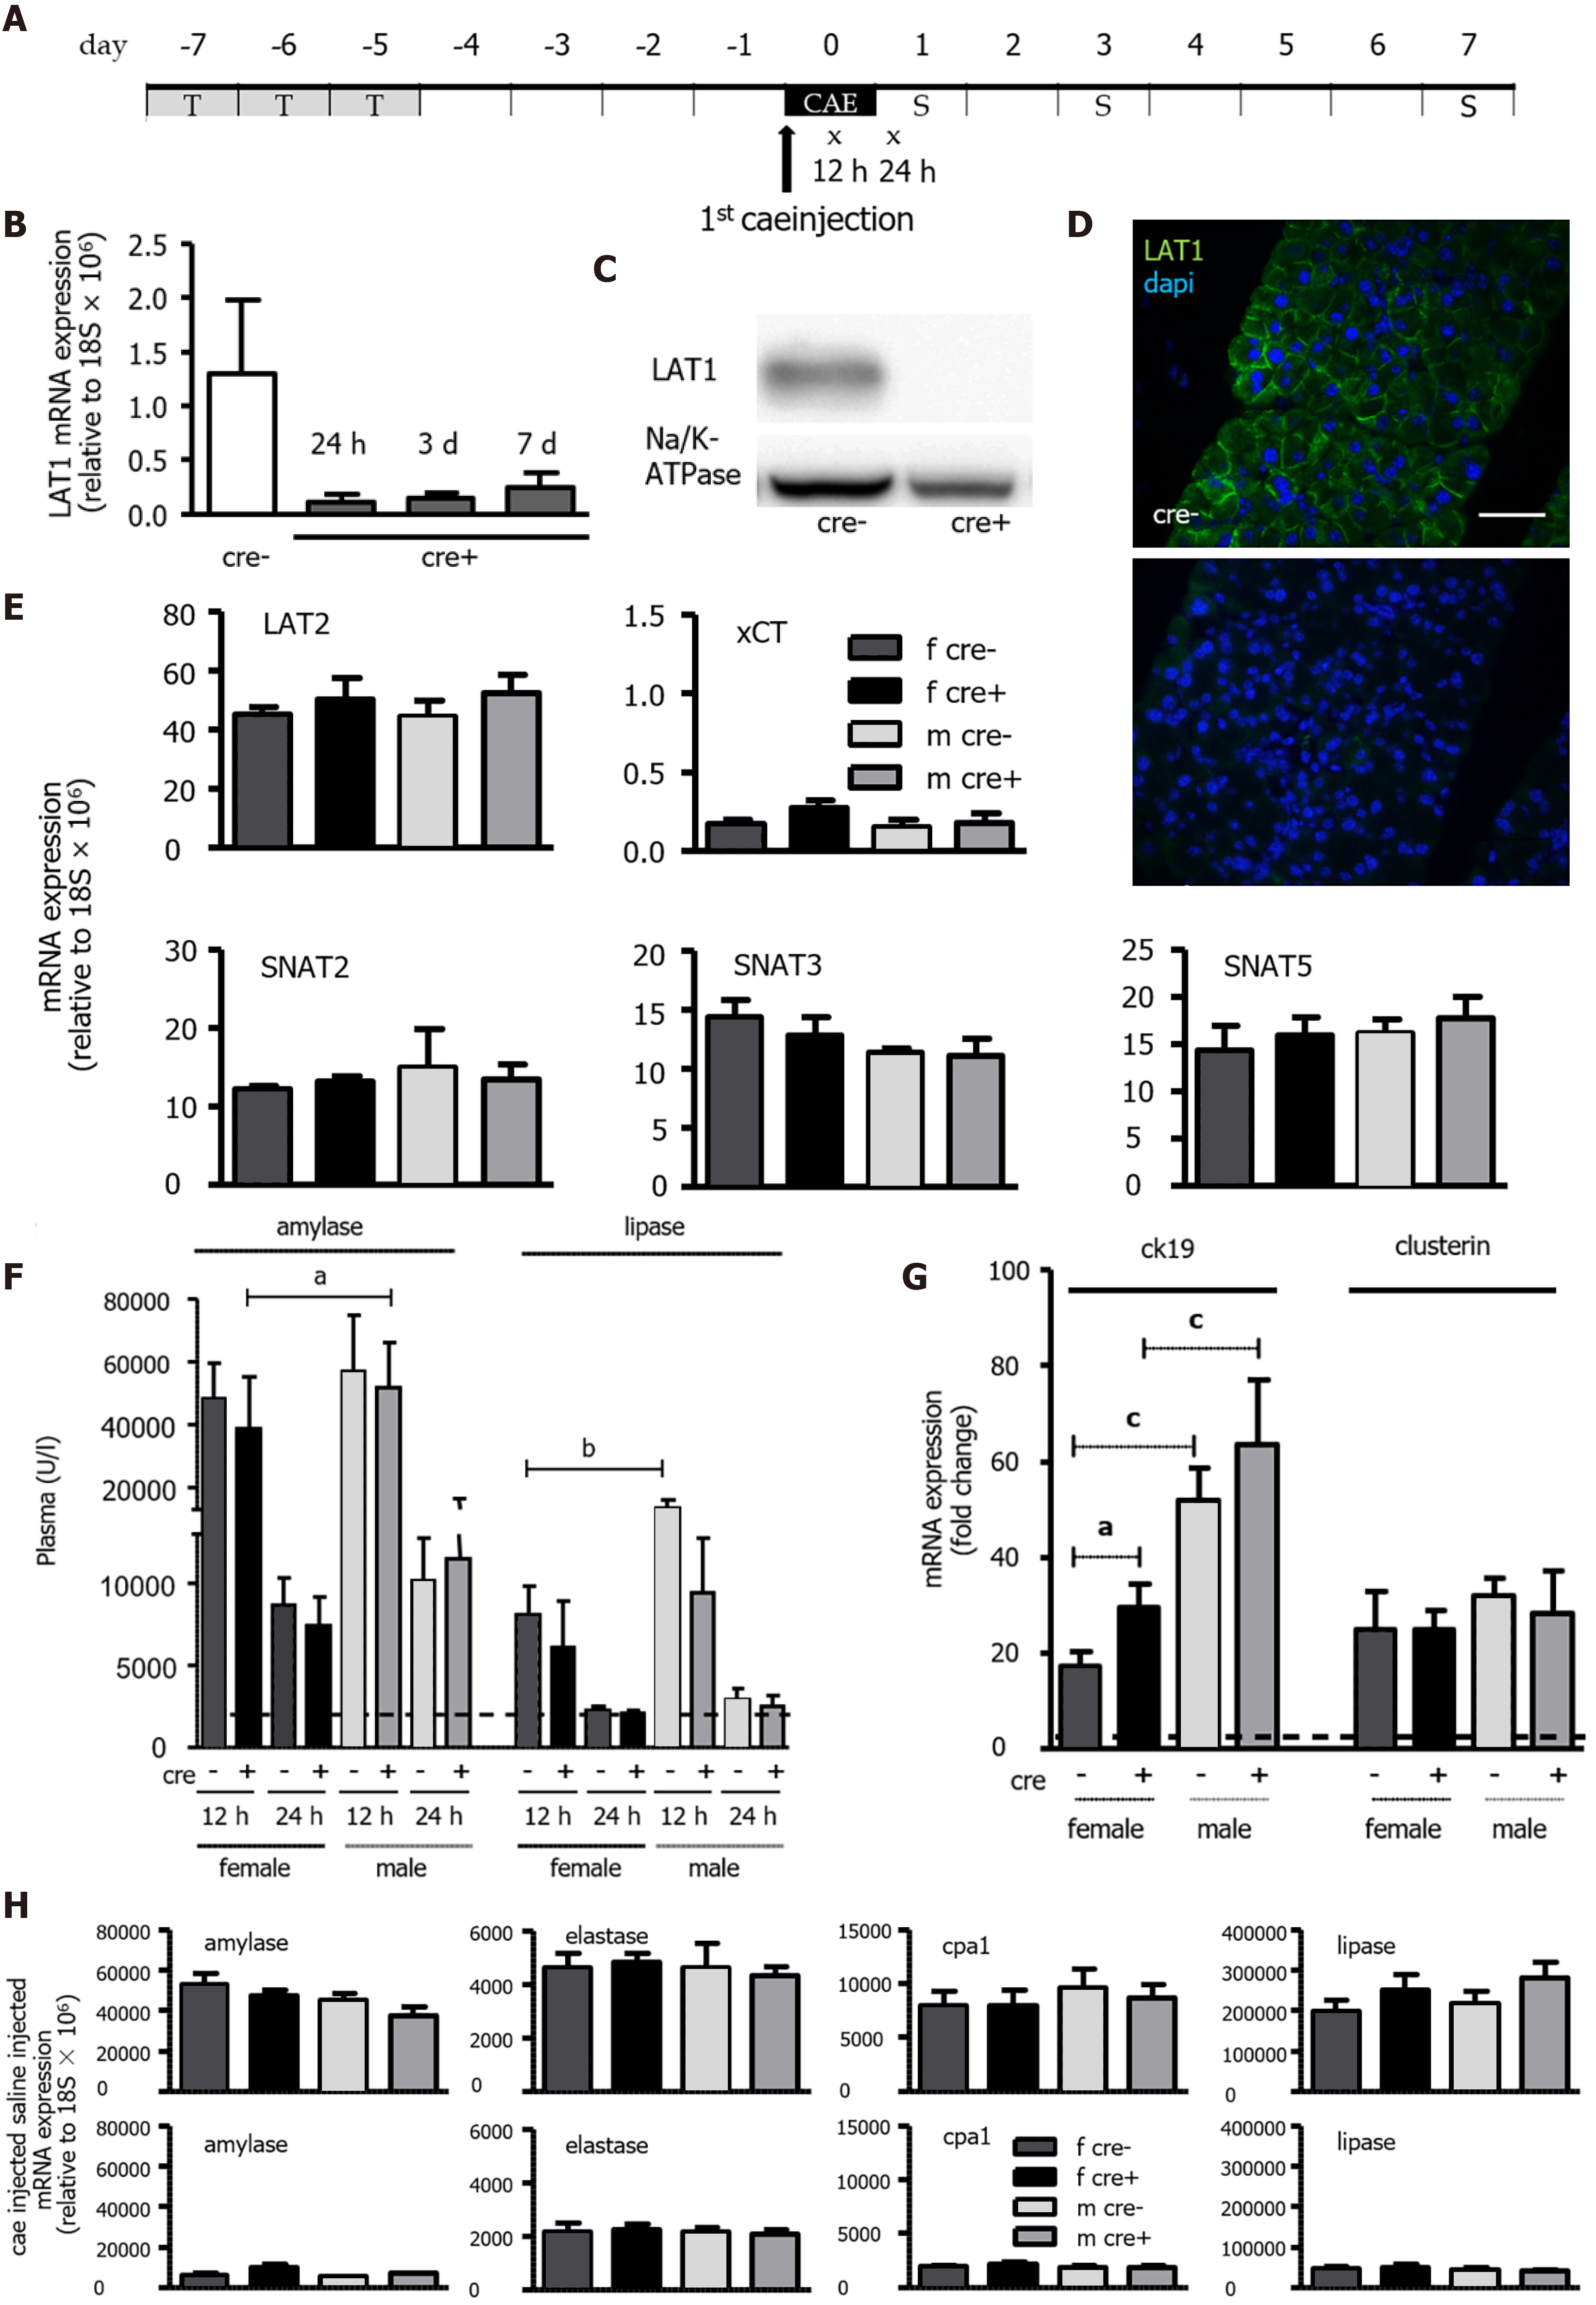
Figure 2 Tamoxifen-induced knockout of LAT1 was efficient in the pancreas, and the mice developed acute pancreatitis in an equivocal manner.
A: Experimental timeline. Three consecutive days of Tamoxifen gavage began seven days prior to acute pancreatitis (AP) induction by caerulein (cae). The first injection of cae marks day zero. Blood for amylase and lipase analysis was drawn 12 and 24 h afterwards (indicated with x). The mice were sacrificed on days one, three, and seven following the first cae injection (indicated with S); B-D: The knockout of LAT1 (slc7a5) at the mRNA and protein level was efficient during the period the experiments were conducted. B: mRNA expression for LAT1 was analyzed via qPCR and relative to a housekeeping gene (18S × 106) in LAT1-ko mice one, three and seven days after the onset of AP, and it was compared to the LAT1-wt mice. C: The LAT1 protein was analyzed with Western blotting (10% SDS-PAGE gel, membrane fraction of cell lysates) three days after the onset of AP, and it displayed a band at approximately 39 kDa. The results were expressed in a manner relative to Na/K-ATPase, and they were normalized in line with untreated animals; D: The paraffin-embedded mouse pancreas was stained for LAT1 (green), and the nuclei were stained in blue (dapi). The top panel depicts LAT1 in LAT1-wt mice, and the bottom is in relation to LAT1-ko mice. The bar length corresponds to 50 μm. E: Neither the knocking out of LAT1 nor the administration of tamoxifen treatment modified the expression of other amino acid transporters (AAT). The mRNA expression of LAT2 (slc7a8), xCT (slc7a11), SNAT2 (slc38a2), SNAT3 (slc38a3), and SNAT5 (slc38a5) was analyzed via qPCR relative to a housekeeping gene (18S × 106) in LAT1-wt and LAT1-ko mice treated with tamoxifen and saline. Mean ± SEM, n = 3-8; F: Plasma amylase and lipase increased in LAT1-wt and LAT1-ko mice after the onset of AP. The line indicates the plasma value when it is at a healthy level. Mean ± SEM, n = 7-25; G: LAT1-ko mice exhibited an enhanced presence of dedifferentiation markers. The mRNA expression of cytokeratin 19 (ck19) and clusterin was analyzed via qPCR and expressed as a fold change relative to saline-injected controls 24 h after the onset of AP. The line indicates the expression level of the control animals. Mean ± SEM, n = 5-7. H: mRNA expression of amylase, elastase, carboxypeptidase 1 (cpa1), and lipase was analyzed via qPCR relative to a housekeeping gene (18S × 106), and it was not modified by LAT1 knockout or tamoxifen treatment, yet it decreased after the onset of AP. The upper panel depicts the mice injected with saline, and the lower panel highlights the mice 24 h after AP induction. Mean ± SEM, n = 3-8. The statistical analysis was conducted by ANOVA and Bonferroni, and then it was compared, as indicated by the capped line. aP < 0.05, bP < 0.01, cP < 0.001.
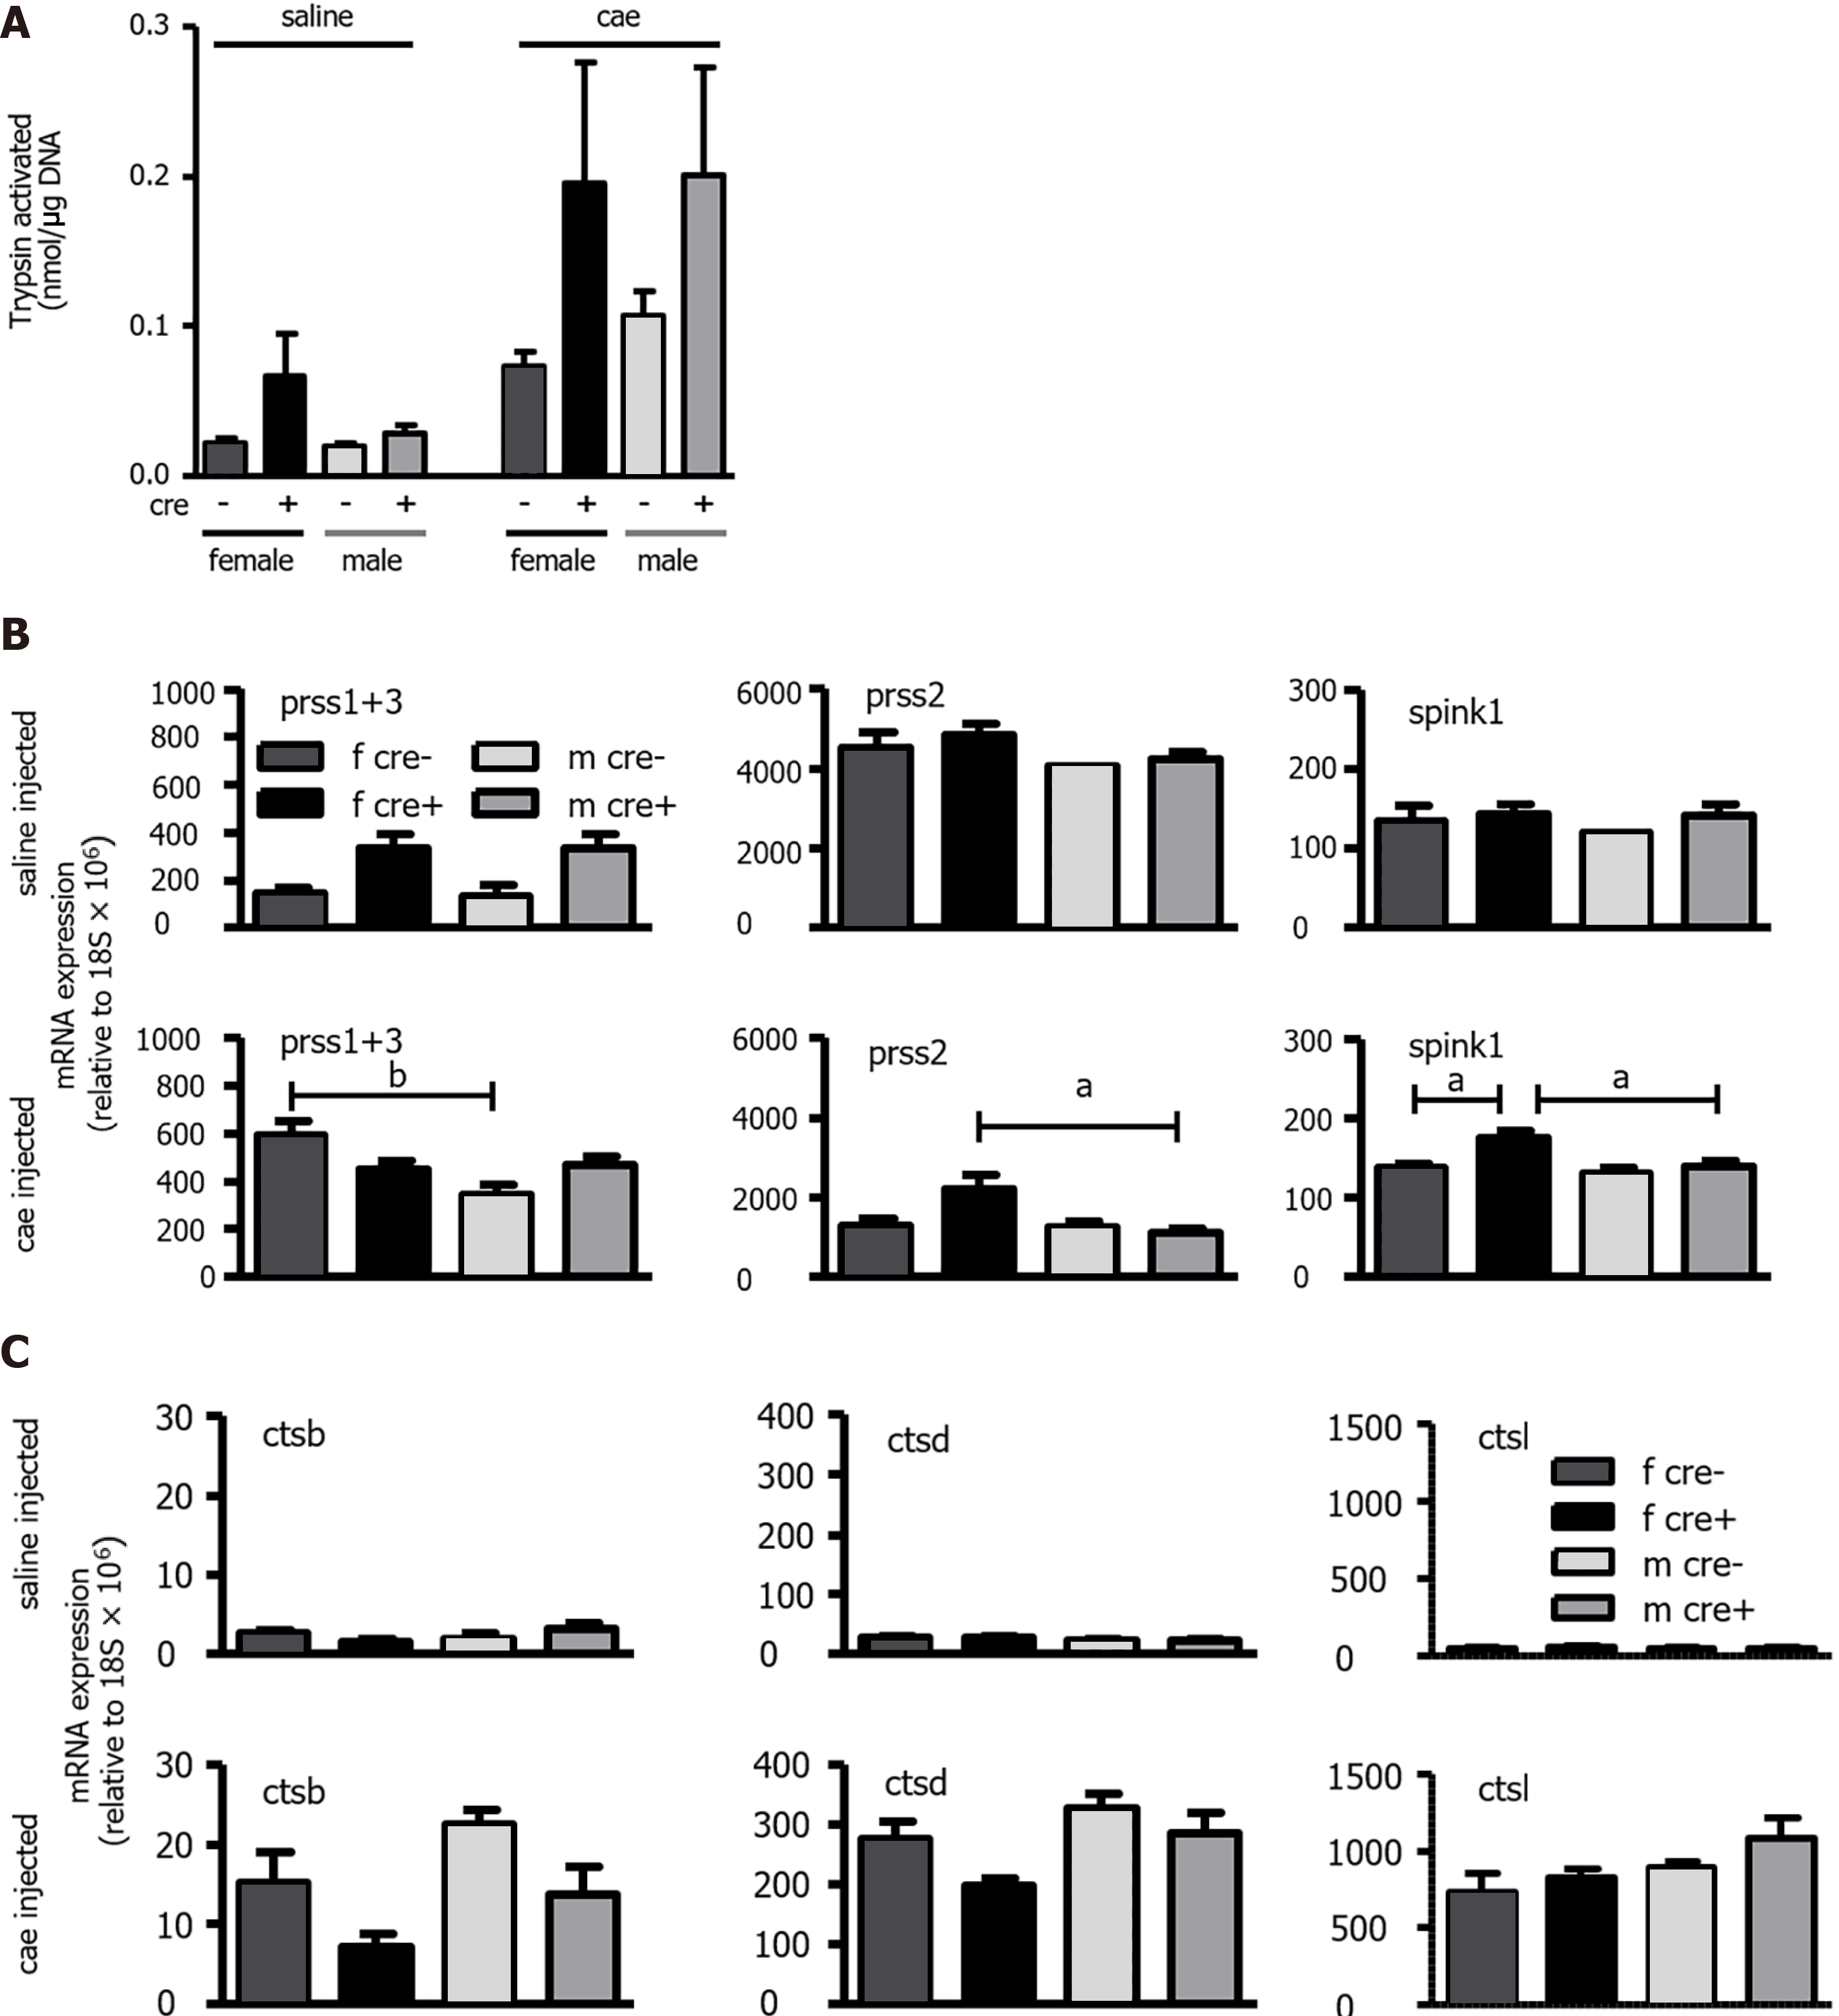
Figure 3 The trypsin activation observed in LAT1-ko mice had higher variability, and the expression of trypsinogens and cathepsins differed from LAT1-wt mice.
A: Trypsin activation was observed in LAT1-wt and LAT1-ko mice 24 h after acute pancreatitis (AP) induction. The activity was measured using Boc-Q-A-R-MCA and expressed as nmol/μg DNA. Mean ± SEM, n = 3-7; B-C: The mRNA expression of trypsinogens, trypsin inhibitor, and cathepsins. The mRNA expressions of serine protease 1+3 (prss1+3) and serine protease 2 (prss2) along with serine peptidase inhibitor kazal type 1 (spink1) (B) and cathepsin B, D, and L (ctsb, ctsd, and ctsl) (C) were analyzed via qPCR and expressed relative to a housekeeping gene (18S × 106) in LAT1-wt and LAT1-ko mice. The upper panel depicts the mice that were injected with saline, and the lower panel shows the mice 24 h after AP induction. Mean ± SEM, n = 7-14. Statistical analysis was conducted with ANOVA and Bonferroni and compared, as indicated by the capped line. aP < 0.05, bP < 0.01, cP < 0.001.
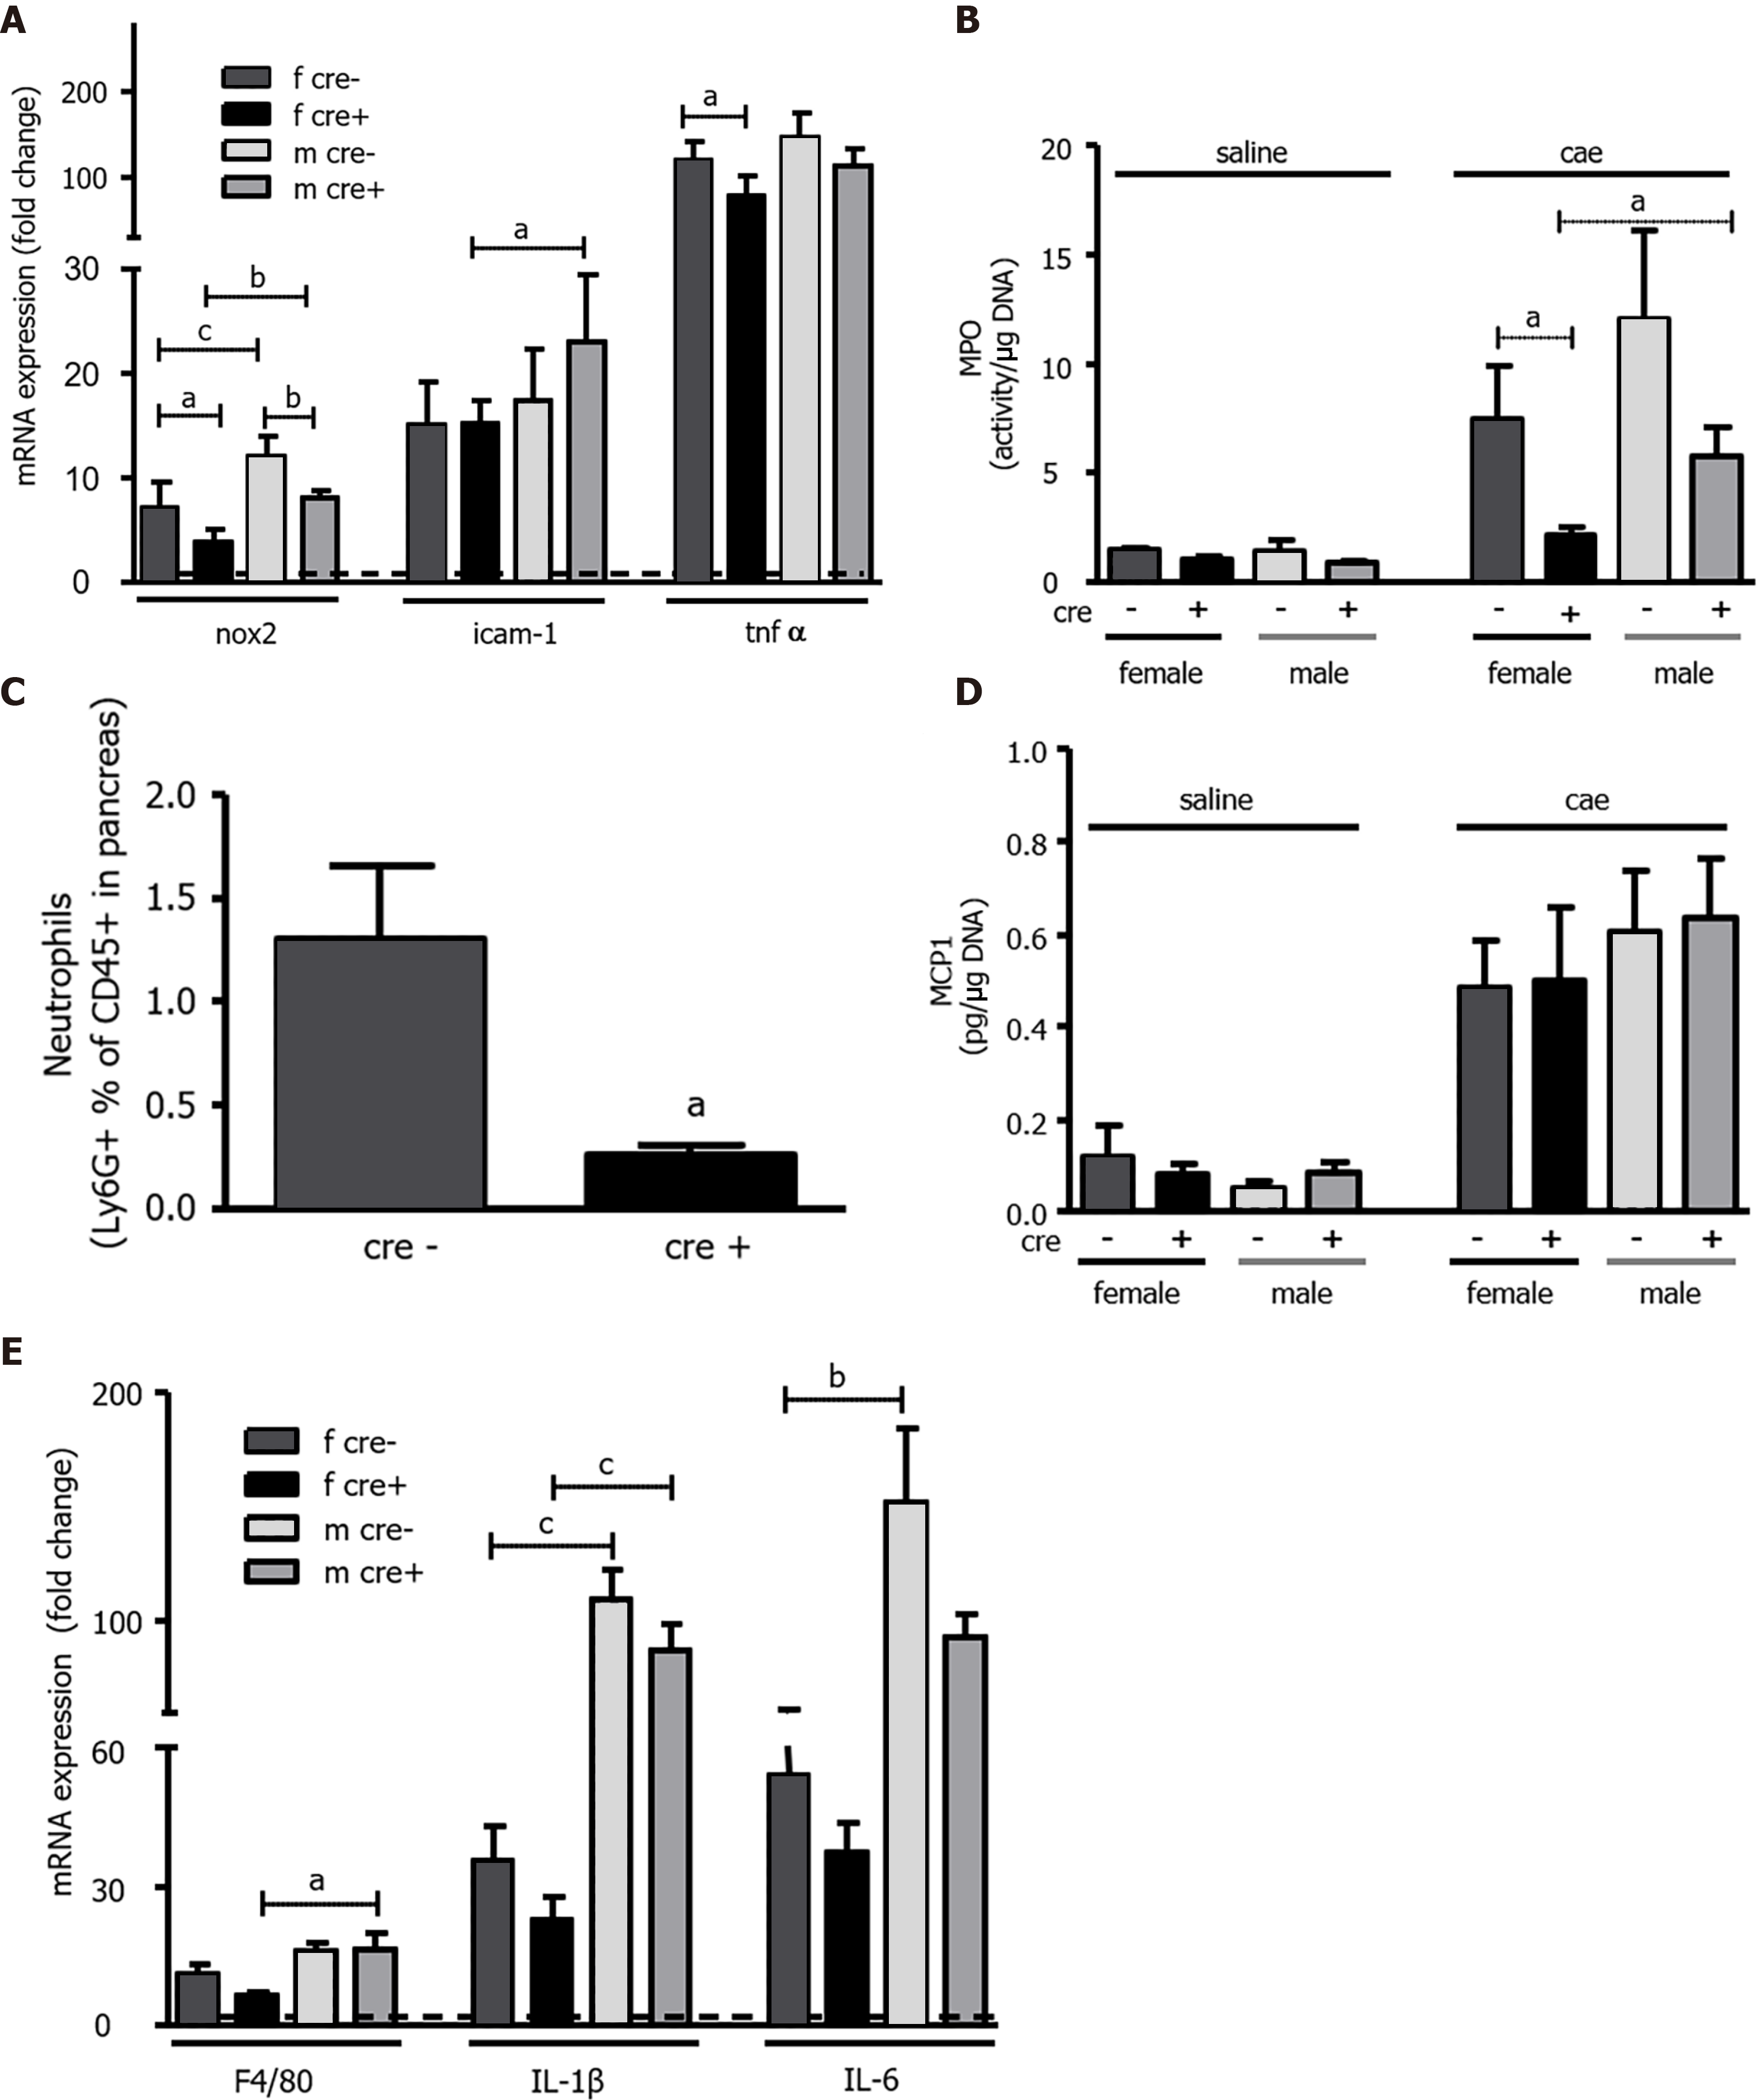
Figure 4 The number and activity of neutrophils in LAT1-ko mice was reduced, but the capacity to recruit macrophages was maintained.
A-C: LAT1-ko mice recruited less neutrophils than LAT1-wt cre-mice. A: The mRNA expressions of NADPH oxidase 2 (nox2), tumor necrosis factor α (tnfα), and intercellular adhesion molecule 1 (icam-1) were analyzed via qPCR and expressed as a fold change relative to saline-injected controls 24 h after the onset of acute pancreatitis (AP). The line indicates the expression level of the control animals. Mean ± SEM, n = 4-7; B: Myeloperoxidase activity in LAT1-ko mice 24 h after saline or caerulein (cae) injection was expressed as activity/μg DNA. Mean ± SEM, n = 3-8; C: The lower number of neutrophils recruited was assessed by FACS analysis of the pancreas 24 h after the onset of AP. The results illustrate the ratio of Ly6G positive to CD45 positive cells. Mean ± SEM, n = 4-5. Statistical analysis was conducted with an unpaired, two-tailed t-test. aP < 0.05; D-E: Recruitment of macrophages was equal in both genotypes, but female LAT1-ko mice exhibited a lower expression of macrophage marker and interleukins; D: Monocyte chemotactic protein 1 was equal between genotypes and sexes; this was measured by ELISA in the pancreas of saline or cae-injected mice and expressed as pg/µg DNA. Mean ± SEM, n = 3-8; E: Macrophage marker F4/80, interleukin 1β (IL-1β), and IL-6 were lower in female LAT1-ko when analyzed via qPCR and expressed as a fold change relative to saline-injected controls 24 h after the onset of AP. The line indicates the expression level of control animals. Mean ± SEM, n = 4-8. Statistical analysis was conducted with ANOVA and Bonferroni and then compared, as indicated by the capped line. aP < 0.05, bP < 0.01, cP < 0.001.
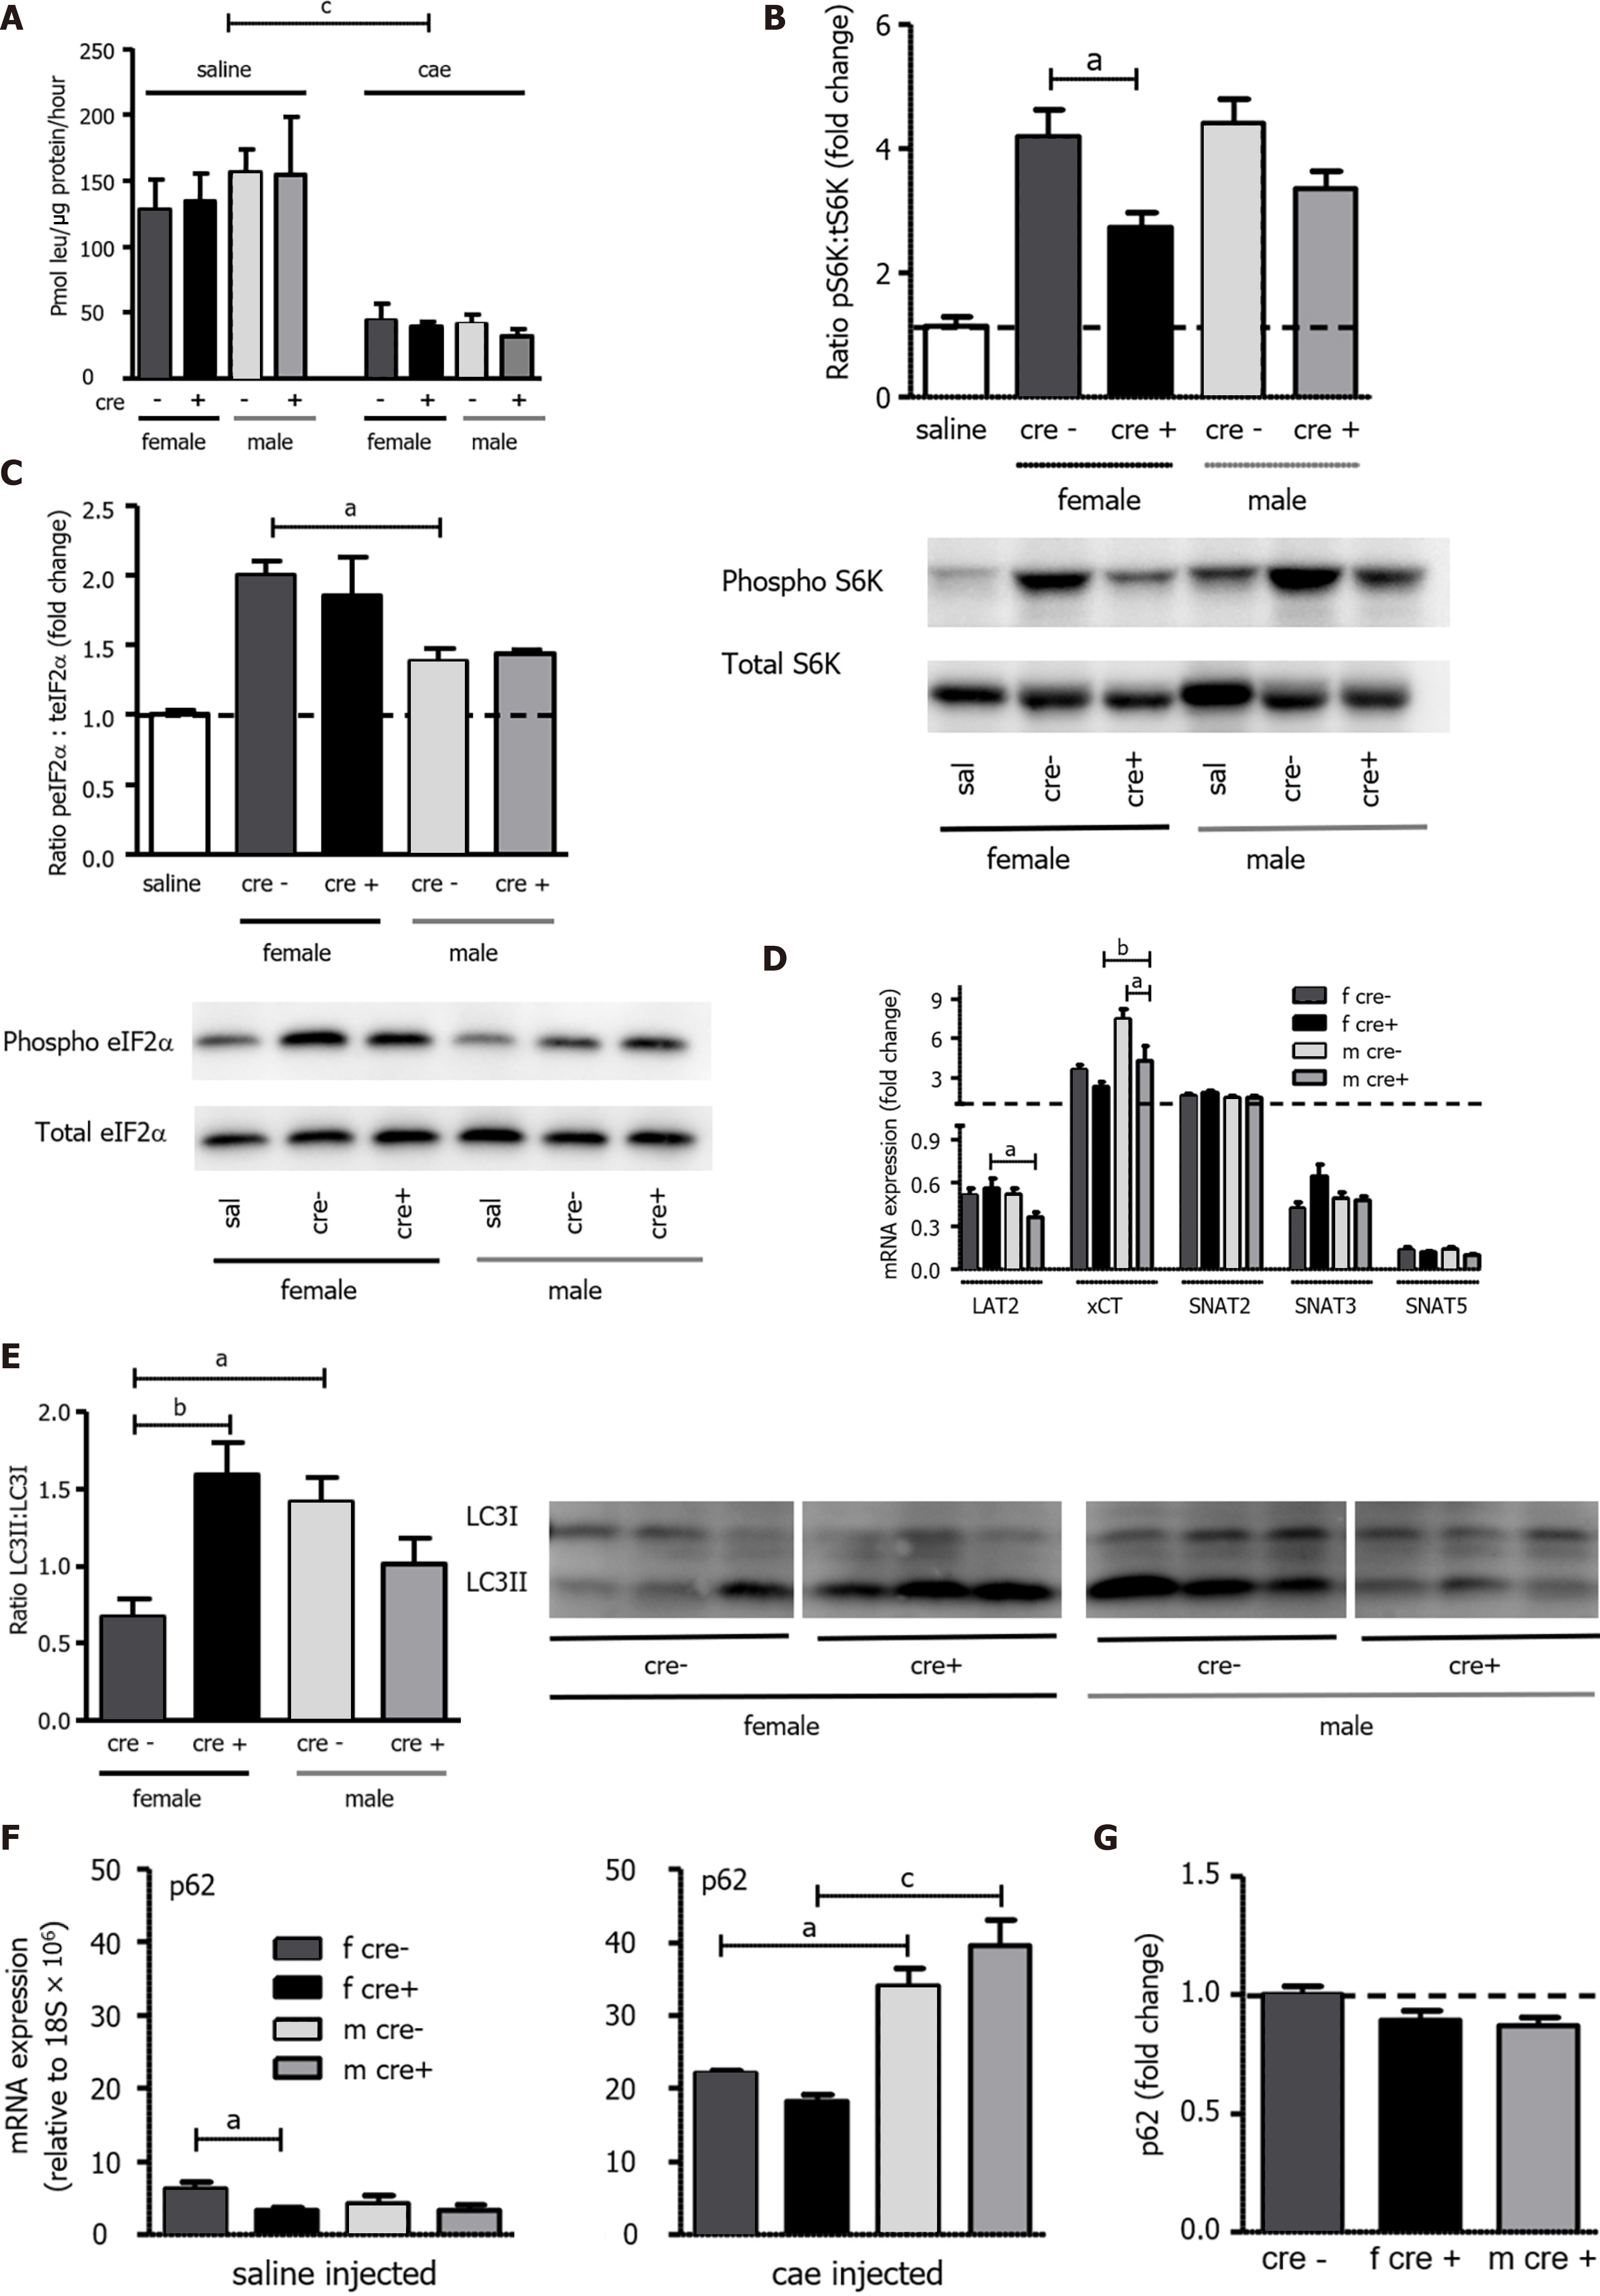
Figure 5 Protein synthesis, mammalian target of rapamycin, and general control nonderepressible 2 pathways as well as autophagy were differently regulated upon knockout of LAT1.
A: As measured by the incorporation of 3H-leucine into total protein and expressed as pmol leu/mg protein/hour, protein synthesis was seen to decrease in both genotypes 24 h after the onset of acute pancreatitis (AP). Mean ± SEM, n = 3-8; B: The mammalian target of rapamycin (mTOR) downstream target S6 kinase (S6K) was activated to a lesser degree in female LAT1-ko mice. Phosphorylated and total S6K levels were determined with Western blotting (8% SDS-PAGE gel, cells’ total lysates) 24 h after the onset of AP, and they showed a band at approximately 70 kDa. The results were expressed as a ratio of phosphorylated to total protein relative to the saline-injected controls; C: General control nonderepressible (GCN2) was more activated in females. The GCN2 downstream target eukaryotic-translation-initiating factor 2α (eIF2α) was analyzed via Western blotting (12% SDS-PAGE gel, cells’ total lysates) 24 h after the onset of AP, and it exhibited a band at approximately 38 kDa. The results were expressed as ratio of phosphorylated to total protein, which was relative to the saline-injected controls. Mean ± SEM, n = 4; D: Variation of amino acid transporter expression after AP induction. The mRNA expression of LAT2 (slc7a8), xCT (slc7a11), SNAT2 (slc38a2), SNAT3 (slc38a3), and SNAT5 (slc38a5) was analyzed via qPCR and expressed as a fold change that was compared to saline-injected controls 24 h after the onset of AP. The line indicates the expression level of the control animals. Mean ± SEM, n = 5-8; E-G: Female LAT1-ko mice presented with enhanced markers for dysfunctional autophagy. E: The ratio of microtubule-associated protein 1A/1B-light chain 3 II (LC3II) to LC3I was higher in female LAT1-ko compared to female LAT1-wt. Moreover, the LC3II-to-LC3I ratio was examined using Western blotting (13.5% SDS-PAGE gel, cells’ total lysates) 24 h after the onset of AP; a double band appeared at approximately 15 kDa. The upper band represents LC3I, and the lower band indicates LC3II. Mean ± SEM, n = 3-6; F-G: Male mice express more p62 mRNA, yet no more protein, than their female counterparts; F: The mRNA expression of p62 was analyzed via qPCR and expressed relative to a housekeeping gene (18S × 106) in LAT1-wt and LAT1-ko mice. The upper panel depicts the mice that were injected with saline, and the lower panel highlights the mice 24 h after AP induction. Mean ± SEM, n = 3-7; G: The p62 protein was analyzed with Western blotting (12% SDS-PAGE gel, cells’ total lysates) 24 h after the onset of AP, and it exhibited a band at approximately 62 kDa. The results were expressed relative to β-tubulin and normalized in line with the LAT1-wt average indicated by the line. Mean ± SEM, n = 5-8. The statistical analysis was conducted by ANOVA and Bonferroni and then compared, as indicated by the capped line. aP < 0.05, bP < 0.01, cP < 0.001.
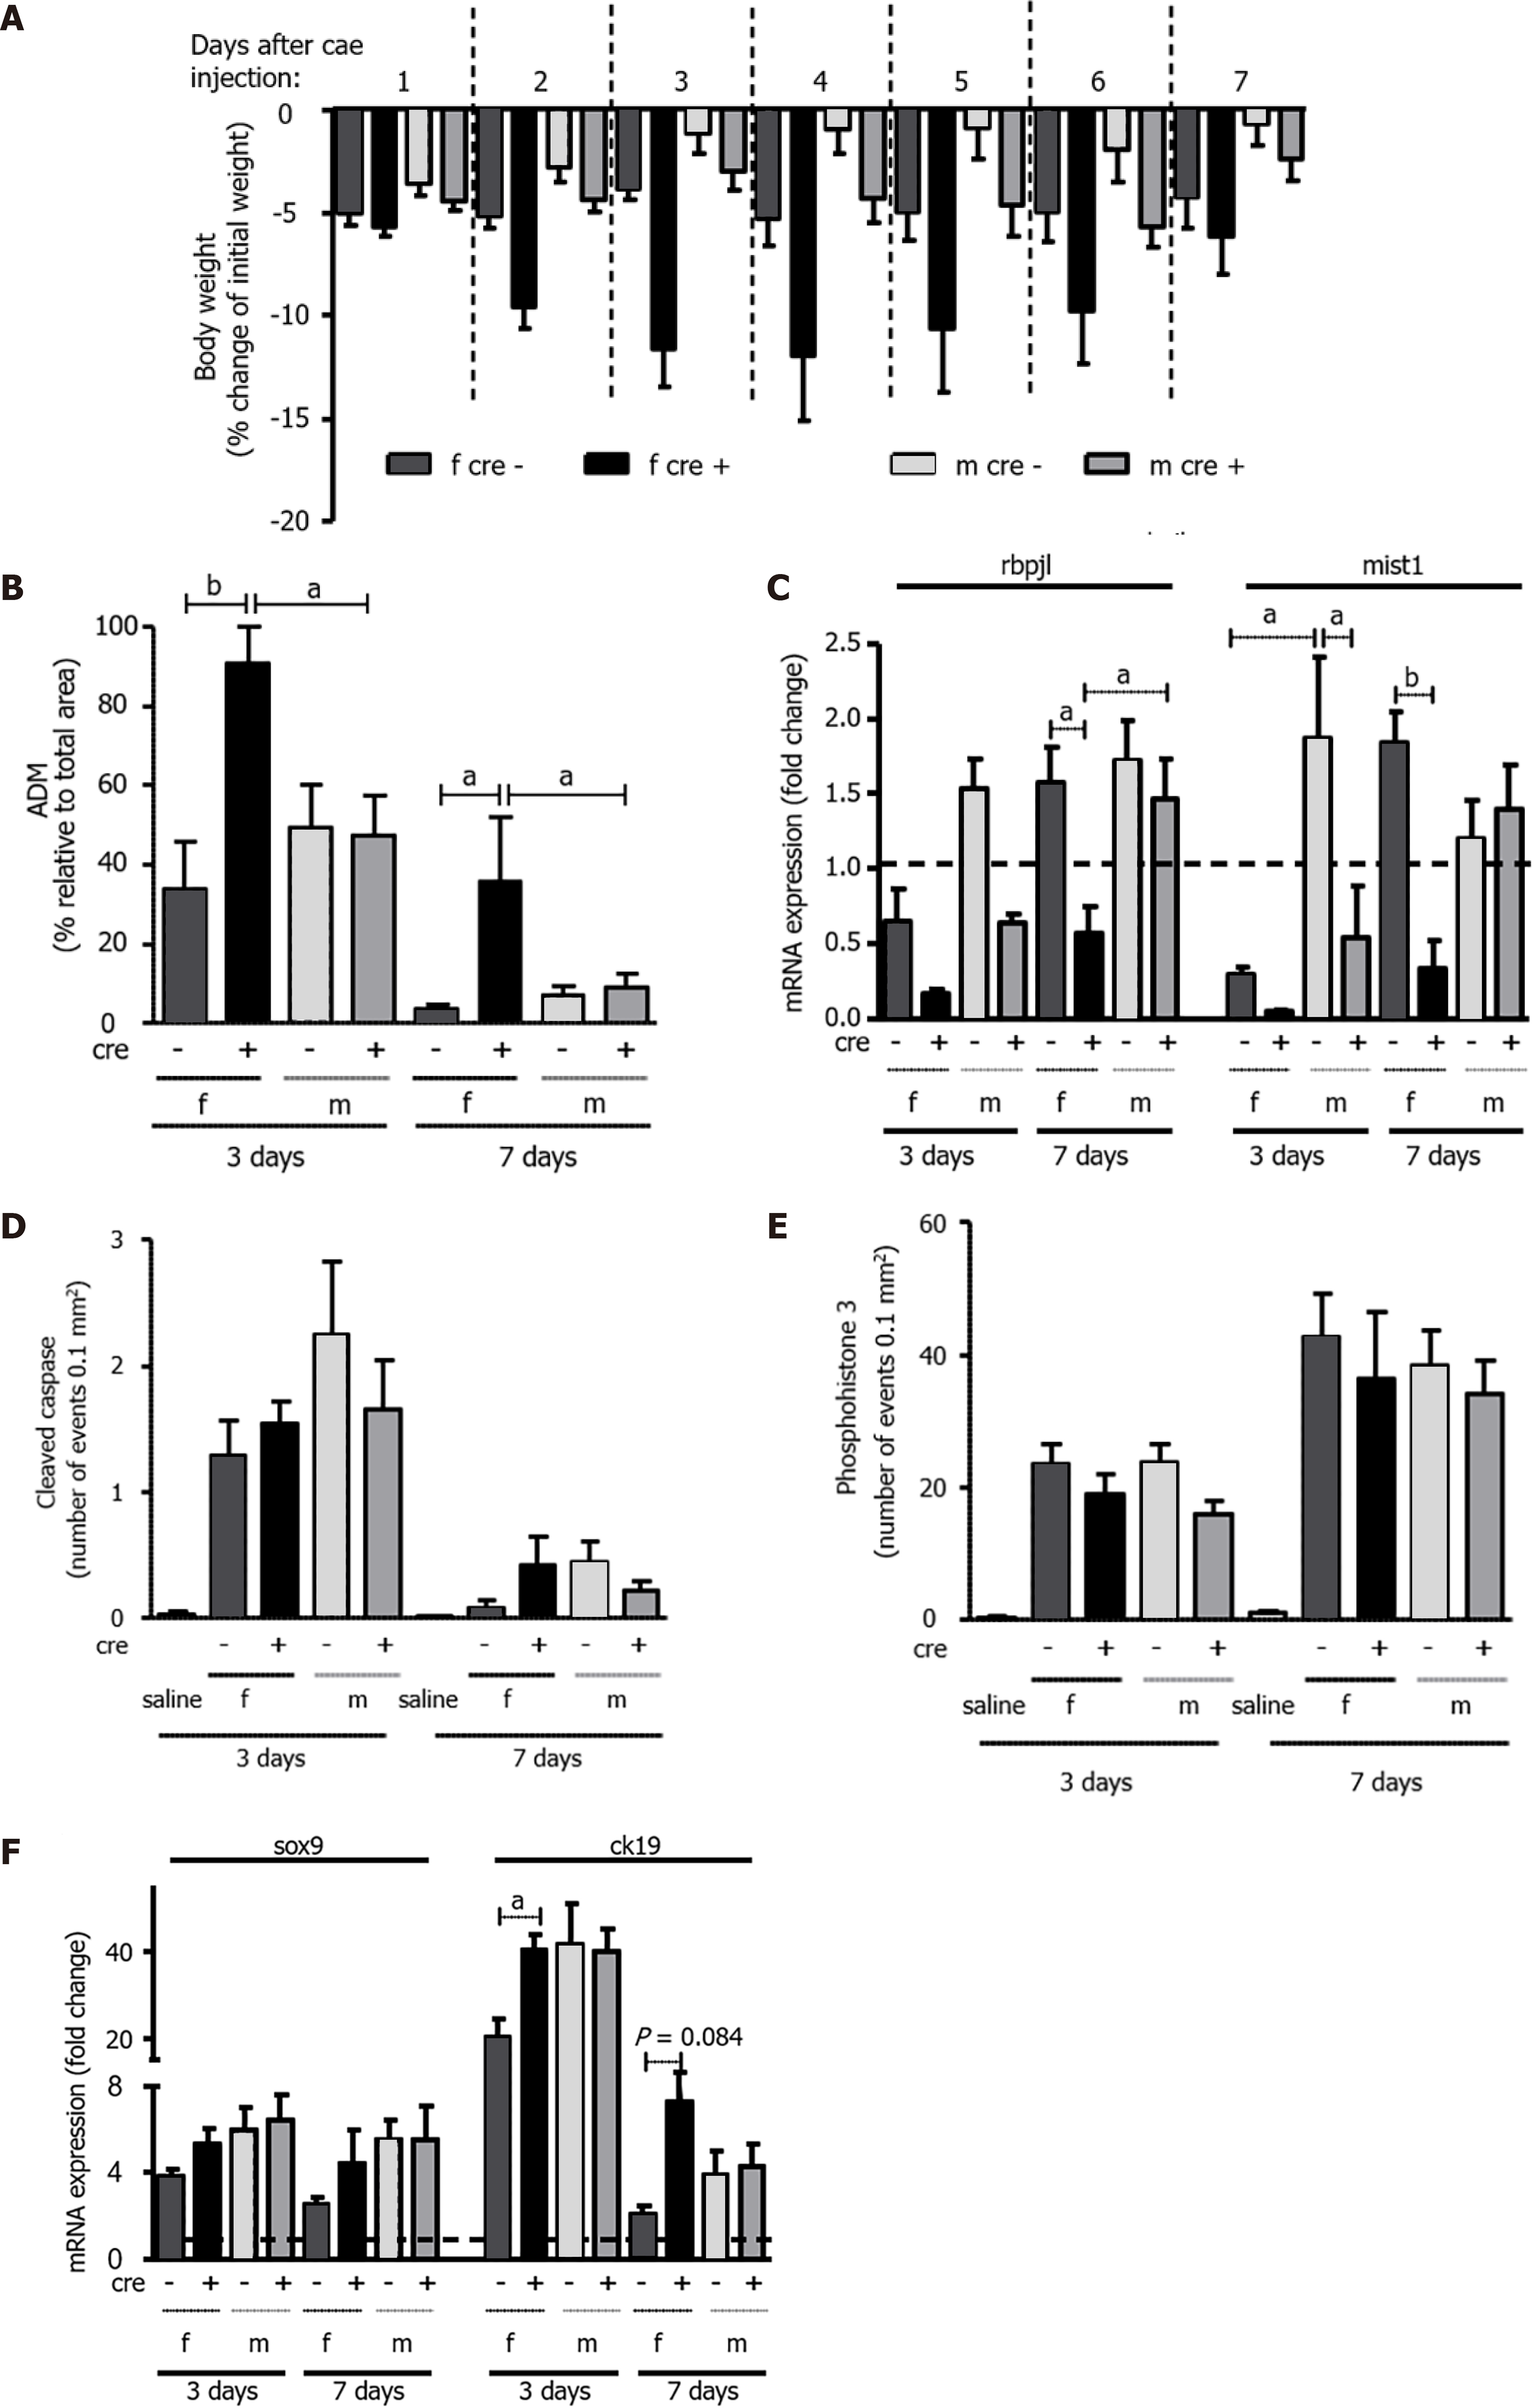
Figure 6 LAT1-ko mice showed a delayed recovery from acute pancreatitis, and the effect was more accentuated in females.
A: Weight loss in female LAT1-ko mice was more accentuated and prolonged compared to their LAT1-wt littermates. Their body weight was measured daily over a period of seven days after the caerulein injection, and it was then expressed as weight loss relative to their initial body weight. Mean ± SEM, n = 5-17; B: Acinar-to-ductal metaplasia (ADM) areas in female LAT1-ko mice were larger than in their littermates three and seven days after the onset of acute pancreatitis (AP). ADM structures were identified microscopically in the HE stains and expressed as a percentage that was relative to the total area of the pancreas. Mean ± SEM, n = 5-9; C: Markers of pancreas-specific differentiation were lower in female LAT1-ko mice up to seven days after the onset of AP. Meanwhile, the mRNA expression of recombining the binding protein suppressor of hairless-like protein (rbpjl) and basic helix-loop-helix family member A15 (mist1) was analyzed via qPCR, expressed as a fold change, and then compared to saline-injected controls three and seven days after the onset of AP. The line indicates the expression level found in the control animals. Mean ± SEM, n = 3-5; D-E: Apoptosis and proliferation did not differ between the groups with AP, as demonstrated by immunohistochemistry analyses of D: cleaved caspase and E: phosphohistone 3, respectively. The results were expressed according to the number of events in acinar cells per 0.1 mm2. Mean ± SEM, n = 5-9; F: The expression level of genes that are characteristic of dedifferentiation was elevated in female LAT1-ko mice up to day seven. Meanwhile, the mRNA expression of SRY-box transcription factor 9 (sox9) and cytokeratin 19 (ck19) was determined via qPCR and expressed as a fold change, which was compared to saline-injected controls three and seven days after the onset of AP. The line indicates the expression level of the control animals. Mean ± SEM, n = 3-5. Statistical analysis was conducted with ANOVA and Bonferroni and then compared, as indicated by the capped line. aP < 0.05, bP < 0.01, cP < 0.001.
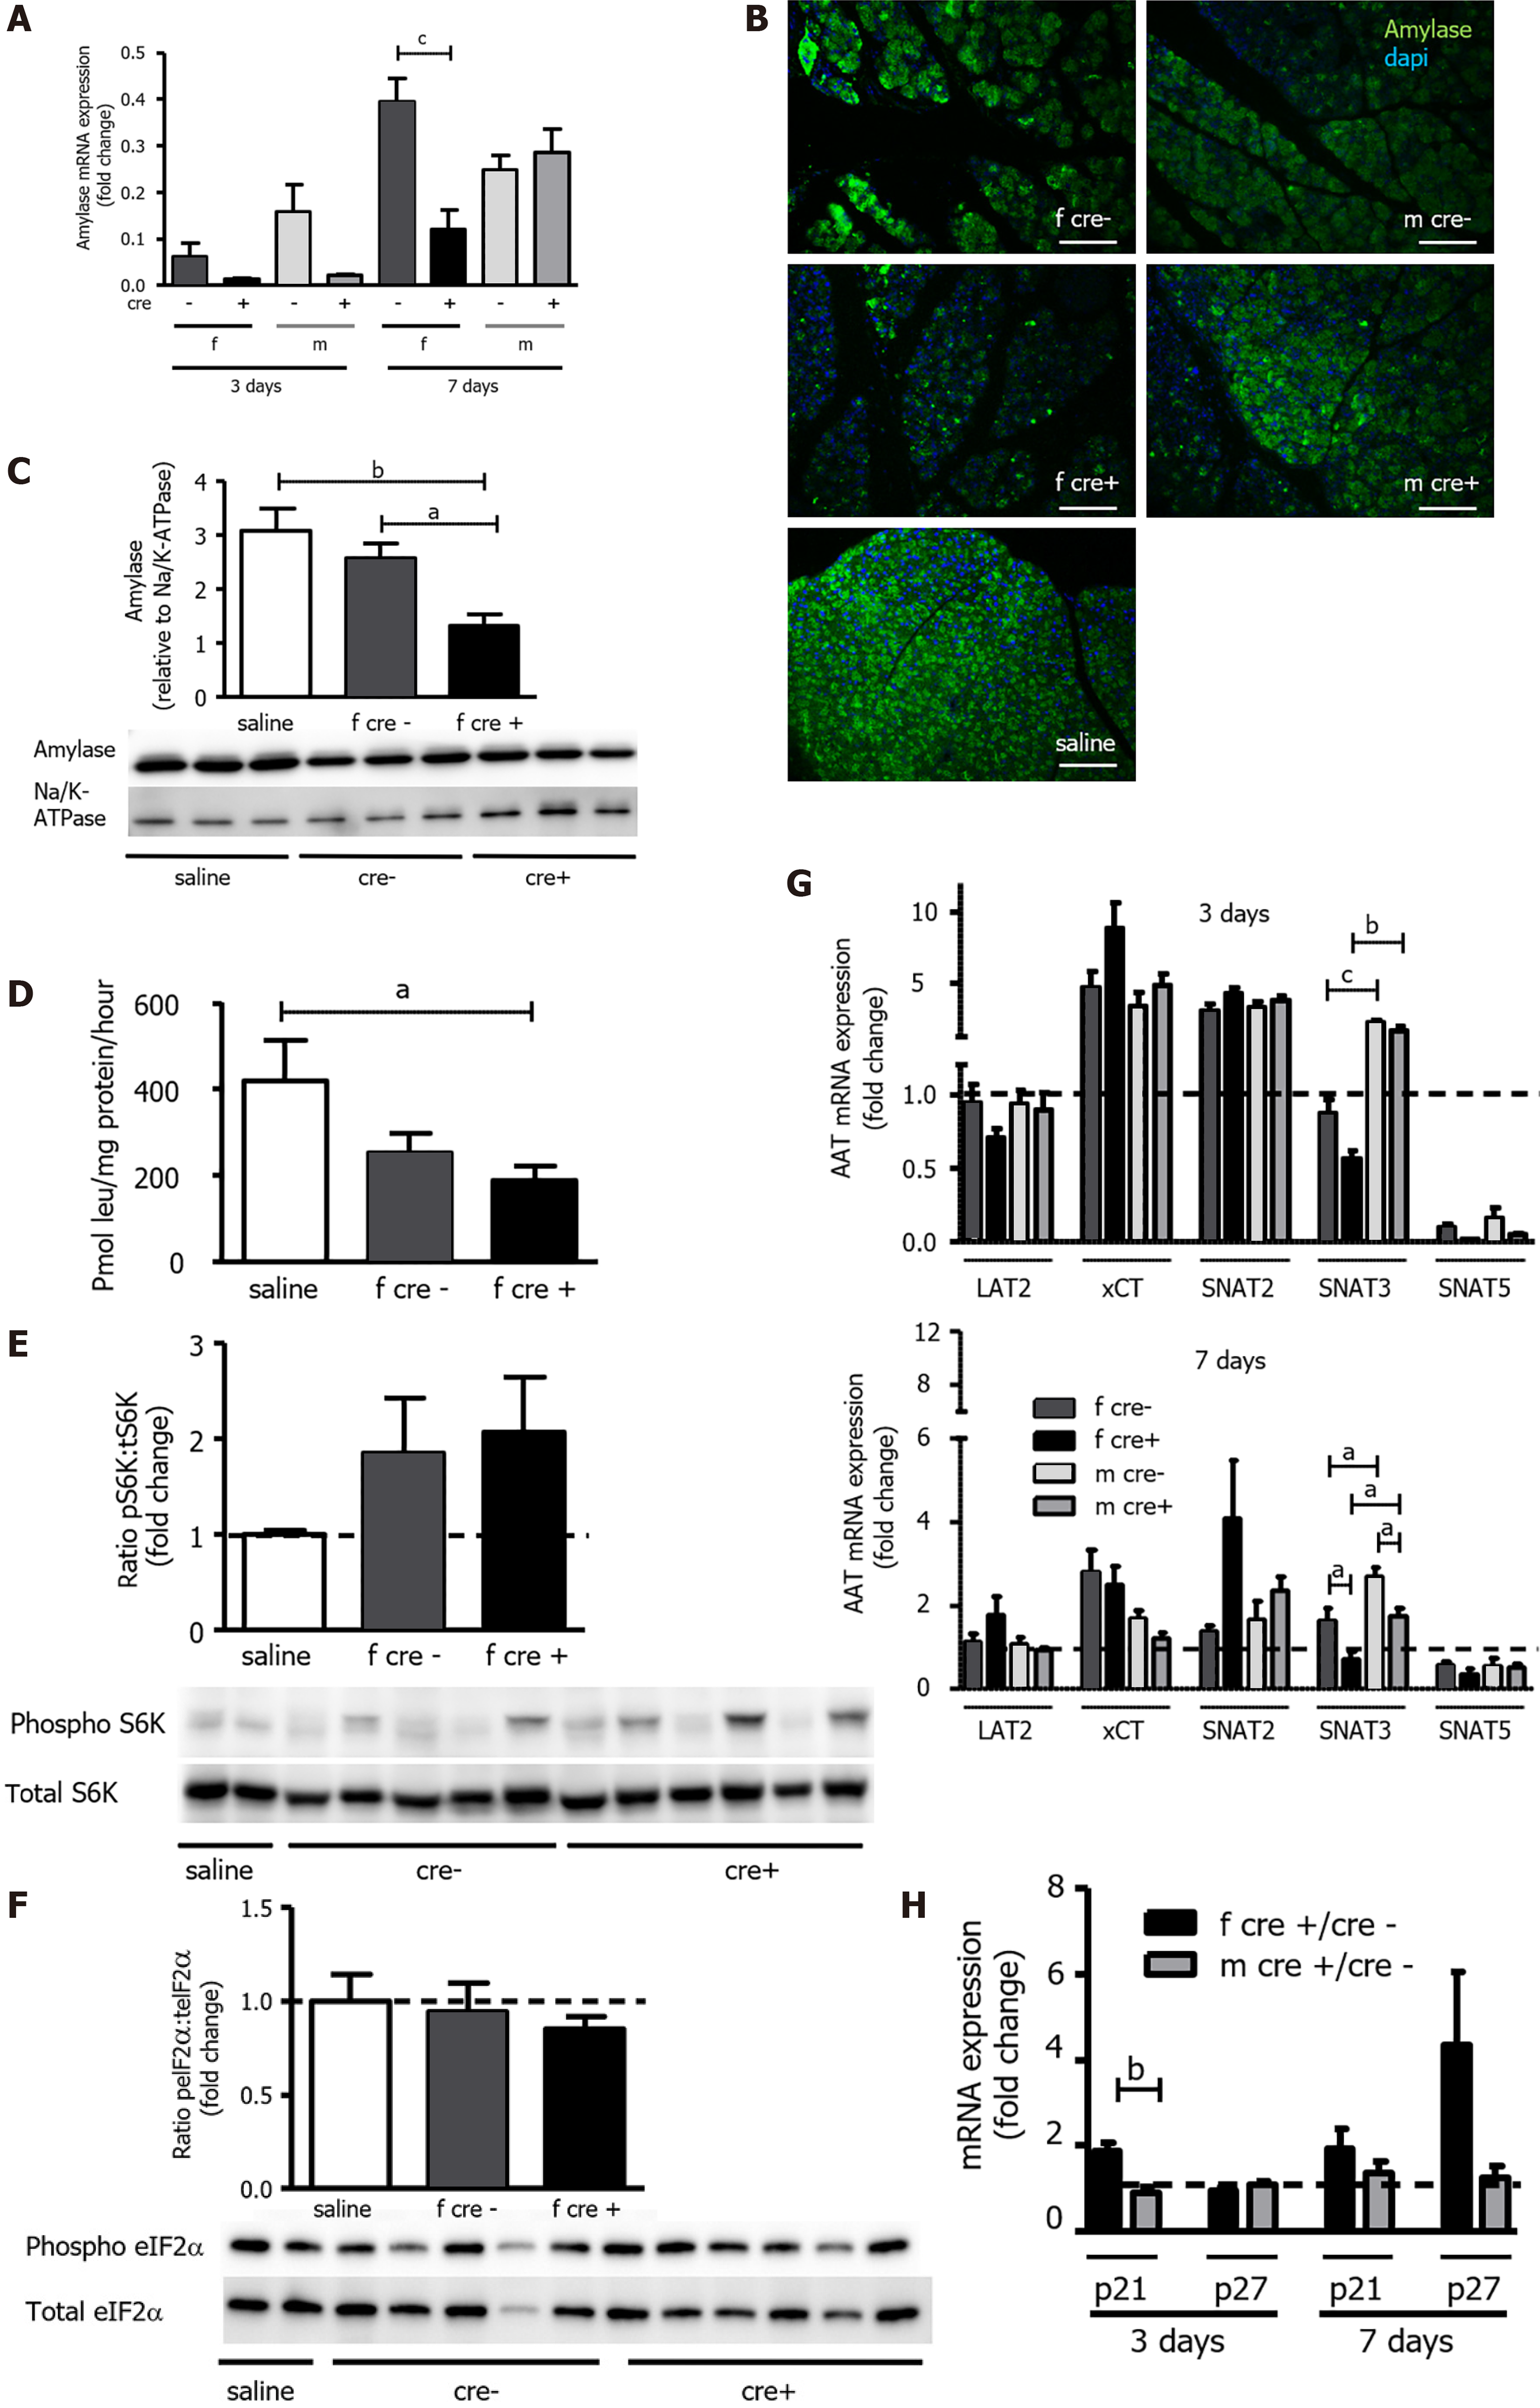
Figure 7 Functional recovery of acinar cells was delayed in LAT1-ko mice after injury.
A-C: Amylase mRNA and protein levels were reduced in female LAT1-ko mice. A: The mRNA of amylase was examined via qPCR and expressed as a fold change; subsequently, this value was compared to those relating to the saline-injected controls three and seven days after the onset of acute pancreatitis (AP). Mean ± SEM, n = 45. Subsequently, statistical analysis was conducted with ANOVA and Bonferroni and then compared, as indicated by the capped line. cP < 0.001; B: Decreased amylase expression could also be evidenced by reduced signal intensity in immunofluorescence three days after AP induction. The paraffin-embedded mouse pancreas was stained for amylase (green), and the nuclei were stained in blue (dapi). The bar length corresponds to 100 μm; C: Amylase protein was analyzed with Western blotting (10% SDS-PAGE gel, cells’ total lysates) three days after the onset of AP; it exhibited a band at approximately 60 kDa. The results were expressed relative to Na/K-ATPase; D: LAT1-ko mice showed lower protein synthesis compared to the saline-injected controls, as measured by the incorporation of 3H-leucine into total protein and expressed as pmol leu/mg protein/hour three days after the onset of AP in female mice. Mean ± SEM, n = 3-8. Statistical analysis was conducted with ANOVA and Bonferroni and then compared, as indicated by the capped line. aP < 0.05; E-F: Mammalian target of rapamycin was increased, and the general control nonderepressible 2 (GCN2) pathway was not activated in LAT1-ko mice three days after AP; E: Phosphorylated and total S6K levels were determined with Western blotting (8% SDS-PAGE gel, cells’ total lysates) three days after the onset of AP; there was a band at approximately 70 kDa. The results were expressed as a ratio of phosphorylated to total protein relative to the saline-injected controls; F: GCN2’s downstream target eukaryotic-translation-initiation factor 2α was analyzed using Western blotting (12% SDS-PAGE gel, cells’ total lysates) three days after the onset of AP, and a band appeared at approximately 38 kDa. The results were expressed as a ratio of phosphorylated to total protein relative to the saline-injected controls. Mean ± SEM, n = 5-6; G: The expression of SNAT3 was lower in female mice until seven days after the onset of AP. The mRNA expression of LAT2 (slc7a8), xCT (slc7a11), SNAT2 (slc38a2), SNAT3 (slc38a3), and SNAT5 (slc38a5) was analyzed via qPCR and expressed as a fold change in comparison with saline-injected controls three and seven days after the onset of AP. The line indicates the expression level of the control animals. Mean ± SEM, n = 5-10. Statistical analysis was conducted with ANOVA and Bonferroni and then compared, as indicated by the capped line. aP < 0.05, bP < 0.01, cP < 0.001; H: Expression of senescence markers was more accentuated in female LAT1-ko mice up until seven days after the onset of AP. The mRNA levels of p21 and p27 were analyzed via qPCR and expressed as a fold change, which was compared to the LAT1-wt group three and seven days after the onset of AP. The line indicates the expression level of the LAT1-wt animals. Mean ± SEM, n = 5. Statistical analysis was conducted via an unpaired, two-tailed t-test. As indicated by the capped line, a comparison was then made. bP < 0.01.
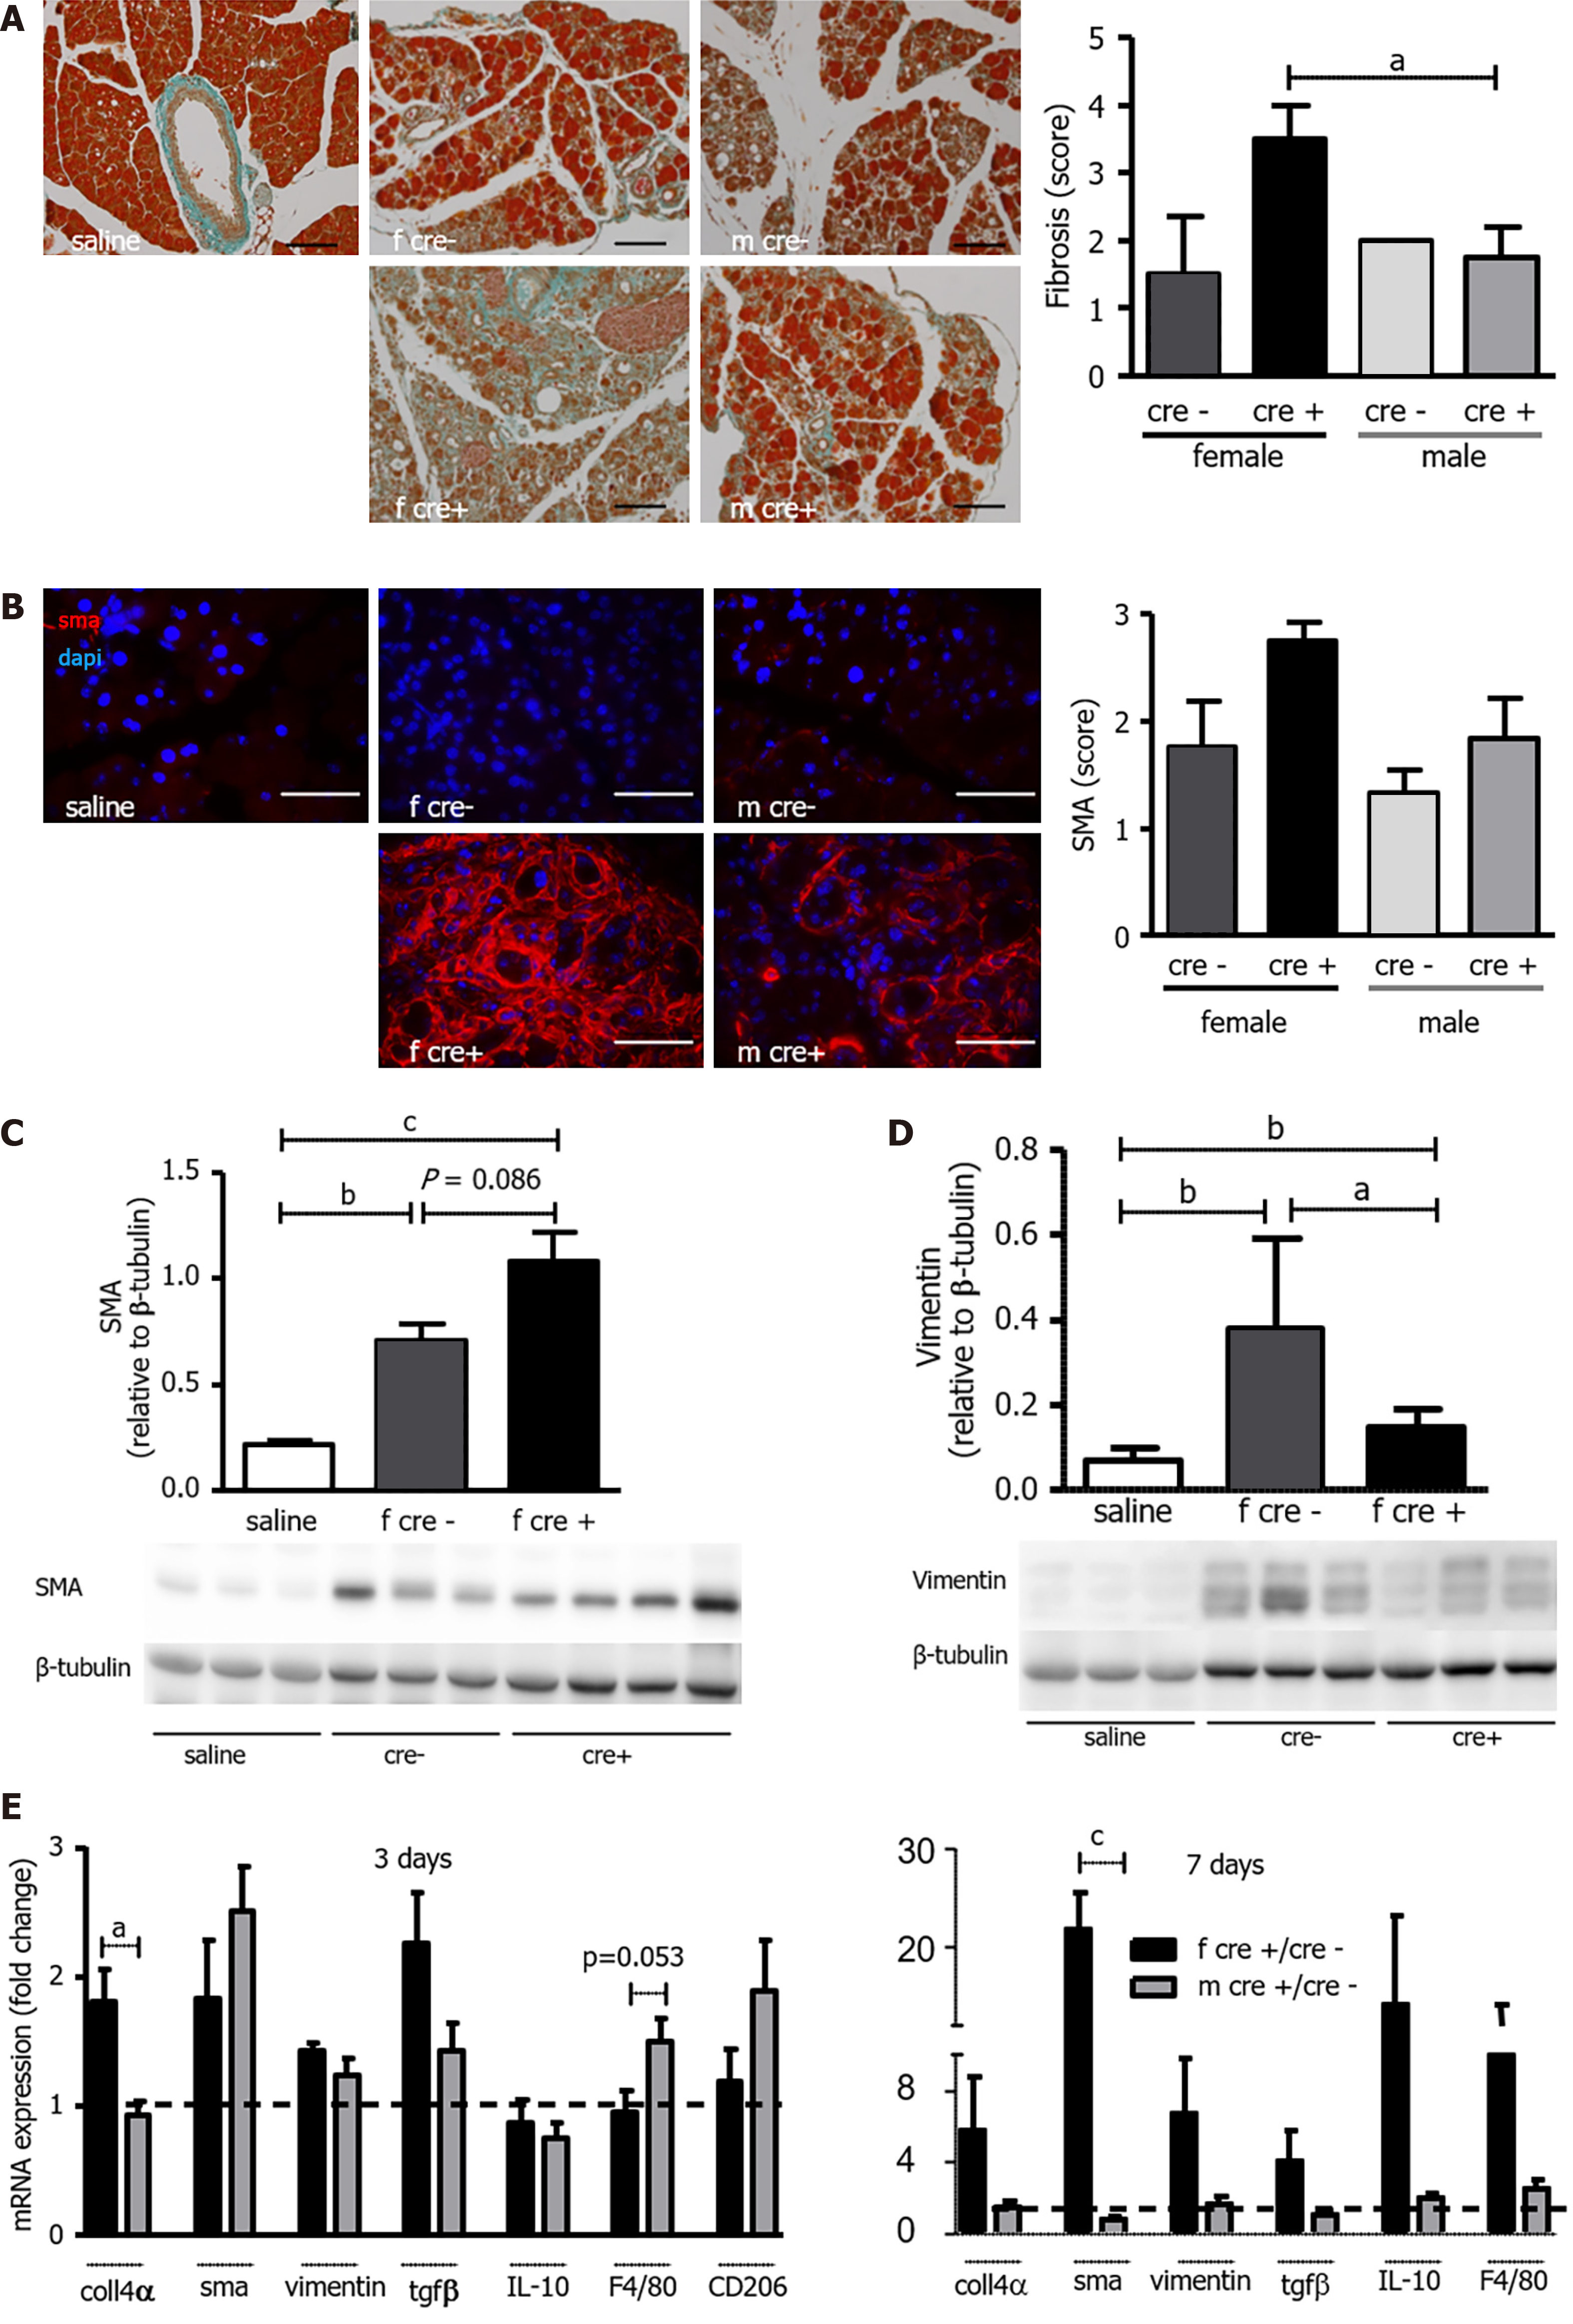
Figure 8 Female LAT1-ko mice presented with higher levels of fibrosis and expression of markers thereof.
A: Female LAT1-ko mice presented with larger areas of fibrosis. Masson’s trichrome staining (left) and quantification (right) of fibrosis in the pancreas three days after the onset of acute pancreatitis (AP). A score from 0 to 5 was attributed to each section in a blinded fashion, which was dependent on the extent of the fibrosis. The Bar length corresponds to 100 μm. Mean ± SEM, n = 4-6. Statistical analysis was conducted with ANOVA and Bonferroni and then compared, as indicated by the capped line. aP < 0.05; B-D: Female LAT1-ko mice exhibited enhanced activation of pancreatic stellate cells (PSC) compared to their littermates; B: Immunohistochemistry (left) and quantification (right) for smooth muscle actin (SMA) in the pancreas three days after the onset of AP. A score from 0 to 3 was attributed to each section in a blinded fashion depending on the signal intensity of the SMA staining. The paraffin-embedded mouse pancreas was stained for SMA (red) and the nuclei were stained in blue (dapi). The bar length corresponds to 50 μm. Mean ± SEM, n = 5; C: SMA that was indicative of activated PSC was also analyzed with Western blotting (12% SDS-PAGE gel, cells’ total lysates from female mice) three days after the onset of AP; this process led to a band being exhibited at approximately 42 kDa. The results were expressed relative to β-tubulin. Mean ± SEM, n = 3-6. Statistical analysis was conducted by ANOVA and Bonferroni and then compared, as indicated by the capped line. bP < 0.01, cP < 0.001; D: The marker for non-activated stellate cells of vimentin was less expressed in the female LAT1-ko mice. Vimentin was also analyzed by Western blotting (10% SDS-PAGE gel, cells’ total lysates from female mice) three days after the onset of AP and showed a band at approximately 57 kDa. The results were expressed relative to β-tubulin. Mean ± SEM, n = 3. Statistical analysis was conducted with ANOVA and Bonferroni and then compared, as indicated by the capped line. aP < 0.05; E: Female LAT1-ko mice showed an elevated expression of markers for fibrosis and similar markers for macrophages when compared to male mice on day three. The mRNA levels of collagen 4α (coll4α), SMA, vimentin, transforming growth factor β, interleukin 10, F4/80, and CD206 were analyzed via qPCR and expressed as a fold change in comparison with LAT1-wt mice three and seven days after the onset of AP. The line indicates the expression level of LAT1-wt animals. Mean ± SEM, n = 5. Statistical analysis was conducted via an unpaired, two-tailed t-test, and a comparison was then made, as indicated by the capped line. aP < 0.05, cP < 0.001.
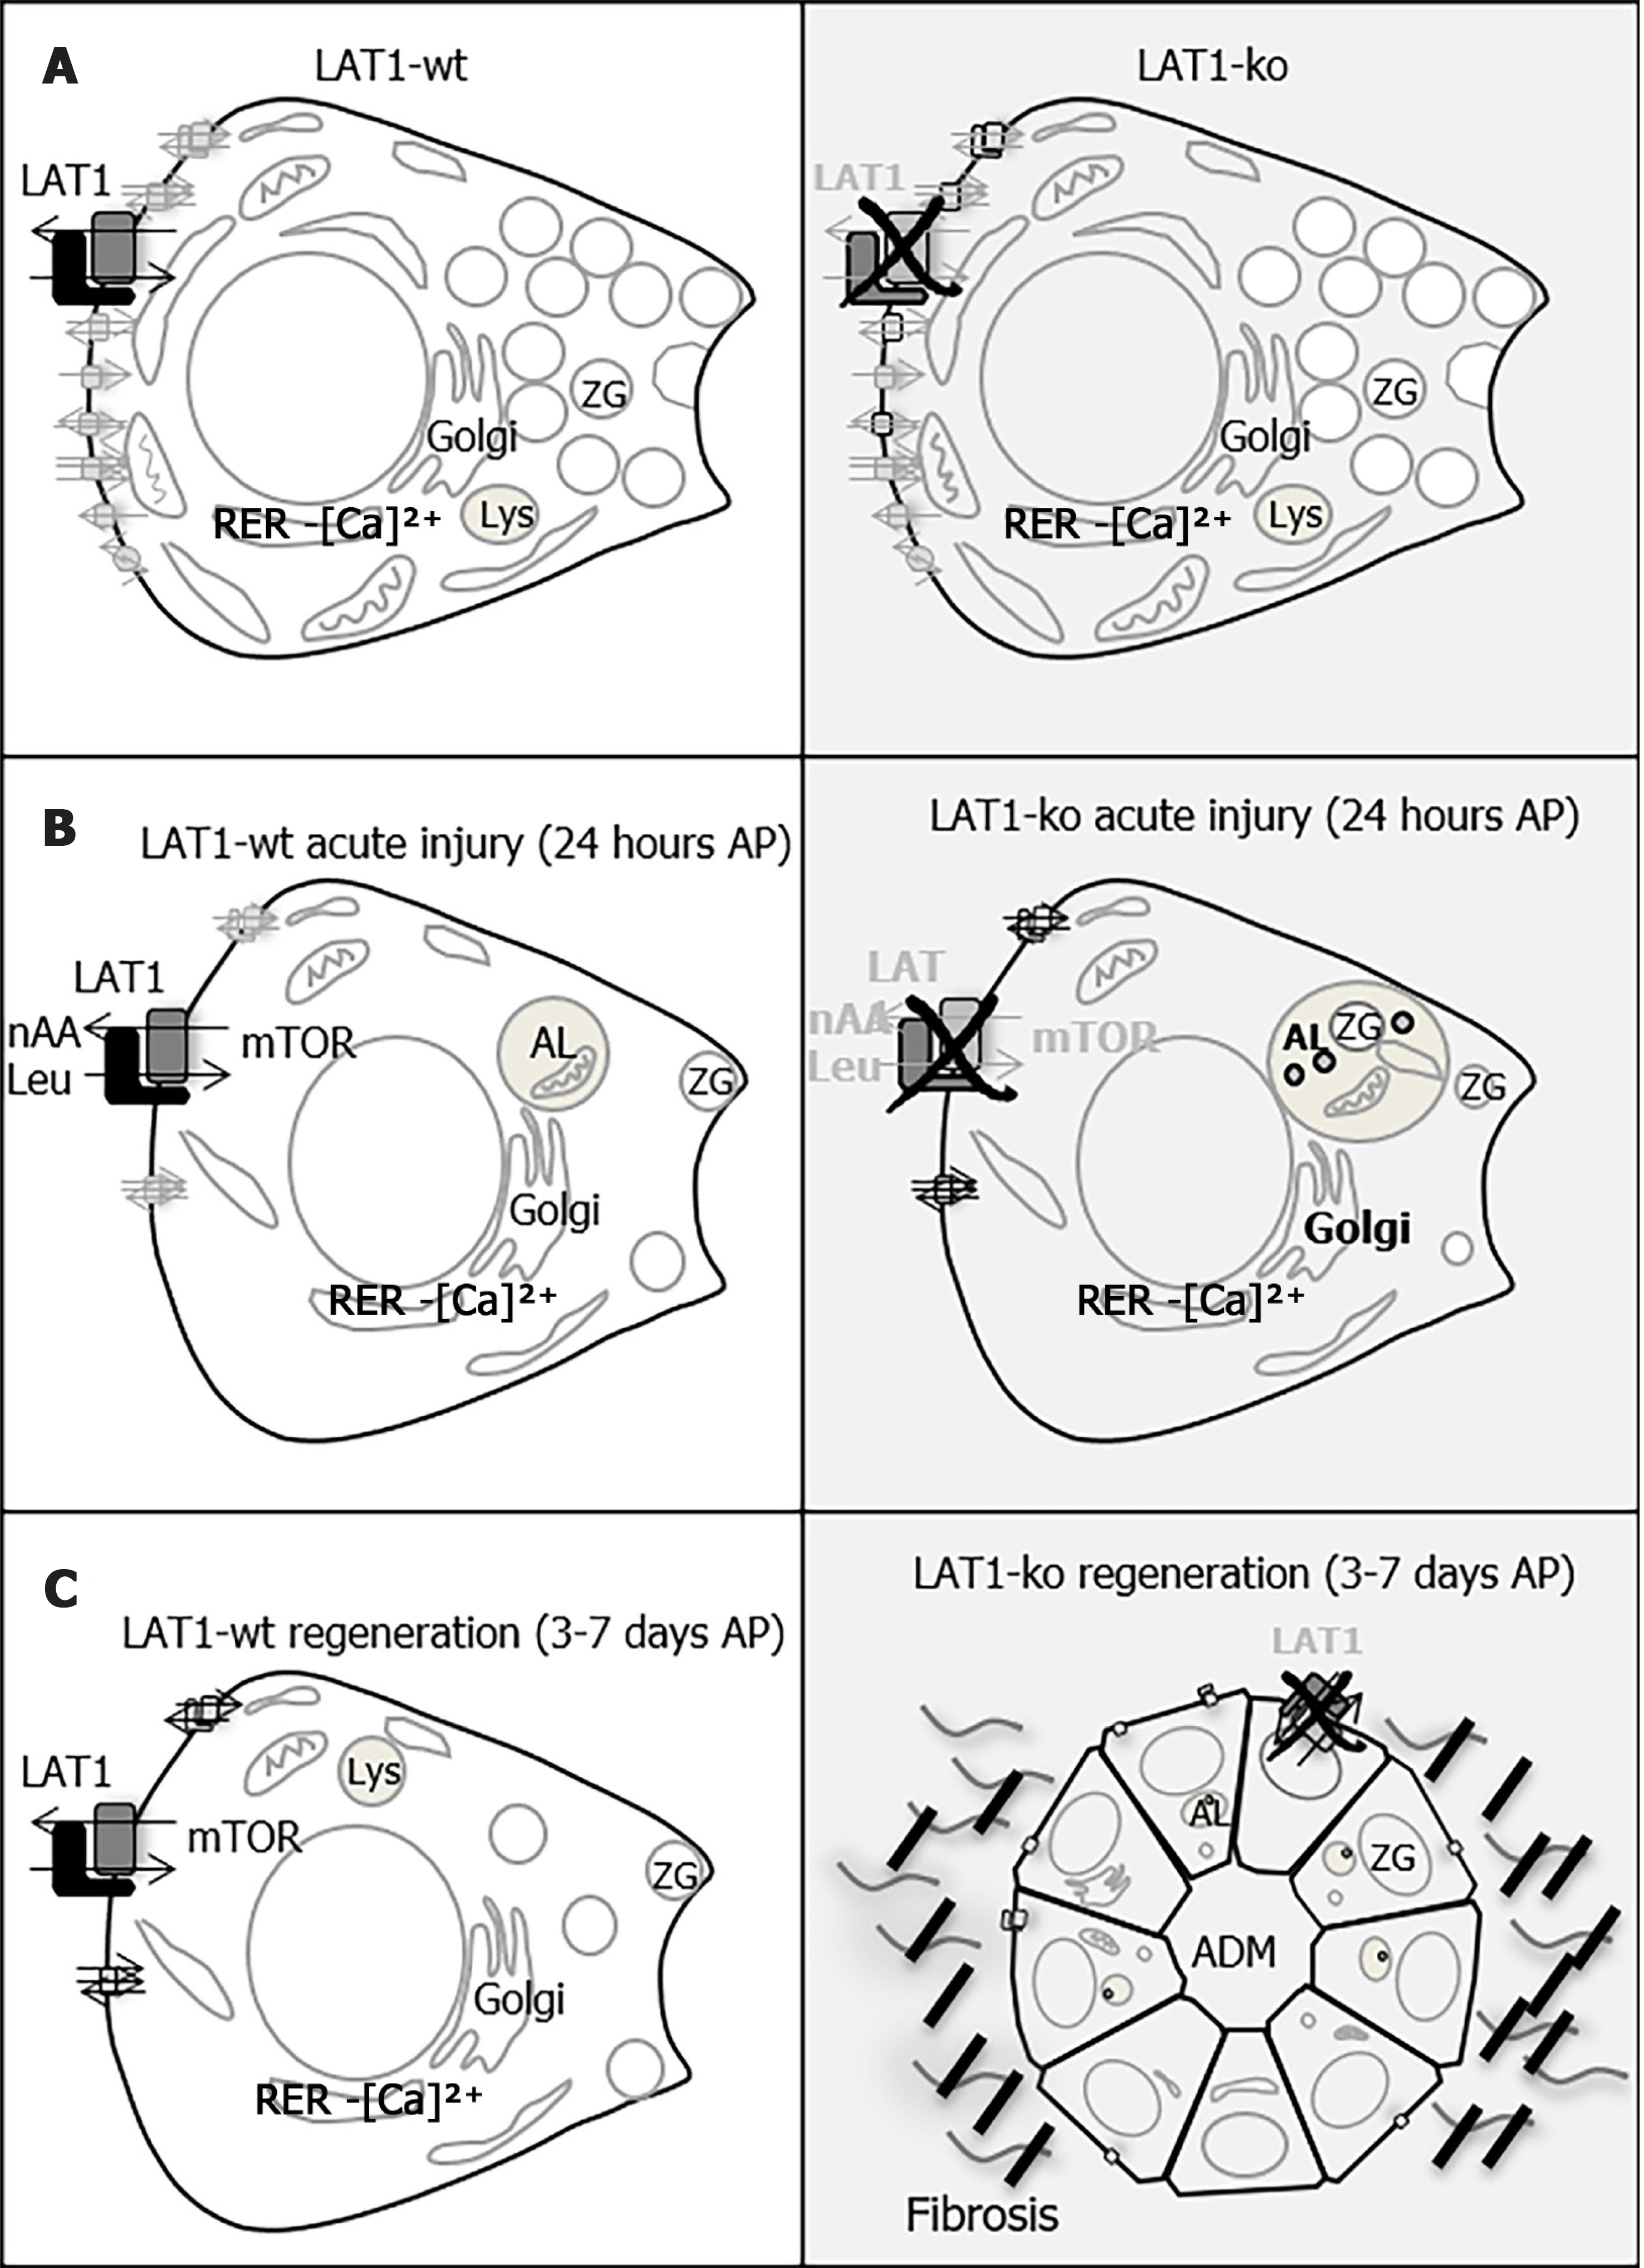
Figure 9 LAT1 ablation affects the initial metabolic adaptation that is necessary for the efficient repair after acute pancreatitis.
Acinar cells have a pyramidal shape and display a typical secretory machinery with a well-developed rough endoplasmic reticulum (RER) and Golgi apparatus (Golgi), which are localized to the perinuclear region, as well as lysosomes (Lys). In the apical region, digestive enzymes are stored in zymogen granules (ZG). A: Amino acid transporters (AAT) are expressed on the basolateral membrane of acinar cells and are responsible for the transportation of amino acids into the cells to maintain the synthesis of secreted enzymes; this is so they can be used as an energy source and to guarantee cell growth and regeneration after injury. LAT1 exchanges leucine (Leu) with other neutral amino acids (nAA), and the amino acid flow acts as an upstream regulator of the mammalian target of rapamycin (mTOR) pathway, which regulates protein synthesis and enables cell differentiation/survival. Morphology, enzyme expression, and other AAT expressions did not differ between healthy LAT1 wild-type (LAT1-wt, white, left-hand panel) and healthy LAT1 knockout (LAT1-ko, gray, right-hand panel) mice over the period observed in this study; B: During the early phase of AP, the remaining acinar cells entered a metabolic arrest, dedifferentiated, and temporarily reduced their secretory phenotype. An increase in autophagy (AL, autolysosome), followed by the re-activation of the mTOR pathway is decisive for the later steps of regeneration. LAT1 expression is maintained on acinar cells of LAT1-wt mice in this early phase, and it plays a role in the reactivation of mTOR. In LAT1-ko mice, the massive reduction of secretory enzyme expression was accompanied by markers of defective autophagy and a less-efficient activation of mTOR; C: Three days after the initial injury, LAT1-ko acinar cells were less differentiated and presented more areas of acinar-to-ductal metaplasia (ADM), expressed less secretory enzymes, and showed increased fibrosis. The delayed regeneration observed in acinar cells lacking LAT1 suggests that this occurred as a result of the improperly activated early metabolic response after injury.
- Citation: Hagen CM, Roth E, Graf TR, Verrey F, Graf R, Gupta A, Pellegrini G, Poncet N, Camargo SMR. Loss of LAT1 sex-dependently delays recovery after caerulein-induced acute pancreatitis. World J Gastroenterol 2022; 28(10): 1024-1054
- URL: https://www.wjgnet.com/1007-9327/full/v28/i10/1024.htm
- DOI: https://dx.doi.org/10.3748/wjg.v28.i10.1024


