Copyright
©The Author(s) 2021.
World J Gastroenterol. Dec 21, 2021; 27(47): 8194-8198
Published online Dec 21, 2021. doi: 10.3748/wjg.v27.i47.8194
Published online Dec 21, 2021. doi: 10.3748/wjg.v27.i47.8194
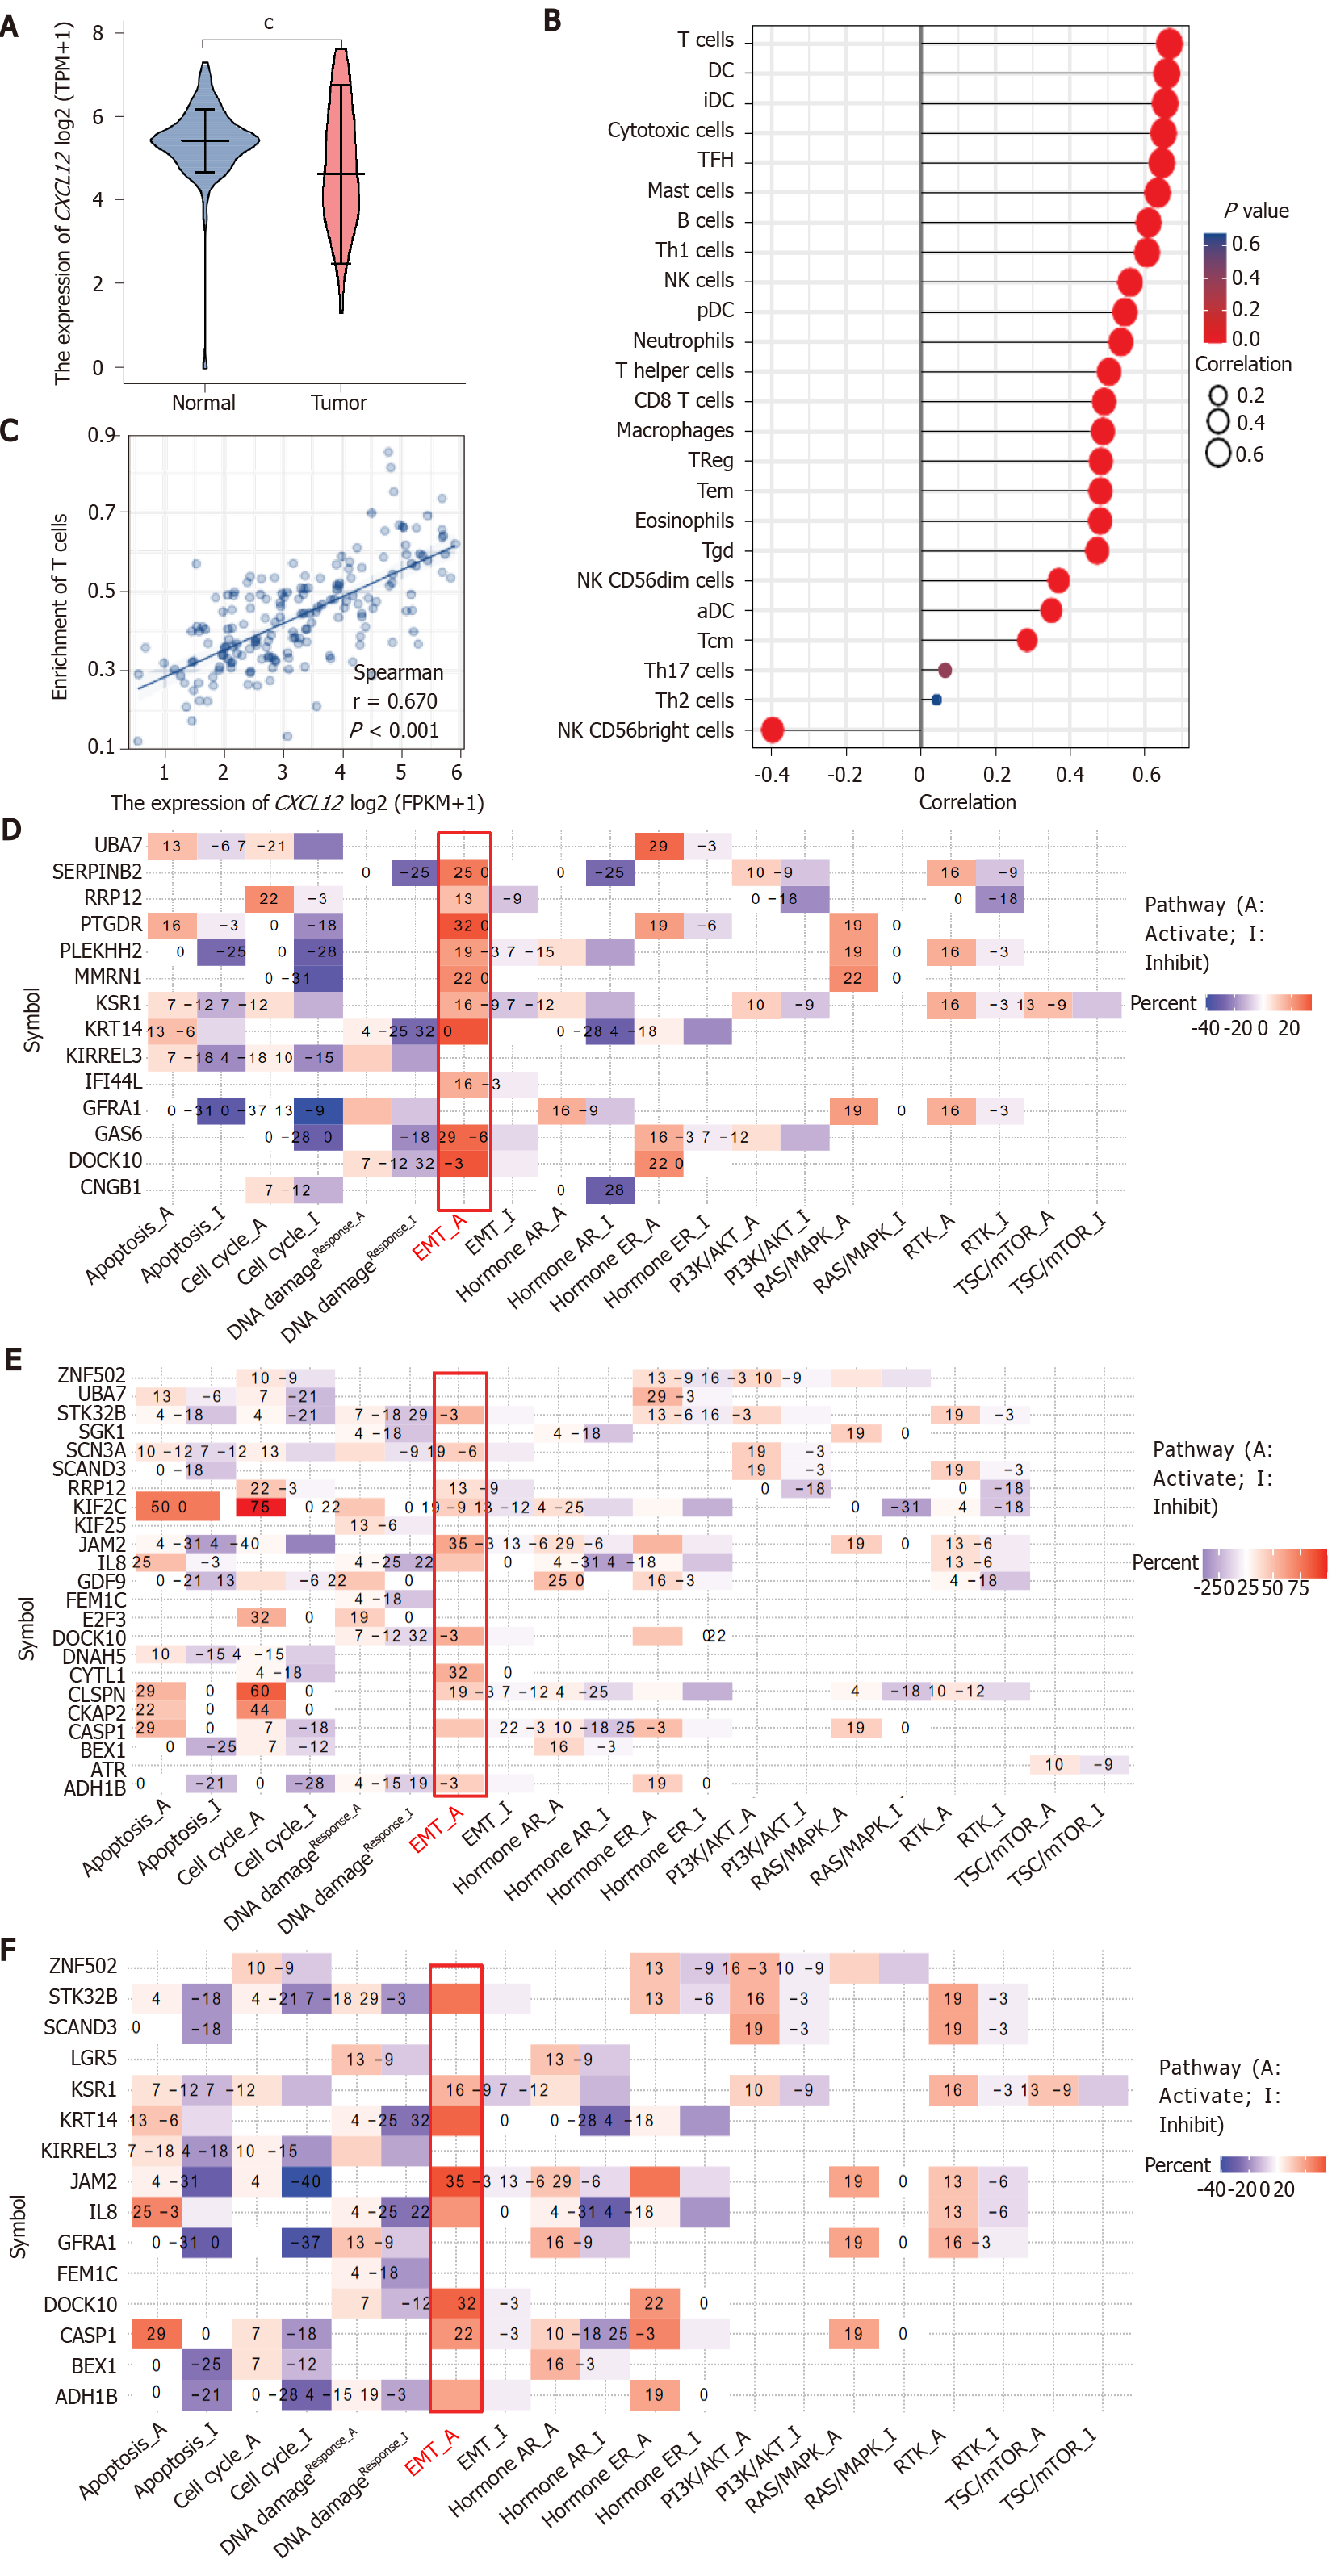
Figure 1 The effect of CXCL12 in the development of pancreatic ductal adenocarcinoma.
A: The differential CXCL12 expression in pancreatic ductal adenocarcinoma (PDCA) and normal samples. The expression level of CXCL12 in tumor tissues is indicated in orange, and that in normal tissues is indicated in purple. Data source: UCSC XENA (https://xenabrowser.net/datapages/) RNAseq data in TPM format for The Cancer Genome Atlas (TCGA) and GTEx processed uniformly through the Toil process[4]. PAAD (pancreatic cancer) data were extracted from TCGA, and corresponding normal sample data were from GTEx. Significance markers: NS, P ≥ 0.05, aP < 0.05, bP < 0.01, cP < 0.001; B: The expression level of CXCL12 and its relationship to 24 immune cell infiltration levels in PDCA. Data source: RNAseq data and clinical data in level 3 HTSeq-FPKM format from the TCGA (https://portal.gdc.cancer.gov/) PAAD (pancreatic cancer) project. Data filtering: Removal of paraneoplastic tissue; C: The expression level of CXCL12 and its relationship to the T cell infiltration level in PDCA; D and E: Pathway analysis of differentially expressed genes under all treatment conditions (α, β, and γ CXCL12 isoforms); D: CXCL12 α isoform vs control; E: CXCL12 β isoform vs control; F: CXCL12 γ isoform vs control.
- Citation: Miao YD, Wang JT, Tang XL, Mi DH. Microarray analysis to explore the effect of CXCL12 isoforms in a pancreatic pre-tumor cell model. World J Gastroenterol 2021; 27(47): 8194-8198
- URL: https://www.wjgnet.com/1007-9327/full/v27/i47/8194.htm
- DOI: https://dx.doi.org/10.3748/wjg.v27.i47.8194


