Copyright
©The Author(s) 2021.
World J Gastroenterol. Dec 21, 2021; 27(47): 8138-8155
Published online Dec 21, 2021. doi: 10.3748/wjg.v27.i47.8138
Published online Dec 21, 2021. doi: 10.3748/wjg.v27.i47.8138
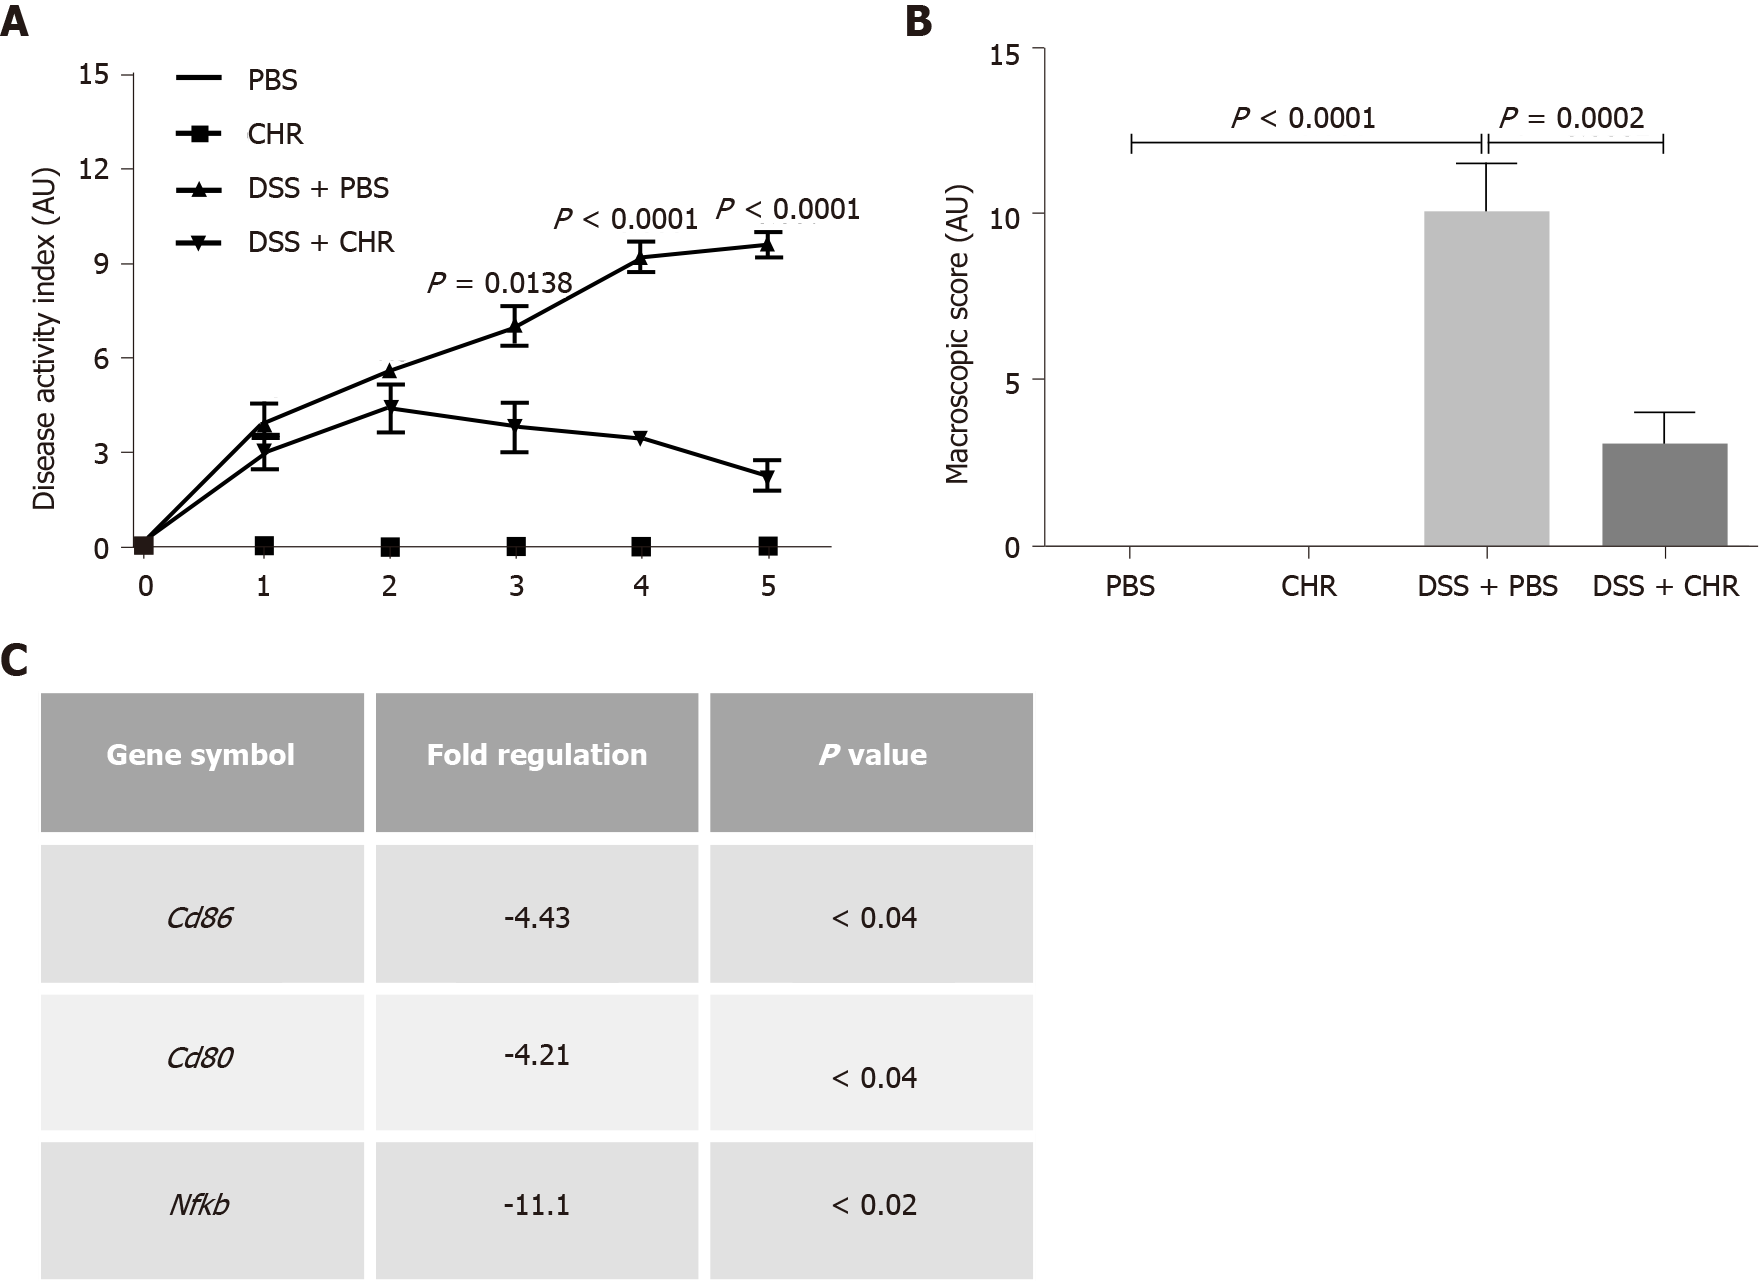
Figure 1 Chromofungin (chromogranin-A 47-66) treatment decreases dextran sulphate sodium-induced experimental colitis and colonic colonic cluster of differentiation markers and NF-κB gene expression in dextran sulphate sodium-induced experimental colitis.
Colitis was induced with 5% dextran sulphate sodium in drinking water to C57BL/6 male mice, and the control group of mice received regular drinking water. Chromofungin (2.5 mg/kg per day, i.r.) was given as a preventive treatment or phosphate buffer saline (1%) starting from one day before the induction of colitis till the fifth day when the mice were sacrificed. A-C: External disease activity index recorded over the period of 5 d (A), macroscopic scores at sacrifice day (B), CD86 and 80 and NF-κB gene expression profile by RT2 profiler PCR array at sacrifice day (C). Unpaired two-tailed Mann-Whitney U and Two-way repeated measures or One-way ANOVA followed by multiple comparison tests were used to analyze the data, and adjusted P equal to or smaller than 0.05 is believed to be significant. Each value represents the mean ± SE, n = 6 mice/group. PBS: Phosphate buffer saline; CHR: Chromofungin; DSS: Dextran sulphate sodium.
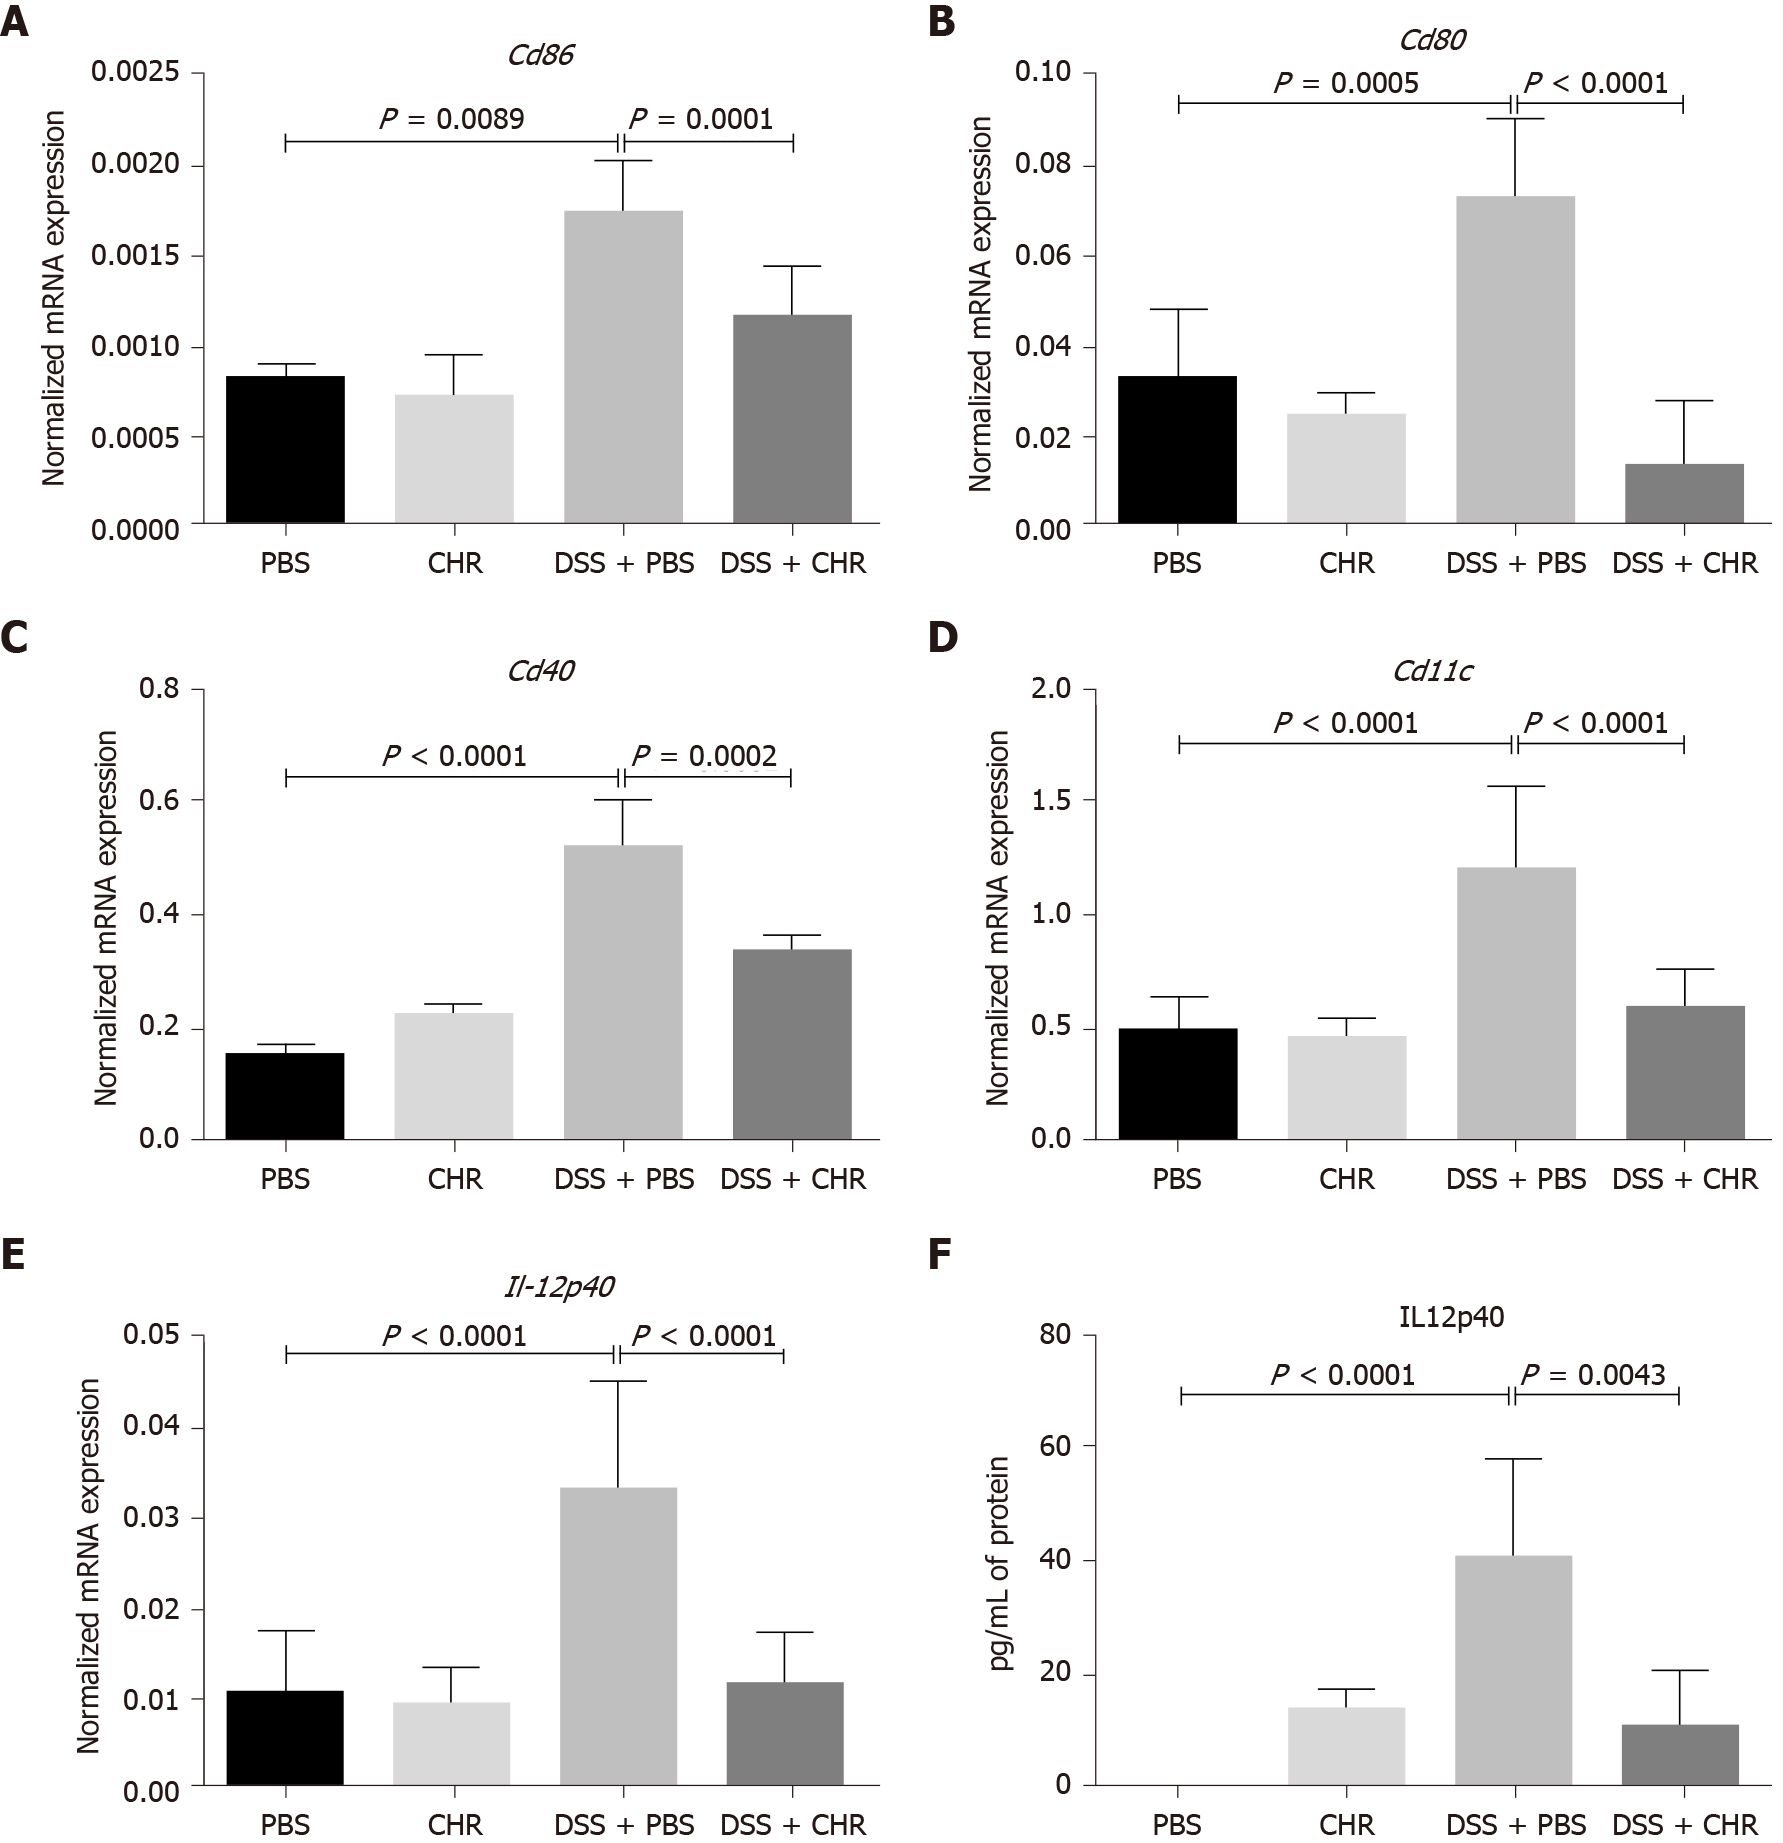
Figure 2 Chromofungin (chromogranin-A 47-66) treatment decreases colonic cluster of differentiation markers and interleukin-12 level in dextran sulphate sodium-induced experimental colitis.
Colitis was induced with 5% dextran sulphate sodium in drinking water to C57BL/6 male mice, and the control group of mice received regular drinking water. Chromofungin (2.5 mg/kg per day, i.r.) was given as a preventive treatment or phosphate buffer saline (1%) starting from one day before the induction of colitis till the fifth day when the mice were sacrificed. A-F: CD86 (A), CD80 (B), CD40 (C), CD11c (D), interleukin (IL)-12p40 mRNA expression (E), IL-12p40 protein level (F). mRNA expression was quantified by quantitative real-time reverse-transcription polymerase chain reaction and protein level by ELISA. One-way ANOVA followed by multiple comparison tests was used to analyze the data, and adjusted P equal to or smaller than 0.05 is believed to be significant. Each value represents the mean ± SE, n = 6 mice/group. PBS: Phosphate buffer saline; CHR: Chromofungin; DSS: Dextran sulphate sodium.
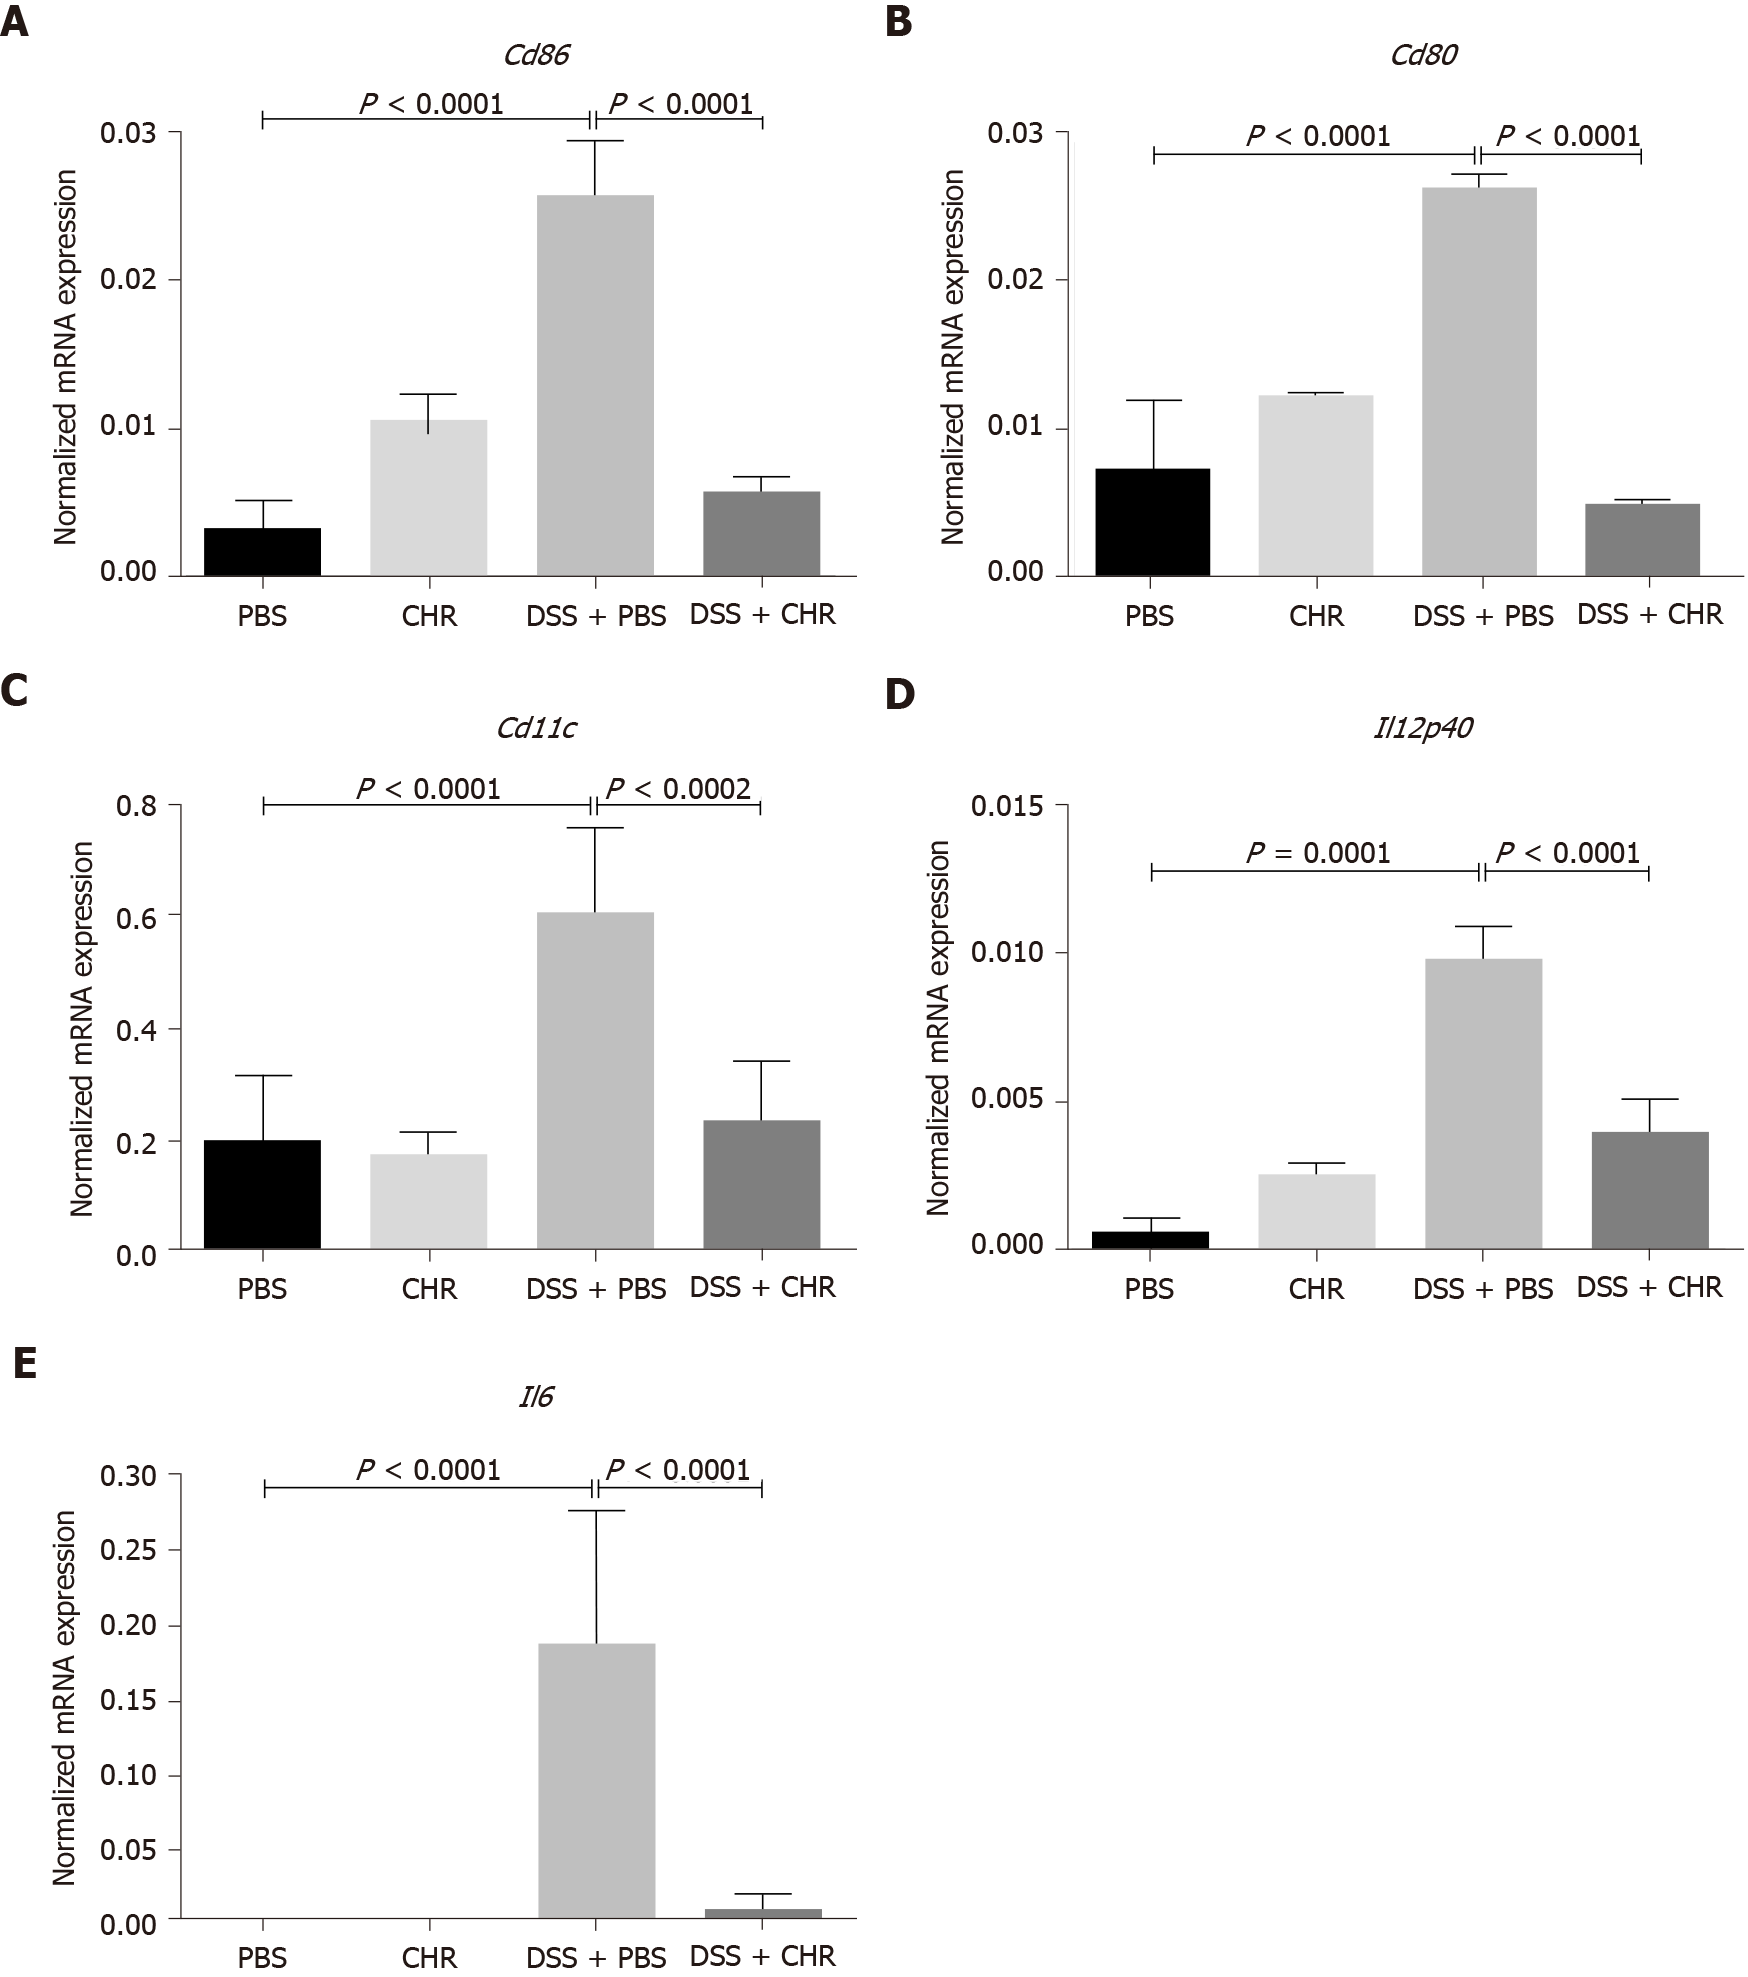
Figure 3 Chromofungin (chromogranin-A 47-66) treatment decreases mesenteric lymph node cluster of differentiation markers and cytokine levels in dextran sulphate sodium-induced experimental colitis.
Colitis was induced with 5% dextran sulphate sodium in drinking water to C57BL/6 male mice, and the control group of mice received regular drinking water. Chromofungin (2.5 mg/kg per day, i.r.) was given as a preventive treatment or phosphate buffer saline (1%) starting from one day before the induction of colitis till the fifth day when the mice were sacrificed. A-E: CD86 (A), CD80 (B), CD11c (C), interleukin (IL)-12p40 (D), IL-6 mRNA expression (E). mRNA expression was quantified by quantitative real-time reverse-transcription polymerase chain reaction. One-way ANOVA followed by multiple comparison tests was used to analyze the data, and adjusted P equal to or smaller than 0.05 is believed to be significant. Each value represents the mean ± SE, n = 6 mice/group. PBS: Phosphate buffer saline; CHR: Chromofungin; DSS: Dextran sulphate sodium.
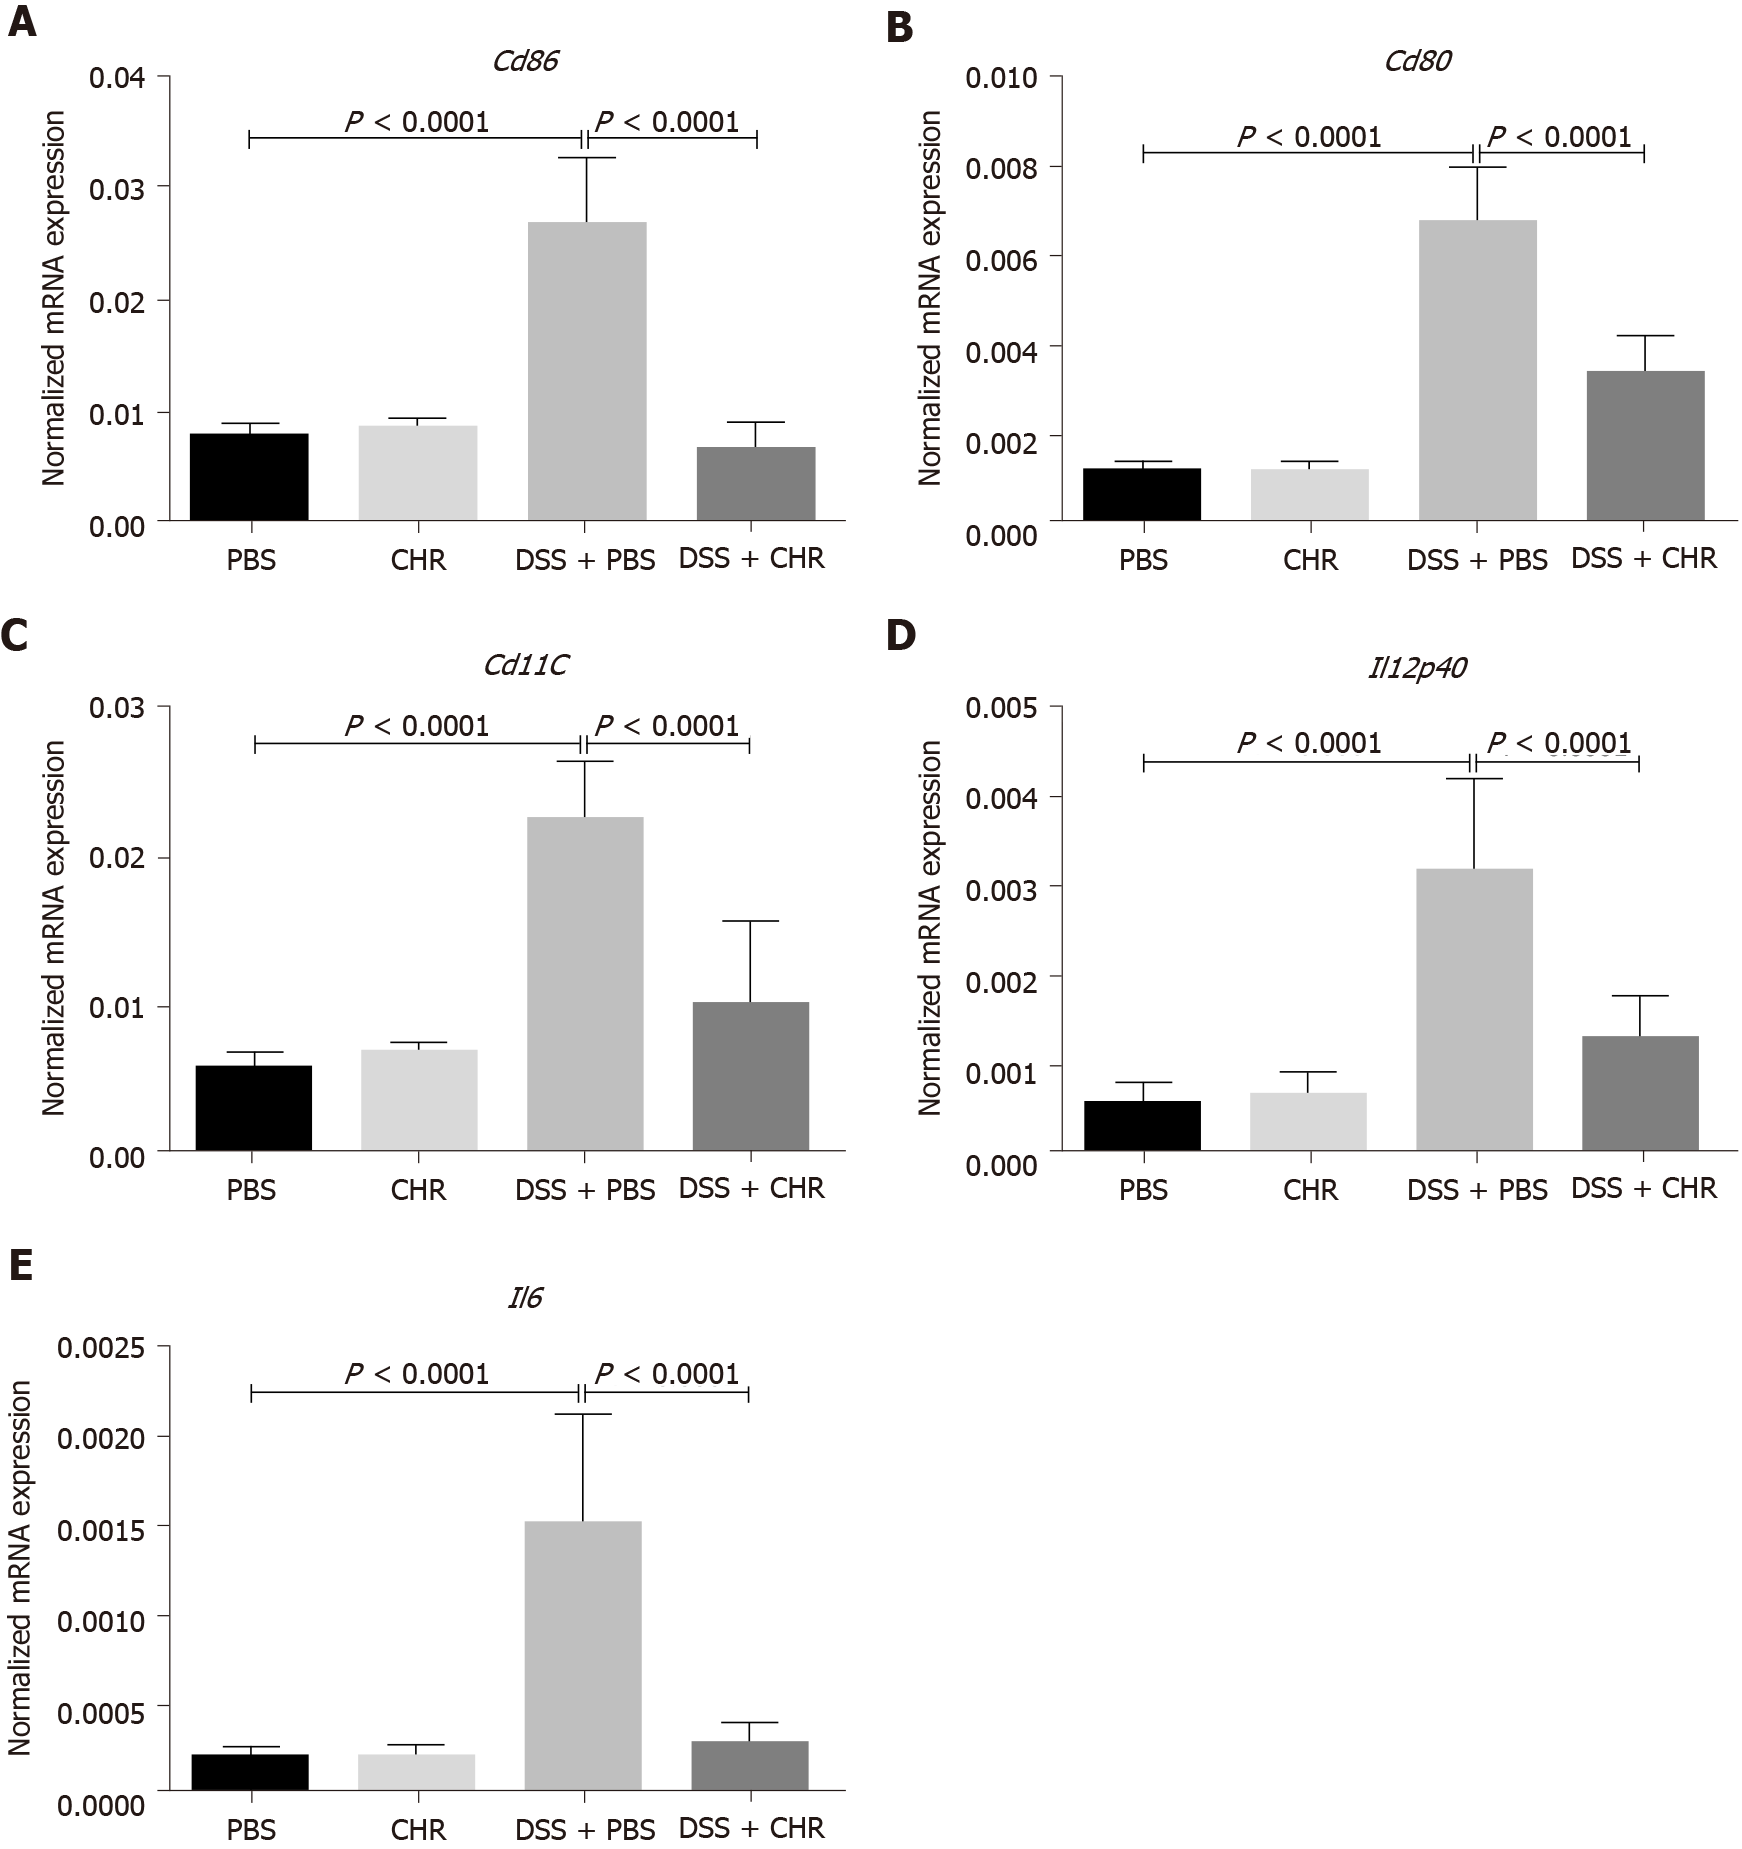
Figure 4 Chromofungin (chromogranin-A 47-66) treatment decreases splenocyte cluster of differentiation markers and interleukin-12 level in dextran sulphate sodium-induced experimental colitis.
Colitis was induced with 5% dextran sulphate sodium in drinking water to C57BL/6 male mice, and the control group of mice received regular drinking water. Chromofungin (2.5 mg/kg per day, i.r.) was given as a preventive treatment or phosphate buffer saline (1%) starting from one day before the induction of colitis till the fifth day when the mice were sacrificed. A-E: CD86 (A), CD80 (B), CD11c (C), interleukin (IL)-12p40 (D), IL-6 mRNA expression (E) from splenic cells. mRNA expression was quantified by quantitative real-time reverse-transcription polymerase chain reaction. One-way ANOVA followed by multiple comparison tests was used to analyze the data, and adjusted P equal to or smaller than 0.05 is believed to be significant. Each value represents the mean ± SE, n = 6 mice/group. PBS: Phosphate buffer saline; CHR: Chromofungin; DSS: Dextran sulphate sodium.
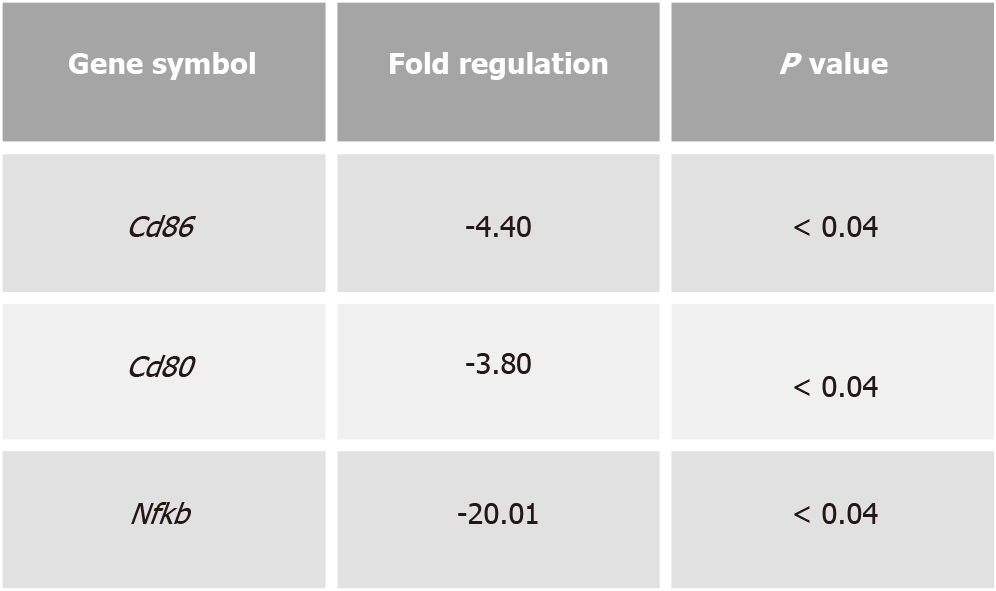
Figure 5 Chromofungin (chromogranin-A 47-66) treatment decreases dextran sulphate sodium-induced experimental colitis and colonic cluster of differentiation markers and NF-κB gene expression in dextran sulphate sodium-induced experimental colitis.
CD86 and 80 and NF-κB gene expression profile by RT2 profiler polymerase chain reaction array at sacrifice day. One-way ANOVA followed by multiple comparison tests were used to analyze the data, and adjusted P equal to or smaller than 0.05 is believed to be significant. Each value represents the mean ± SE, n = 6 mice/group.
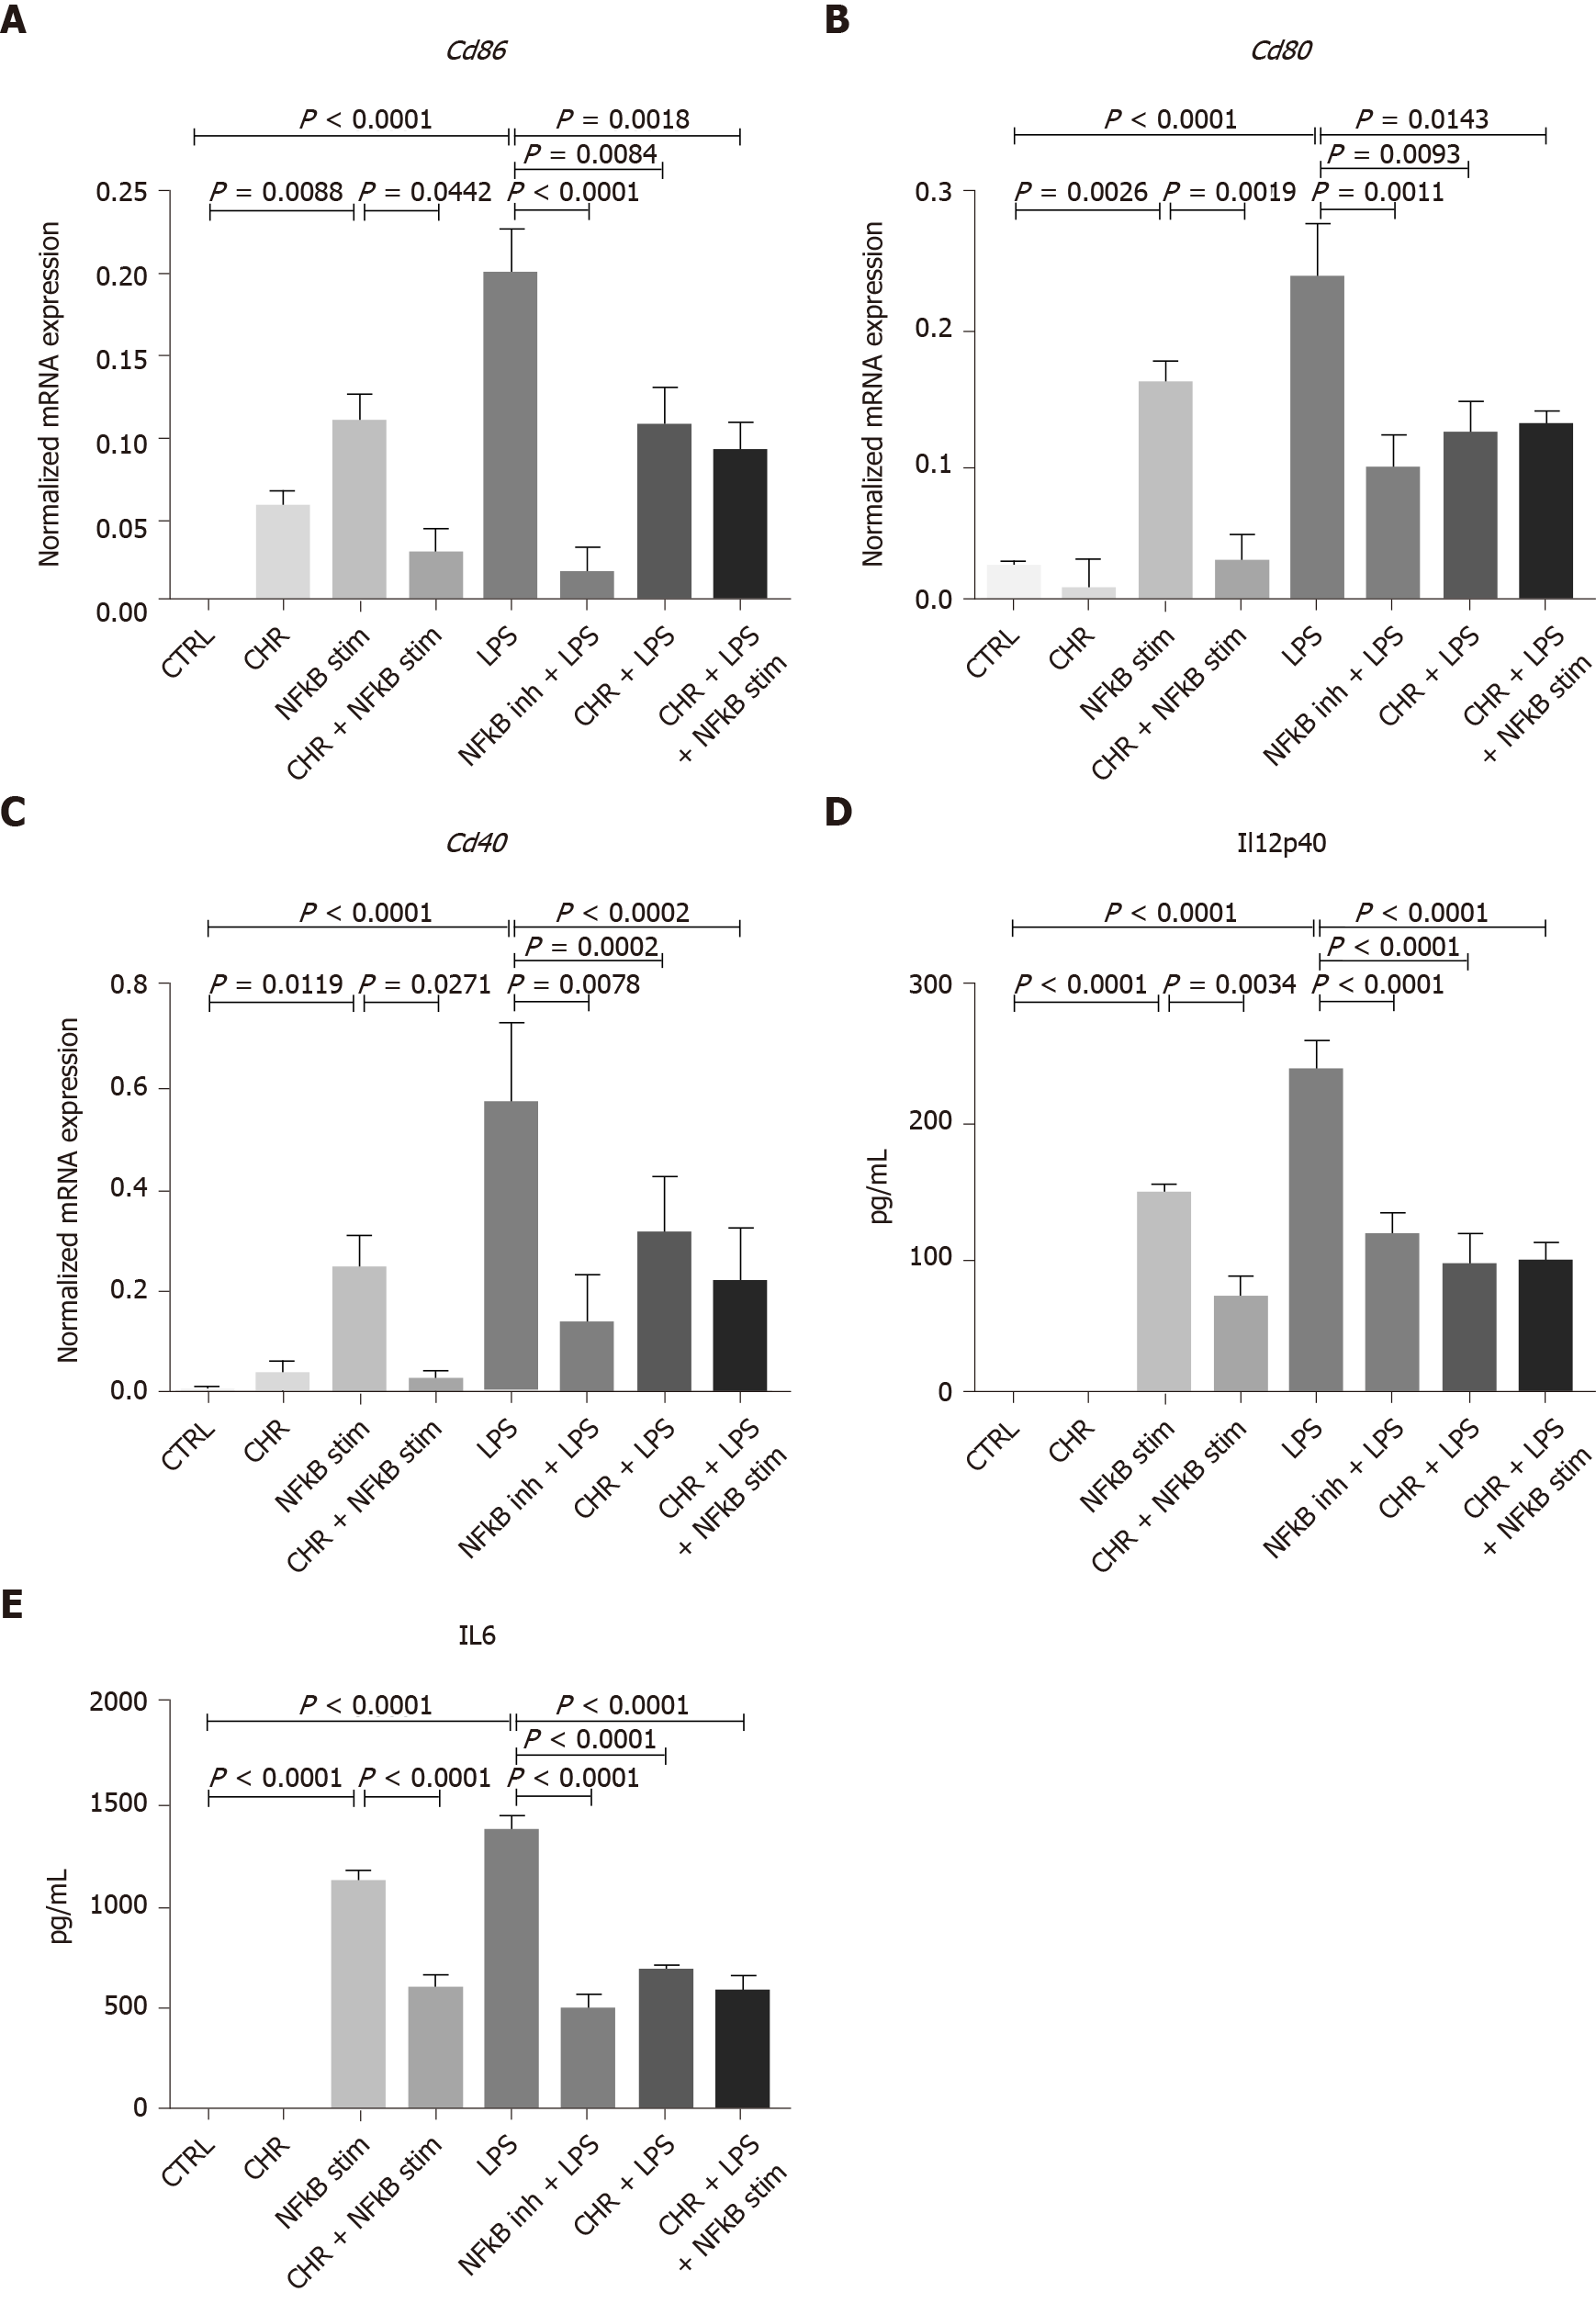
Figure 6 Chromofungin (chromogranin-A 47-66) treatment decreases lipopolysaccharide-stimulated bone marrow-derived CD11c+ cells' cluster of differentiation markers and cytokine-associated level via the NF-κB pathways.
Bone marrow-derived CD11c+ cells using MACS technique were isolated and cultured with granulocyte-macrophage induced colony-stimulating factor for 8 d until full maturation. Cells were treated with CHR (10-6 M/mL) for 12 h and then stimulated with lipopolysaccharide (100 ng/mL) in the presence or absence of NF-κB activator/stimulator (10 u/mL) for 24 h. A-E: CD86 (A), CD80 (B), CD40 (C), mRNA expression and IL-12p40 (D), IL-6 (E) medium protein level. mRNA expression was quantified by quantitative real-time reverse-transcription polymerase chain reaction and protein levels were quantified by ELISA. One-way ANOVA followed by multiple comparison tests was used to analyze the data, and adjusted P equal to or smaller than 0.05 is believed to be significant. Each value represents the mean ± SE, n = 6 mice/group. LPS: Lipopolysaccharide; CHR: Chromofungin.
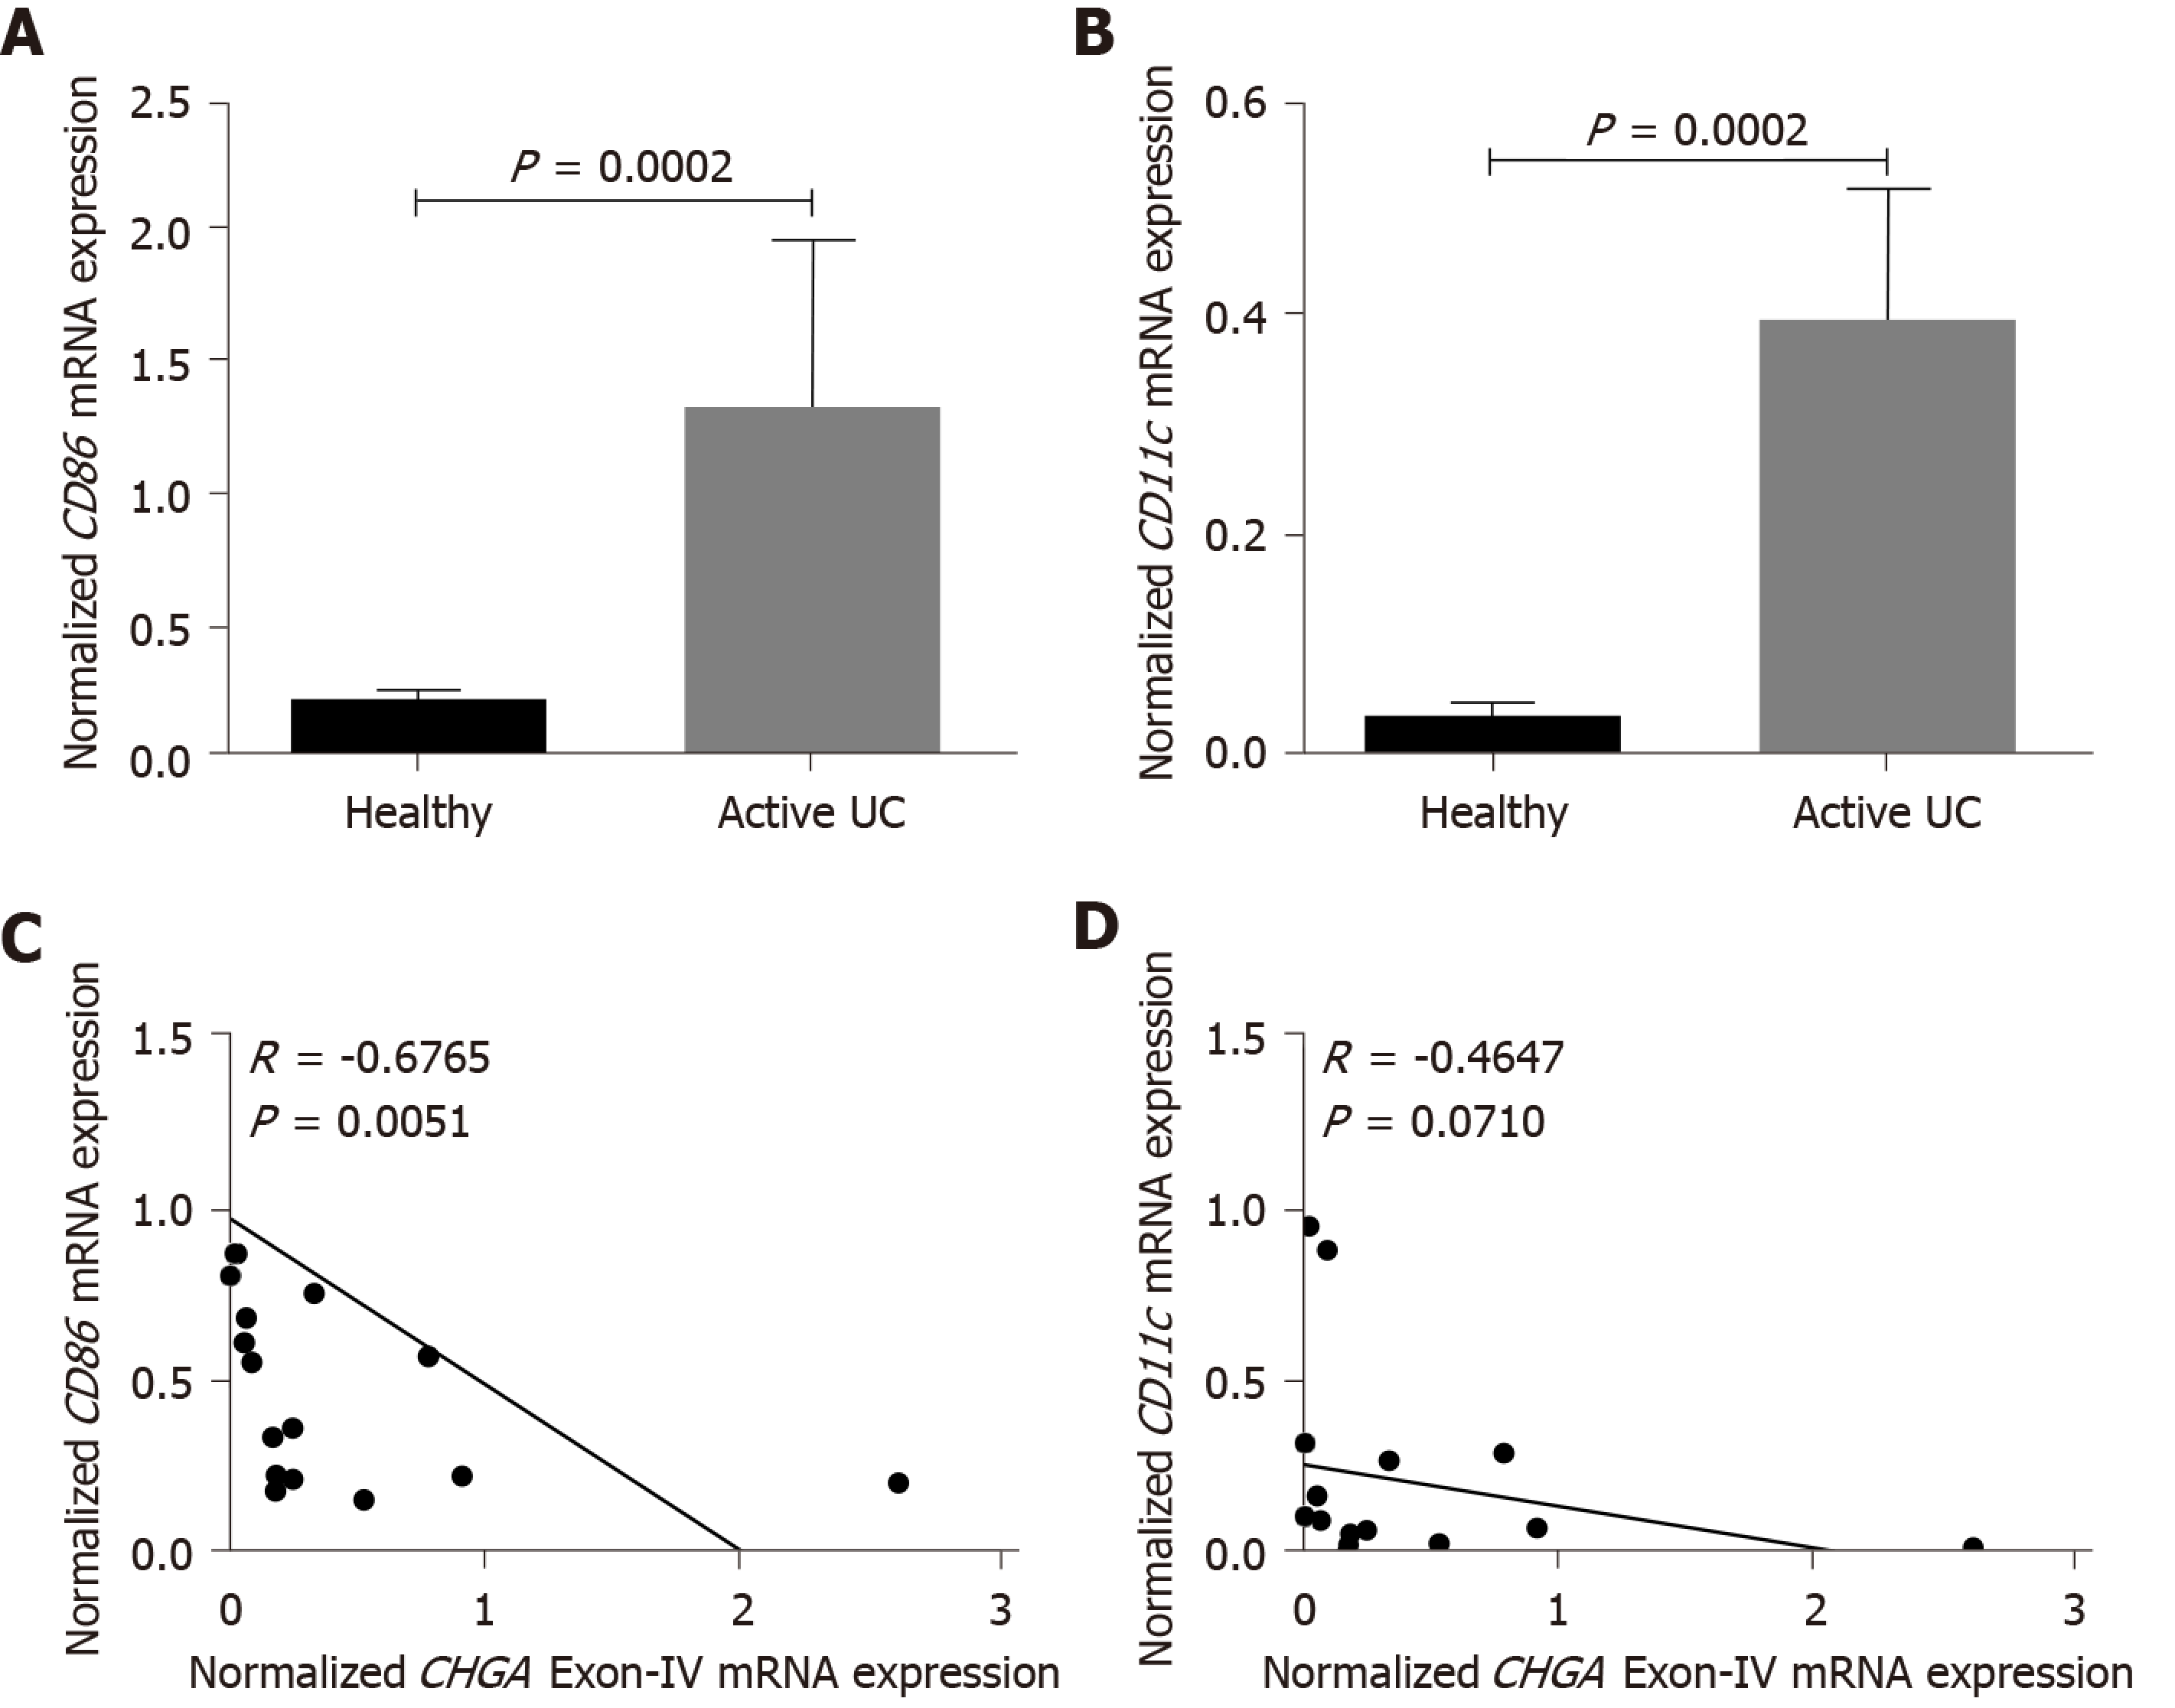
Figure 7 Chromofungin (CHGA Exon-IV) correlates negatively with cluster of differentiation 86 and 80 mRNA expression.
A: mRNA expression of CD86 in the colonic tissue of healthy individuals (n = 10) and participants with active ulcerative colitis (UC) (n = 10); B: Correlation analysis between biopsy CHGA Exon IV and CD86 mRNA expression; C: mRNA expression of CD80 in the colonic tissue of healthy individuals (n = 10) and participants with active UC (n = 10); D: Correlation analysis between biopsy CHGA Exon IV and CD80 mRNA expression. mRNA expression was quantified by quantitative real-time reverse-transcription polymerase chain reaction. Student t-test and Mann-Whitney test and Spearman's correlation were used to analyze, and adjusted P equal to or smaller than 0.05 is believed to be significant. UC: Ulcerative colitis.
- Citation: Kapoor K, Eissa N, Tshikudi D, Bernstein CN, Ghia JE. Impact of intrarectal chromofungin treatment on dendritic cells-related markers in different immune compartments in colonic inflammatory conditions. World J Gastroenterol 2021; 27(47): 8138-8155
- URL: https://www.wjgnet.com/1007-9327/full/v27/i47/8138.htm
- DOI: https://dx.doi.org/10.3748/wjg.v27.i47.8138


