Copyright
©The Author(s) 2021.
World J Gastroenterol. Dec 14, 2021; 27(46): 7894-7908
Published online Dec 14, 2021. doi: 10.3748/wjg.v27.i46.7894
Published online Dec 14, 2021. doi: 10.3748/wjg.v27.i46.7894
Figure 1 Arterial-portal vein shunt of 40th male.
A: Pre contrast enhanced computed tomography (CT) of the liver shows no definite focal liver mass in segment V of the right lobe. B: On arterial phase contrast enhanced CT image, wedge shaped focal enhanced area is observed in peripheral part of segment V of the liver (*). Well opacified portal vein branch is observed within the focal enhanced area (arrow). C: On equilibrium phase of contrast enhanced CT, there are no attenuation differences in the peripheral part of segment V of the liver. Therefore, focal enhanced area observed in arterial phase contrast enhanced CT image is diagnosed as transient hepatic attenuation difference.
Figure 2 Hereditary hemorrhagic telangiectasia of 70th male.
On arterial phase contrast enhanced computed tomography of the liver, there are multiple pathy attenuated areas throughout the liver. Which are multiple transient hepatic attenuation difference caused by multiple arterial-portal venous shunts in hereditary hemorrhagic telangiectasia.
Figure 3 Extrahepatic portal obstruction of 30th female.
A: Pre contrast enhanced computed tomography (CT) of the liver shows no definite focal liver lesion. B: On arterial phase contrast enhanced CT of the liver, there are multiple pathy attenuated areas in the subcapsular peripheral portion of the liver (arrow). C: On equilibrium phase contrast enhanced CT of the liver, there are no attenuation differences in the peripheral part of the liver.
Figure 4 Portal vein tumor thrombus of gastric cancer in 70th male.
A: Pre contrast enhanced computed tomography (CT) of the liver shows no definite focal liver lesion. Wall thickening on the lesser curvature side of the stomach caused by gastric cancer is observed (*). B: On arterial phase contrast enhanced CT image, focal segmental enhanced area is observed in the right lobe of the liver (*). There is hypovascular tumor thrombus within the right portal vein (arrow). C: On equilibrium phase contrast enhanced CT of the liver, there are no attenuation differences in the liver.
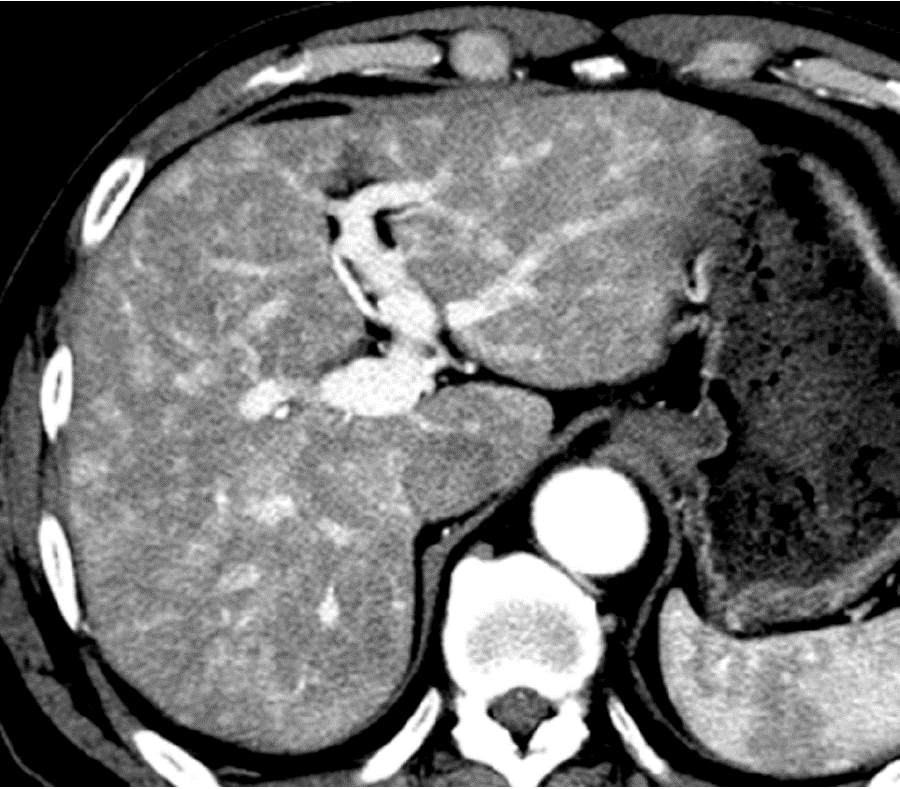
Figure 5 Acute Budd-Chiari syndrome of 20th female.
A: Pre contrast enhanced computed tomography (CT) of the liver shows no definite focal liver lesion in the liver. B: On portal phase contrast enhanced CT image, Irregular reticular hypo-enhancement is observed in the liver, which is caused by congestive change induced by hepatic outflow obstruction of Budd-Chiari syndrome. C: On equilibrium phase contrast enhanced CT of the liver, although intrahepatic parenchymal attenuation differences of the liver in the left lobe of the liver have disappeared, minimal attenuation differences are still observed in the right lobe of the liver.
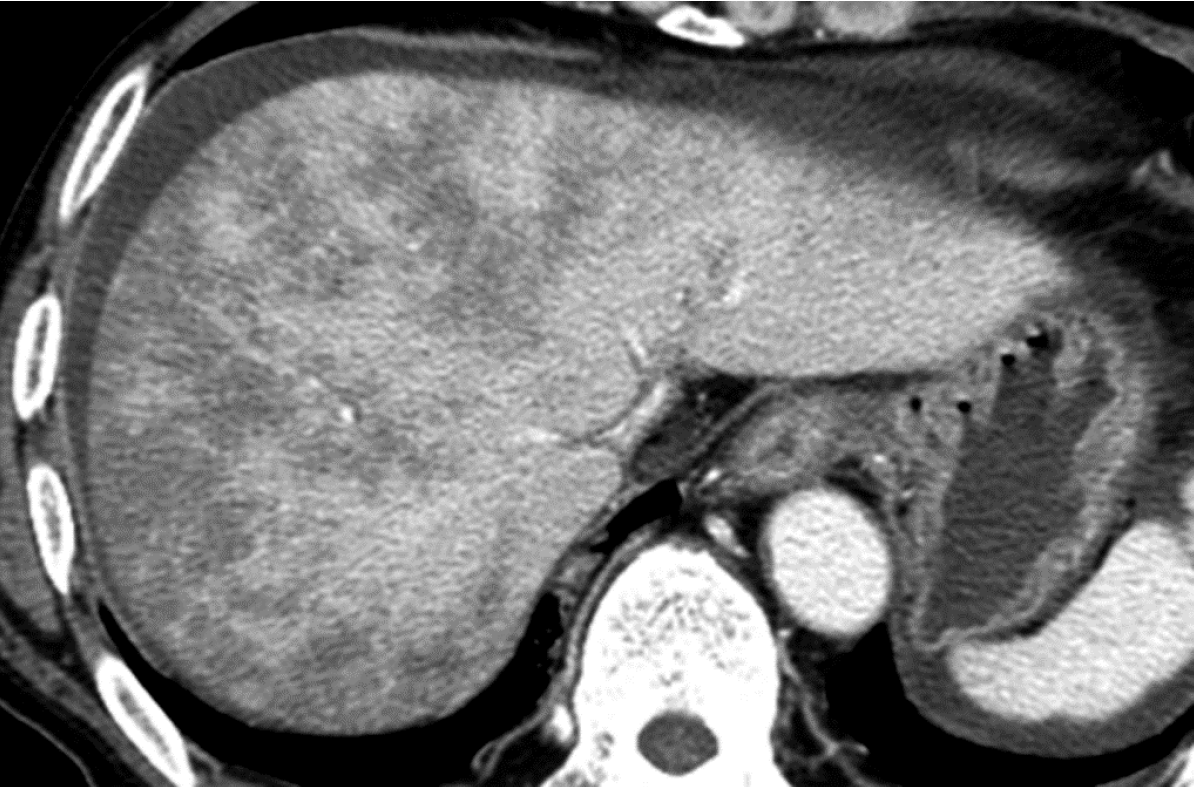
Figure 6 Sinusoidal obstruction syndrome after umbilical cord blood transplantation to acute myelocytic leukemia in 60th male.
Portal phase image of contrast enhanced computed tomography shows irregular reticular hypodensity which are caused by hepatic congestion caused by sinusoidal portal flow disturbance.
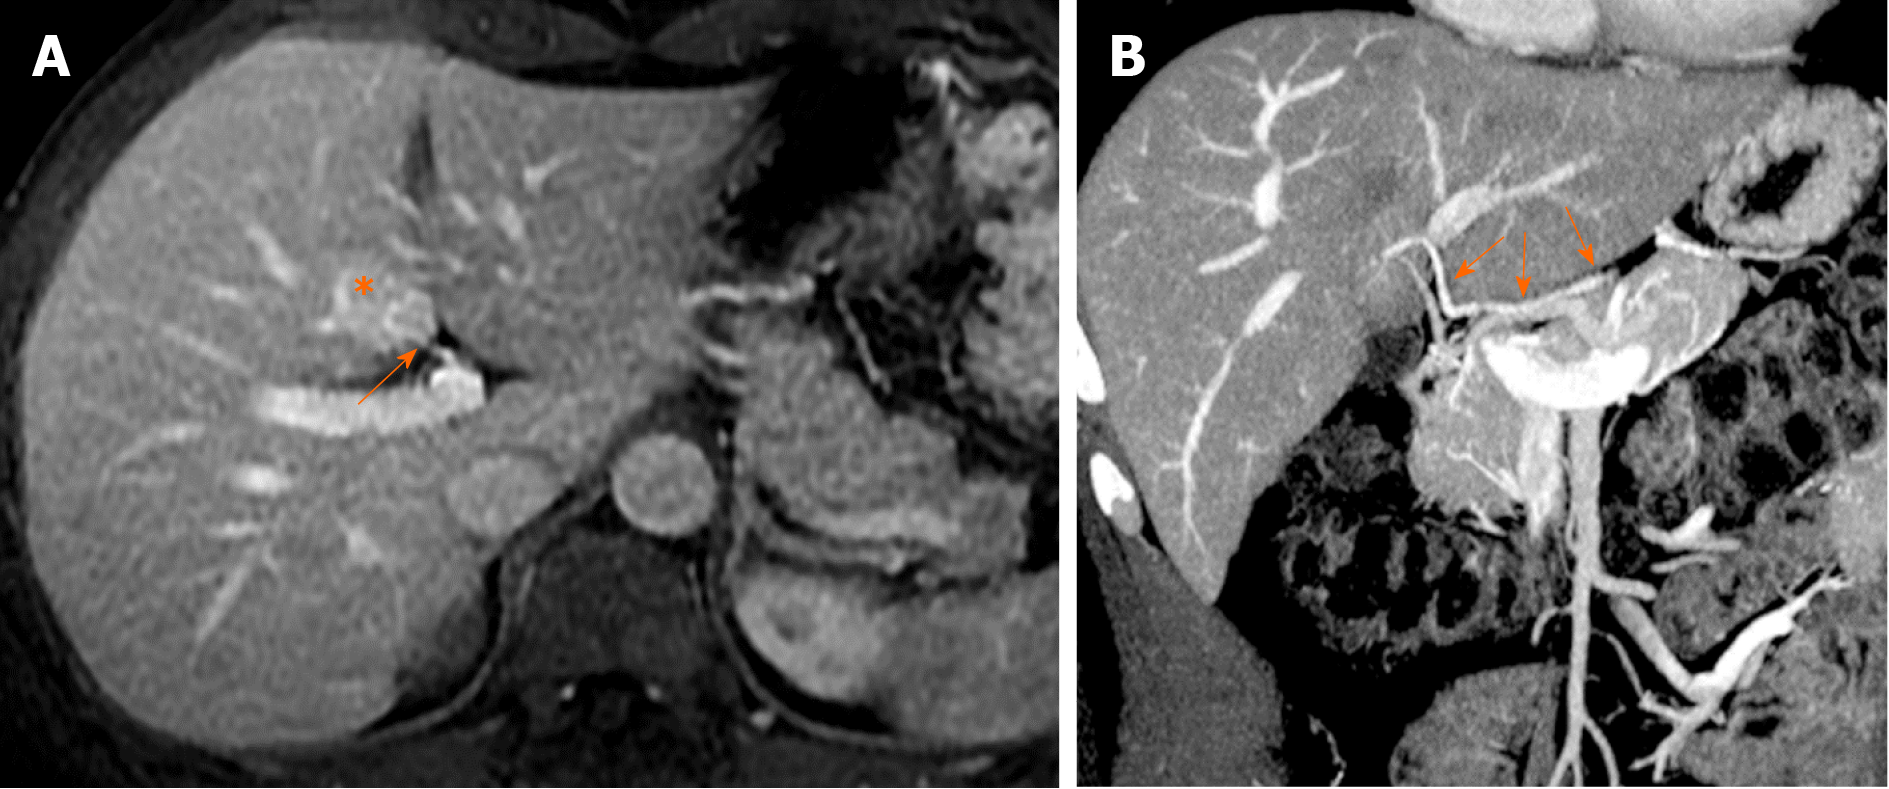
Figure 7 Hypervascular pseudolesion observed in posterior aspect of segment IV (50th male).
A: On portal phase image of contrast enhanced magnetic resonance imaging with Gadolinium based contrast agent, focal hyper-attenuation area is observed in posterior aspect of segment IV of the liver (*). Tiny vascular branch is directly entering the area at hepatic hilum, which is an aberrant right gastric vein directly entering to the liver (arrow). B: On coronal reconstruction of portal phase image of contrast enhanced computed tomography, aberrant right gastric vein directly enters the posterior aspect of segment IV of the liver without fusion to the main portal vein (arrows).
Figure 8 Hypervascular pseudolesion observed in posterior aspect of segment II (40th female).
A-C: On arterial phase images of contrast enhanced computed tomography, tiny focal hyper-attenuation area is observed in posterior aspect of segment II of the liver (*). Tiny vascular branch is directly entering the area from outside of the liver, which is an aberrant left gastric vein directly entering to the liver (arrows).
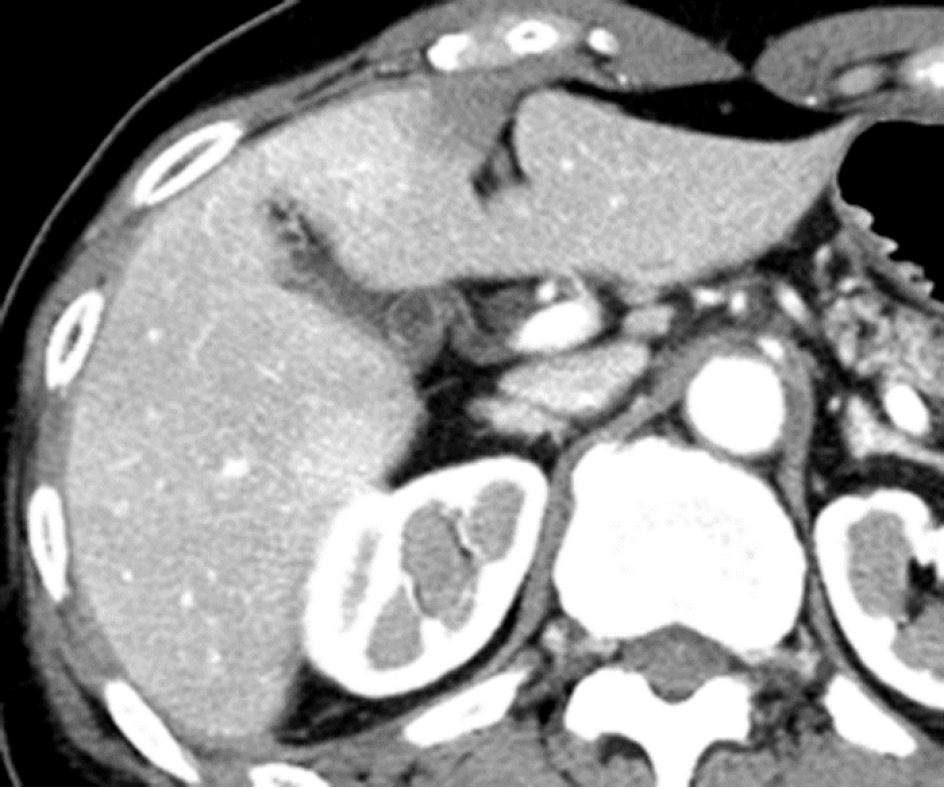
Figure 9 Hypovascular pseudolesion in the drainage area of the vein of Sappey (70th female).
On arterial phase contrast enhanced computed tomography (CT) image, focal hypoattenuation area is observed in anterior portion of segment IV of the liver adjacent to the falciform ligament, which is not detected on both pre-contrast CT and equilibrium phase contrast enhanced CT (images are not shown). This is hypovascular pseudolesion in the drainage area of the vein of Sappey.
Figure 10 Hypervascular pseudolesion in cholecystic venous drainage area (50th male).
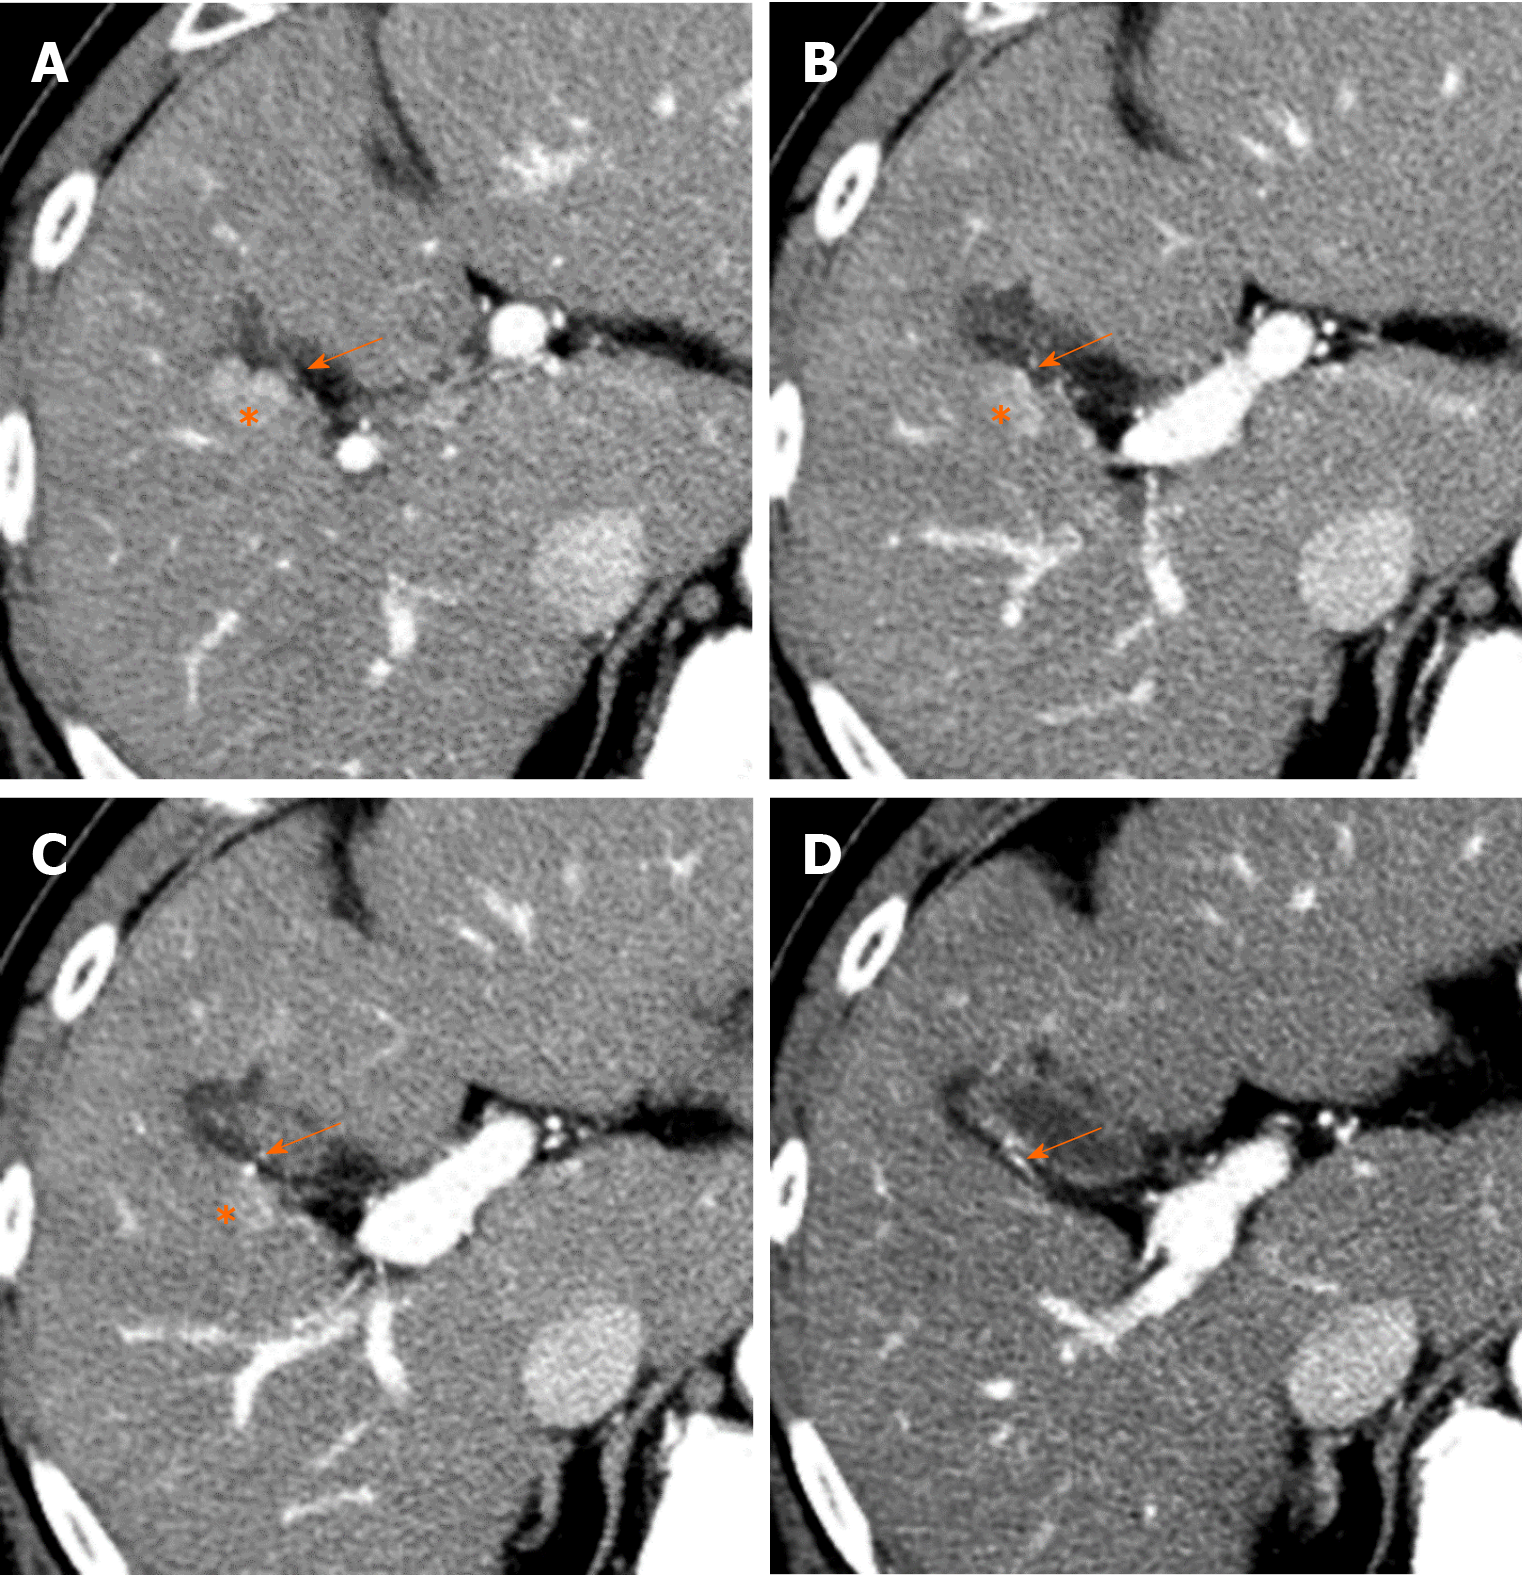
A-D: On sequential images of arterial phase contrast enhanced computed tomography, round hyper-attenuation area is observed in segment V of the liver adjacent to the gallbladder (*). Tiny enhanced vessel is directly entered to the enhanced liver area from the gallbladder wall (arrows), which is cholecystic venous drainage to the liver and hypervascular pseudolesion in cholecystic venous drainage area.
Figure 11 Focal hyperplastic change in posterior aspect of segment IV (70th male).
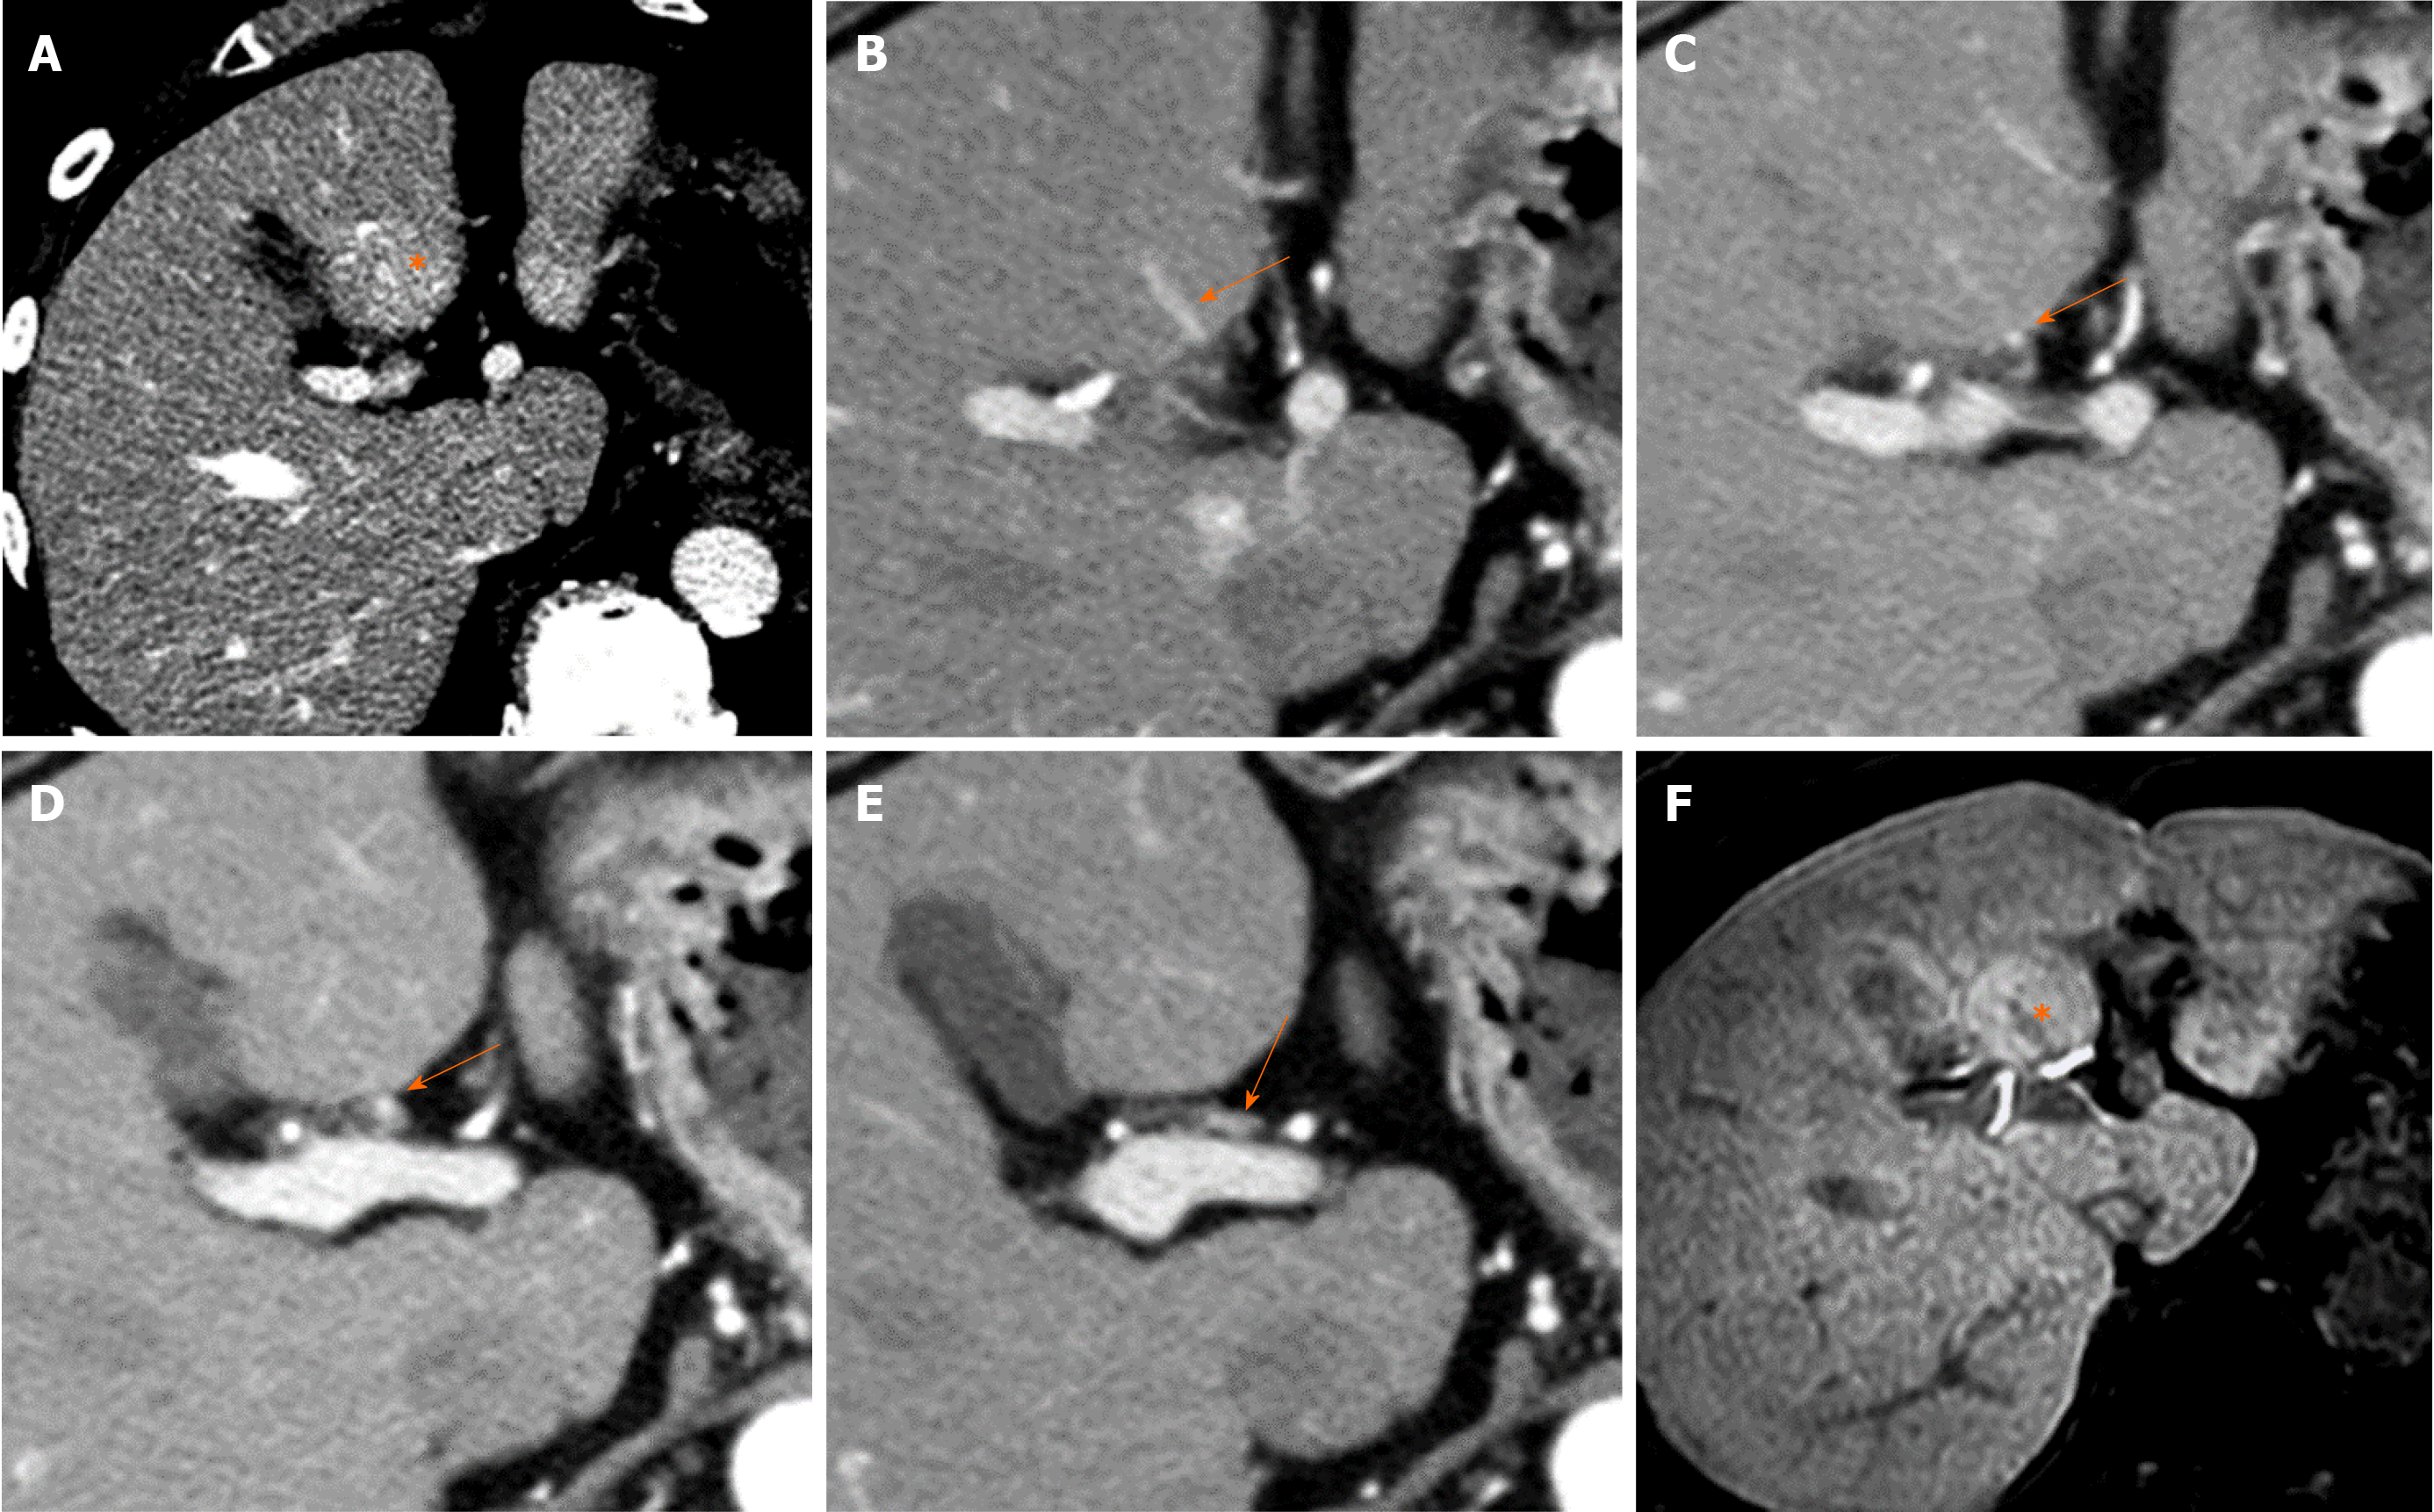
A: On the portal phase contrast enhanced computed tomography (CT) image, focal hyper-attenuation area is observed in the posterior aspect of segment IV of the liver (*), which is not detected on both pre-contrast CT and equilibrium phase contrast enhanced CT (images are not shown). This is hypervascular pseudolesion observed in the area of aberrant right gastric venous drainage to the liver. B-E: On sequential images of arterial phase contrast enhanced CT, aberrant right gastric vein directly entering to the posterior aspect of segment IV of the liver is well opacified (arrows). F: On hepatobiliary phase of Gd-EOB-DTPA enhanced magnetic resonance imaging, slightly hyper-intensity area is observed in the same place of focal hyper-attenuation area observed in the portal phase contrast enhanced CT image (*), which represents focal hyperplasetic change of the liver in aberrant right gastric venous drainage area in the posterior aspect of segment IV.
Figure 12 Focal hyperplastic change in cholecystic venous drainage area (50th male).
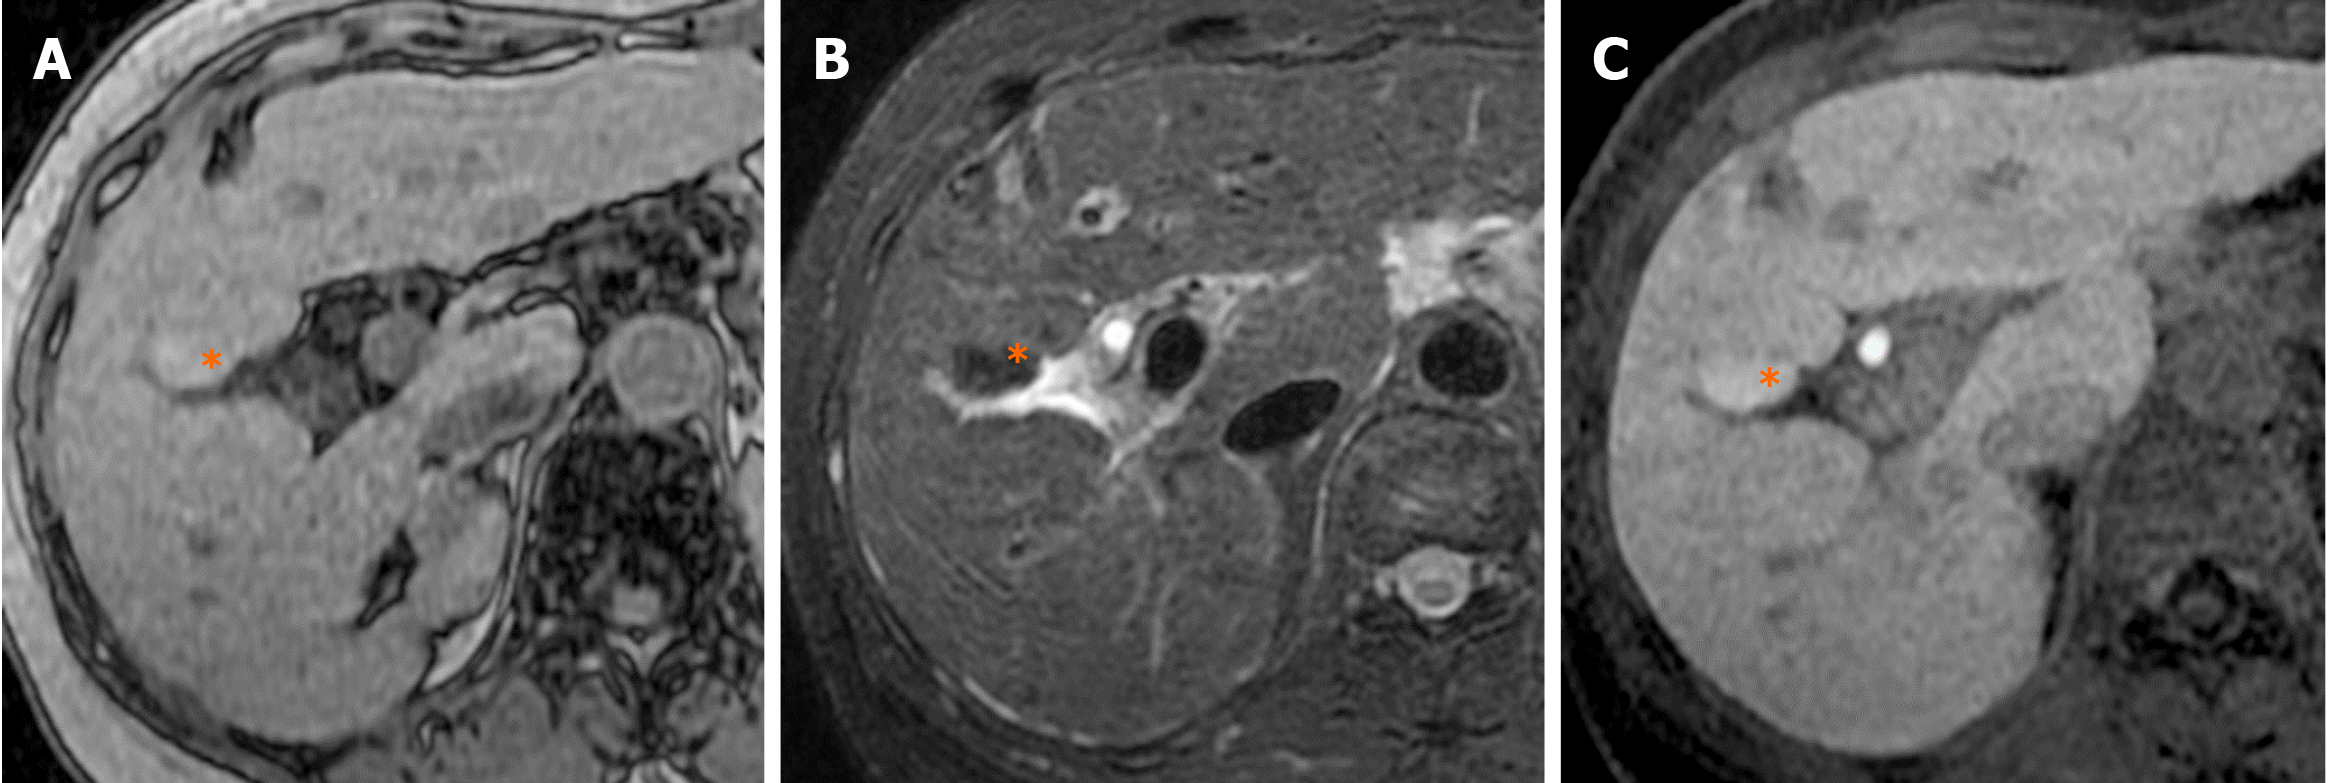
A: On T1 weighted opposed-phase magnetic resonance (MR) image, focal hyperintense lesion is observed at segment IV of the liver adjacent to the gallbladder (*). B: The focal lesion shows hypointensity on fat suppressed T2 weighted MR image (*). C: The focal lesion shows hyperintensity on hepatobiliary phase of Gd-EOB-DTPA enhanced magnetic resonance imaging (*). These findings observed at segment IV of the liver adjacent to the gallbladder represent focal hyperplastic change of the liver in cholecystic venous drainage area.
Figure 13 Focal fat deposition in posterior aspect of segment IV (50th female).
A: On pre-contrast enhanced computed tomography (CT), focal hypodense lesion is observed at the posterior aspect of segment IV of the liver (*). B: On arterial phase contrast enhanced CT image, the lesion shows hypodense (*) and an enhanced vascular branch is directly entering the area at hepatic hilum (arrow). C: On three-dimensional reconstructed CT image with contrast enhancement, an aberrant right gastric vein directly drains into the posterior aspect of segment IV of the liver without connecting the main portal vein is observed (arrows).
Figure 14 Focal fat deposition in the drainage area of the vein of Sappey (60th female).
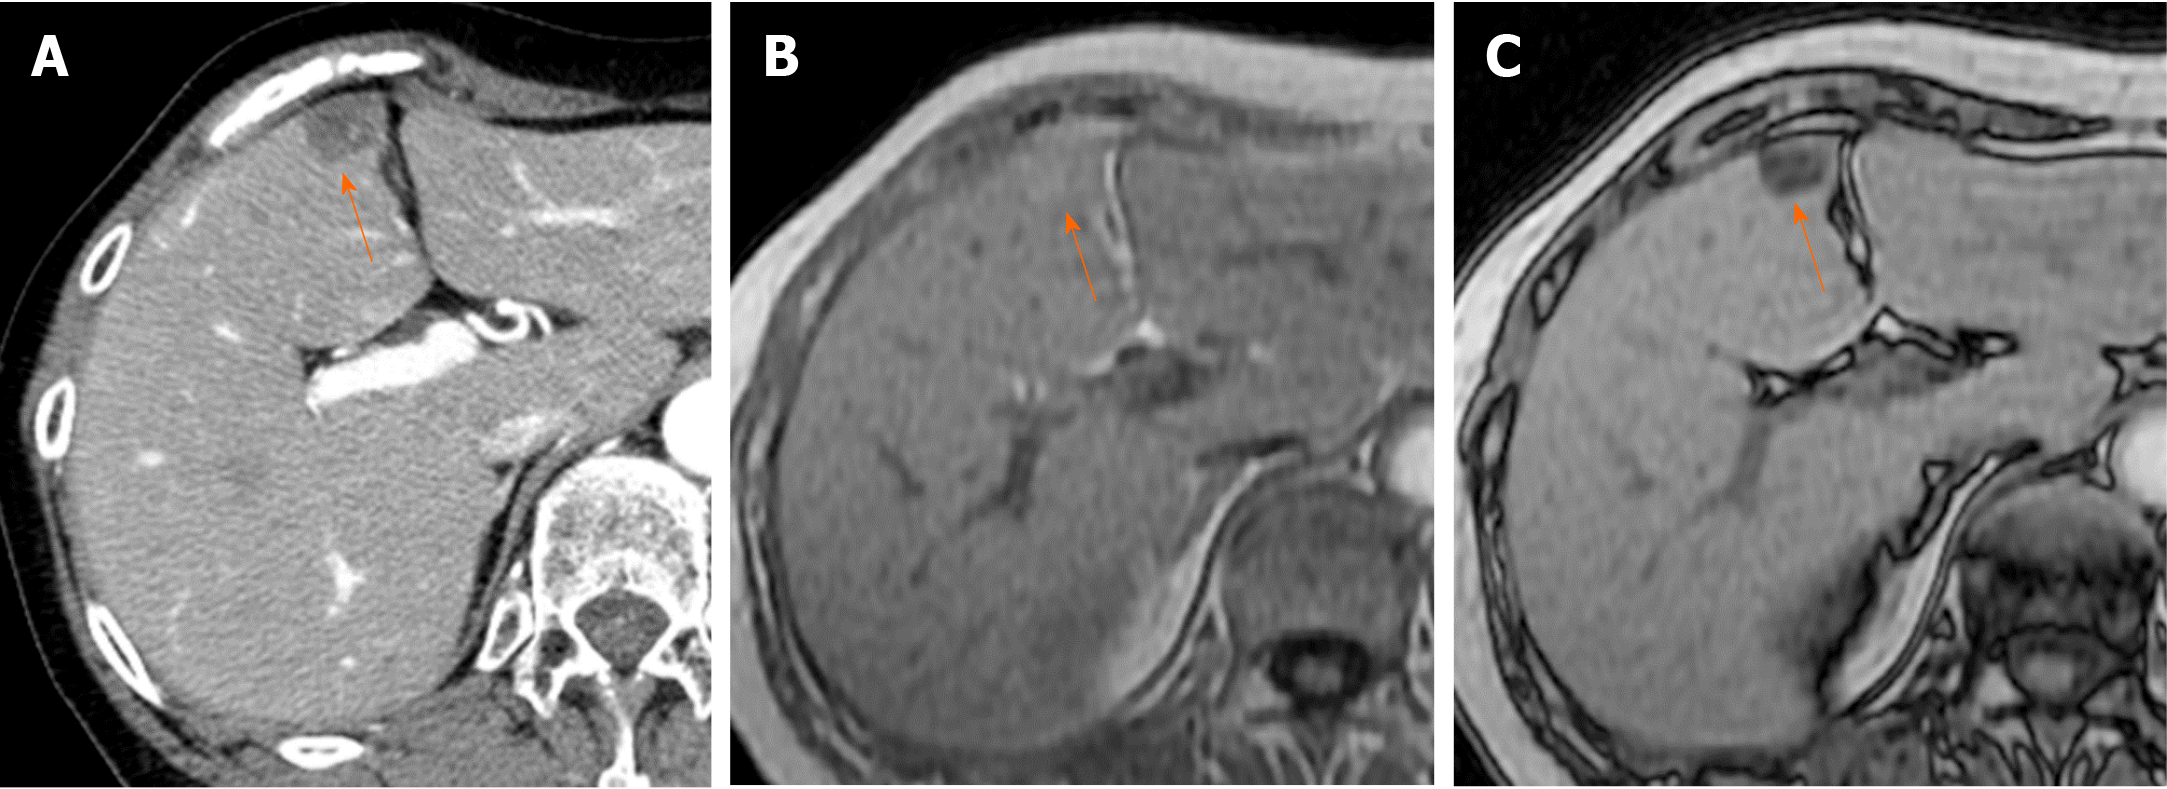
A: On arterial phase contrast enhanced computed tomography image, focal hypoattenuation area is observed in anterior portion of segment IV of the liver adjacent to the falciform ligament (arrow). B and C: On T1 weighted in-phase and opposed-phase image of the liver, the lesion shows hyperintense on in-phase (B, arrow) and shows hypointense on opposed-phase (C, arrow), which represent focal fat deposition of the liver at the drainage area of inferior vein of Sappey.
Figure 15 Focal spared area of fatty liver in posterior aspect of segment IV (40th female).
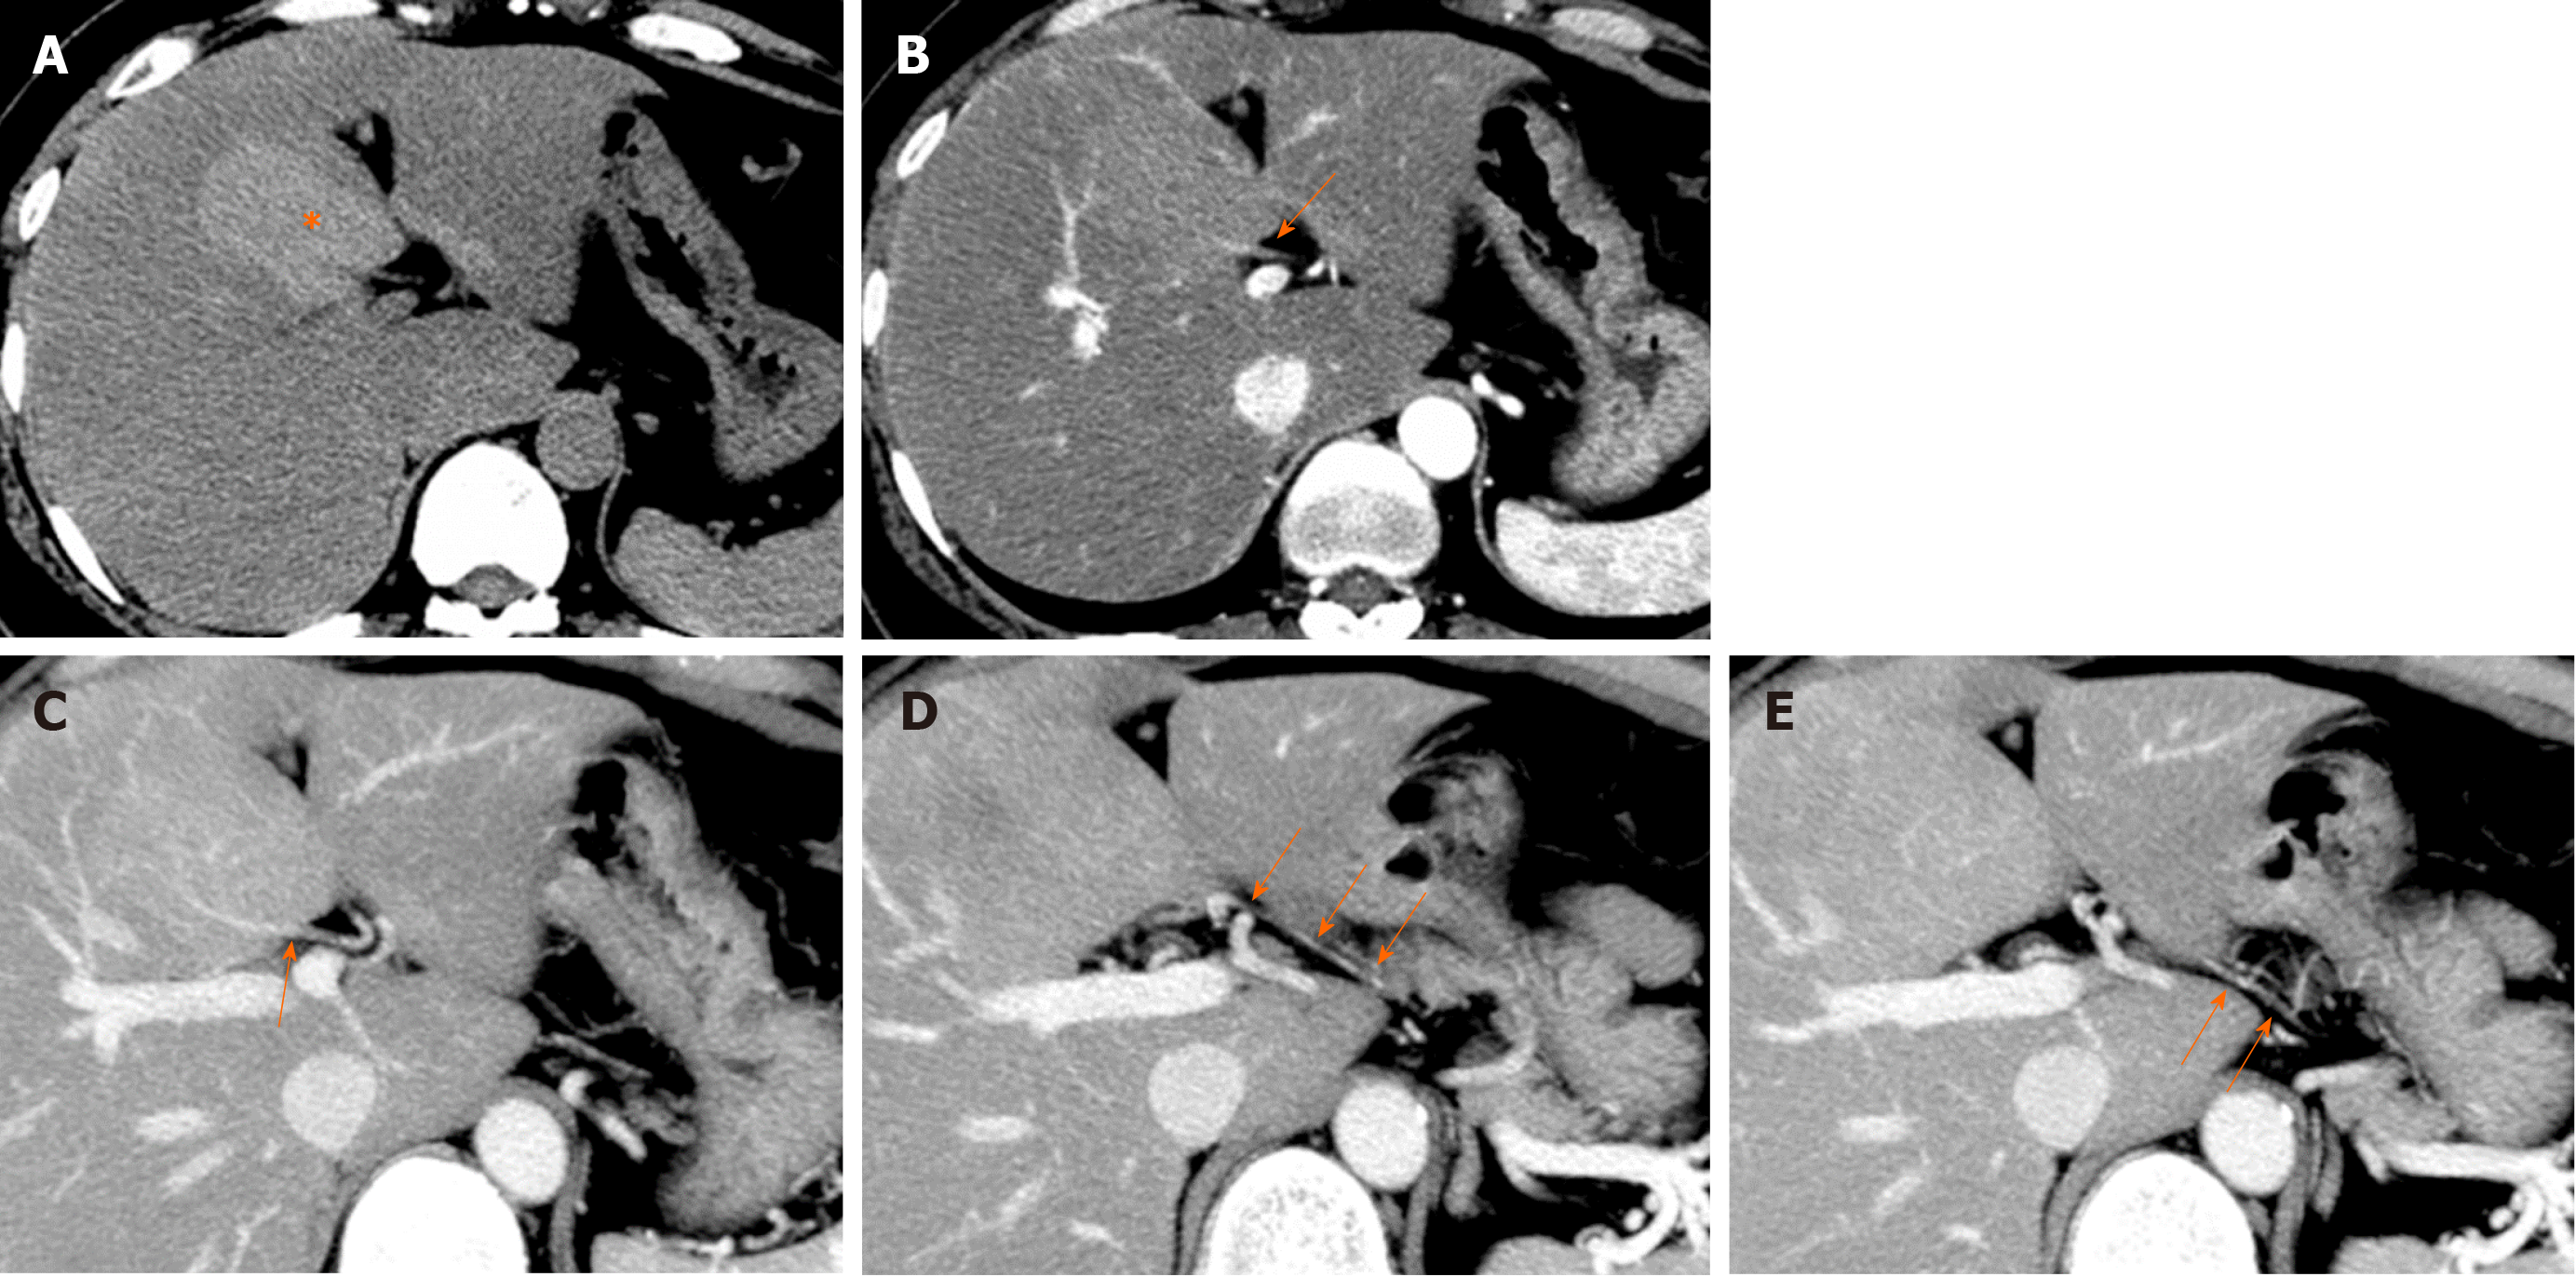
A: On pre-contrast enhanced computed tomography (CT), a focal hyperdense lesion compared to the background liver parenchyma is observed in posterior aspect of segment IV of the liver (*). Background liver shows decreased density and suggestive of fatty liver and hyperdese area is diagnosed as focal sparing of fatty liver. B: On arterial phase contrast enhanced CT image, an enhanced vascular branch is directly entering the area at hepatic hilum (arrow). C-E: On sequential images of arterial phase contrast enhanced CT, aberrant right gastric vein directly entering to the posterior aspect of segment IV of the liver is well opacified (arrows). These findings represent focal spared area of the fatty liver in aberrant right gastric venous drainage area of the liver at the posterior aspect of segment IV of the liver.
- Citation: Kobayashi S. Hepatic pseudolesions caused by alterations in intrahepatic hemodynamics. World J Gastroenterol 2021; 27(46): 7894-7908
- URL: https://www.wjgnet.com/1007-9327/full/v27/i46/7894.htm
- DOI: https://dx.doi.org/10.3748/wjg.v27.i46.7894


