Copyright
©The Author(s) 2021.
World J Gastroenterol. Dec 14, 2021; 27(46): 7866-7893
Published online Dec 14, 2021. doi: 10.3748/wjg.v27.i46.7866
Published online Dec 14, 2021. doi: 10.3748/wjg.v27.i46.7866
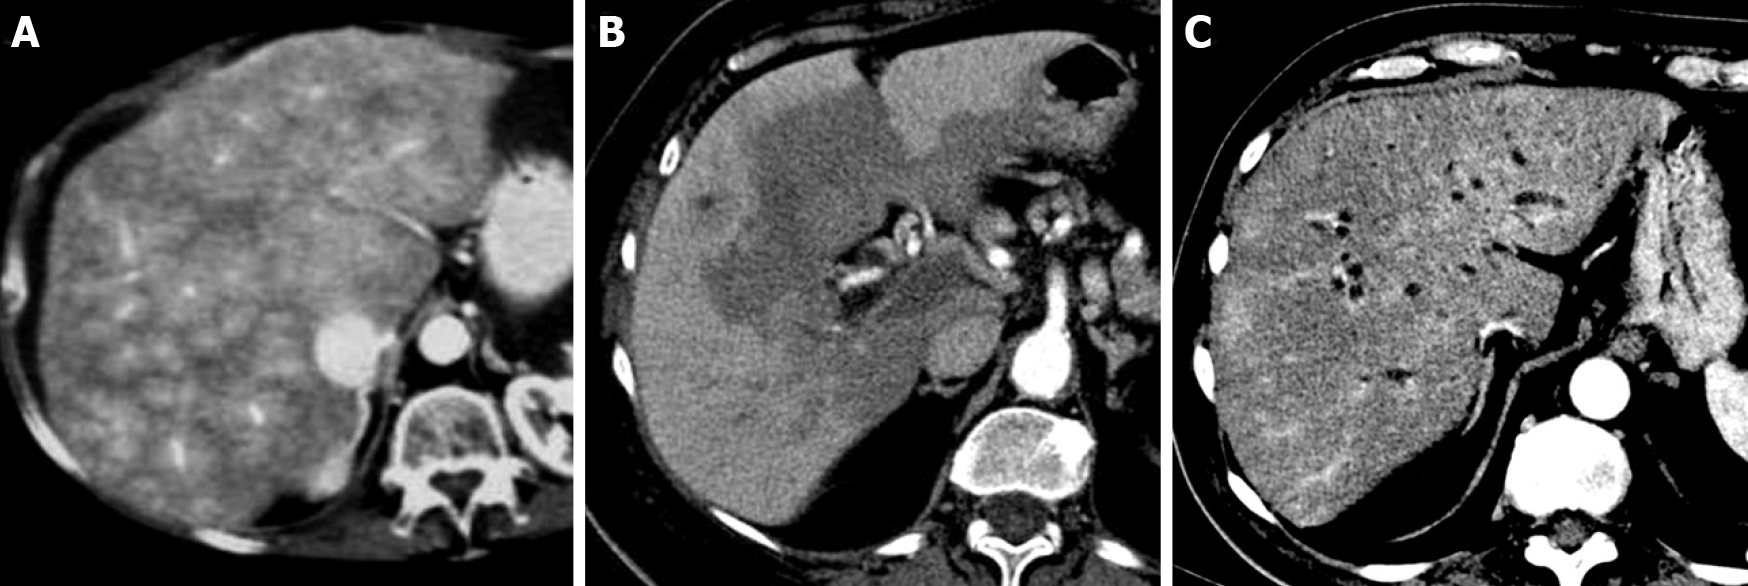
Figure 1 Transient hepatic parenchymal enhancement.
A: Contrast-enhanced computed tomography axial scan in the arterial phase shows a “mosaic” pattern of enhancement in patients with Budd-Chiari syndrome; B: “Central-peripheral” pattern in patients with portal thrombosis; C: “Peribiliary” pattern in patients with cholangitis.
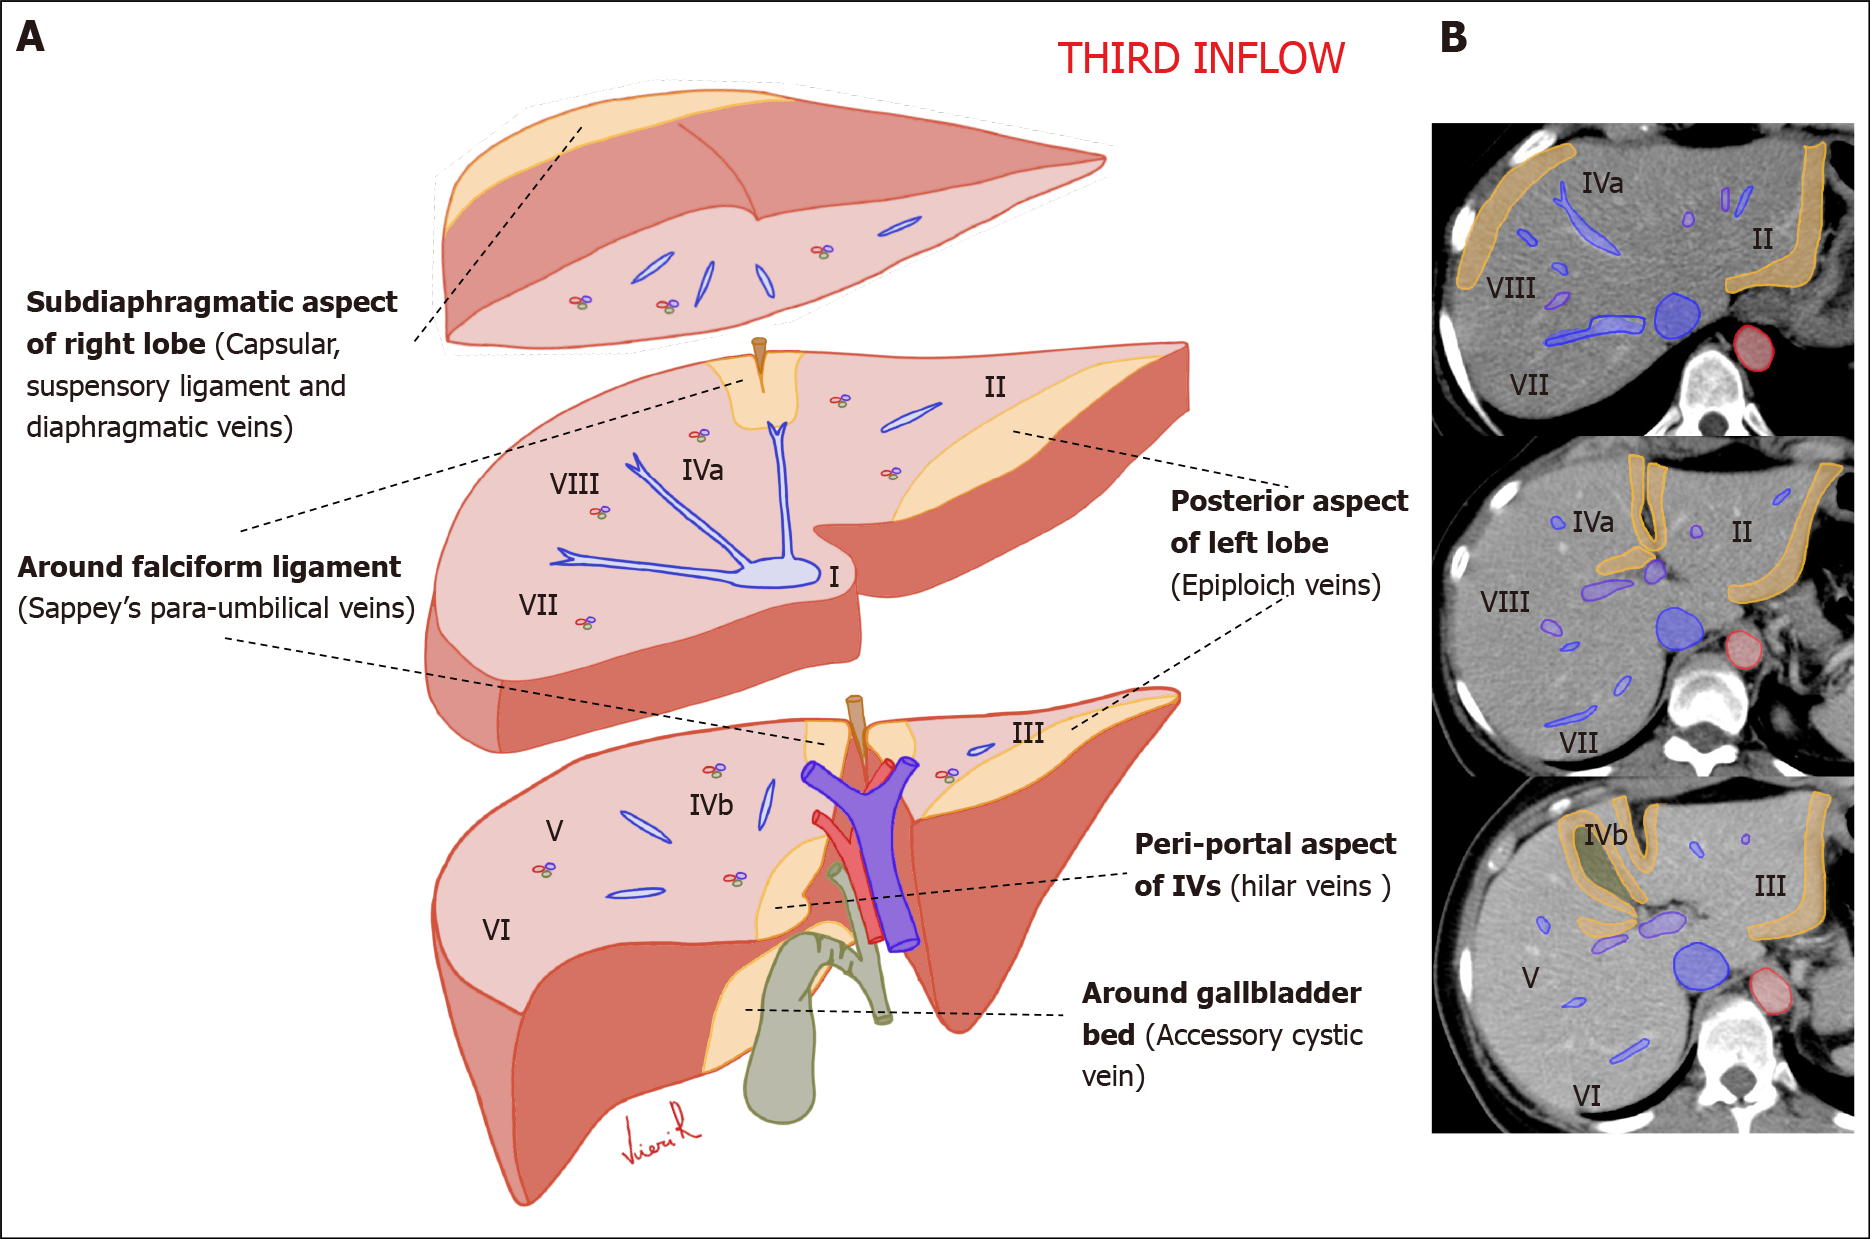
Figure 2 Schematic representation of the anatomical sites of the liver “Third inflow” in hepatic sections.
Yellow areas show the typical sites of focal sparing in fatty liver or nodular fat accumulation in the normal liver. A: Volumetric representation; B: Computed tomography axial scan.
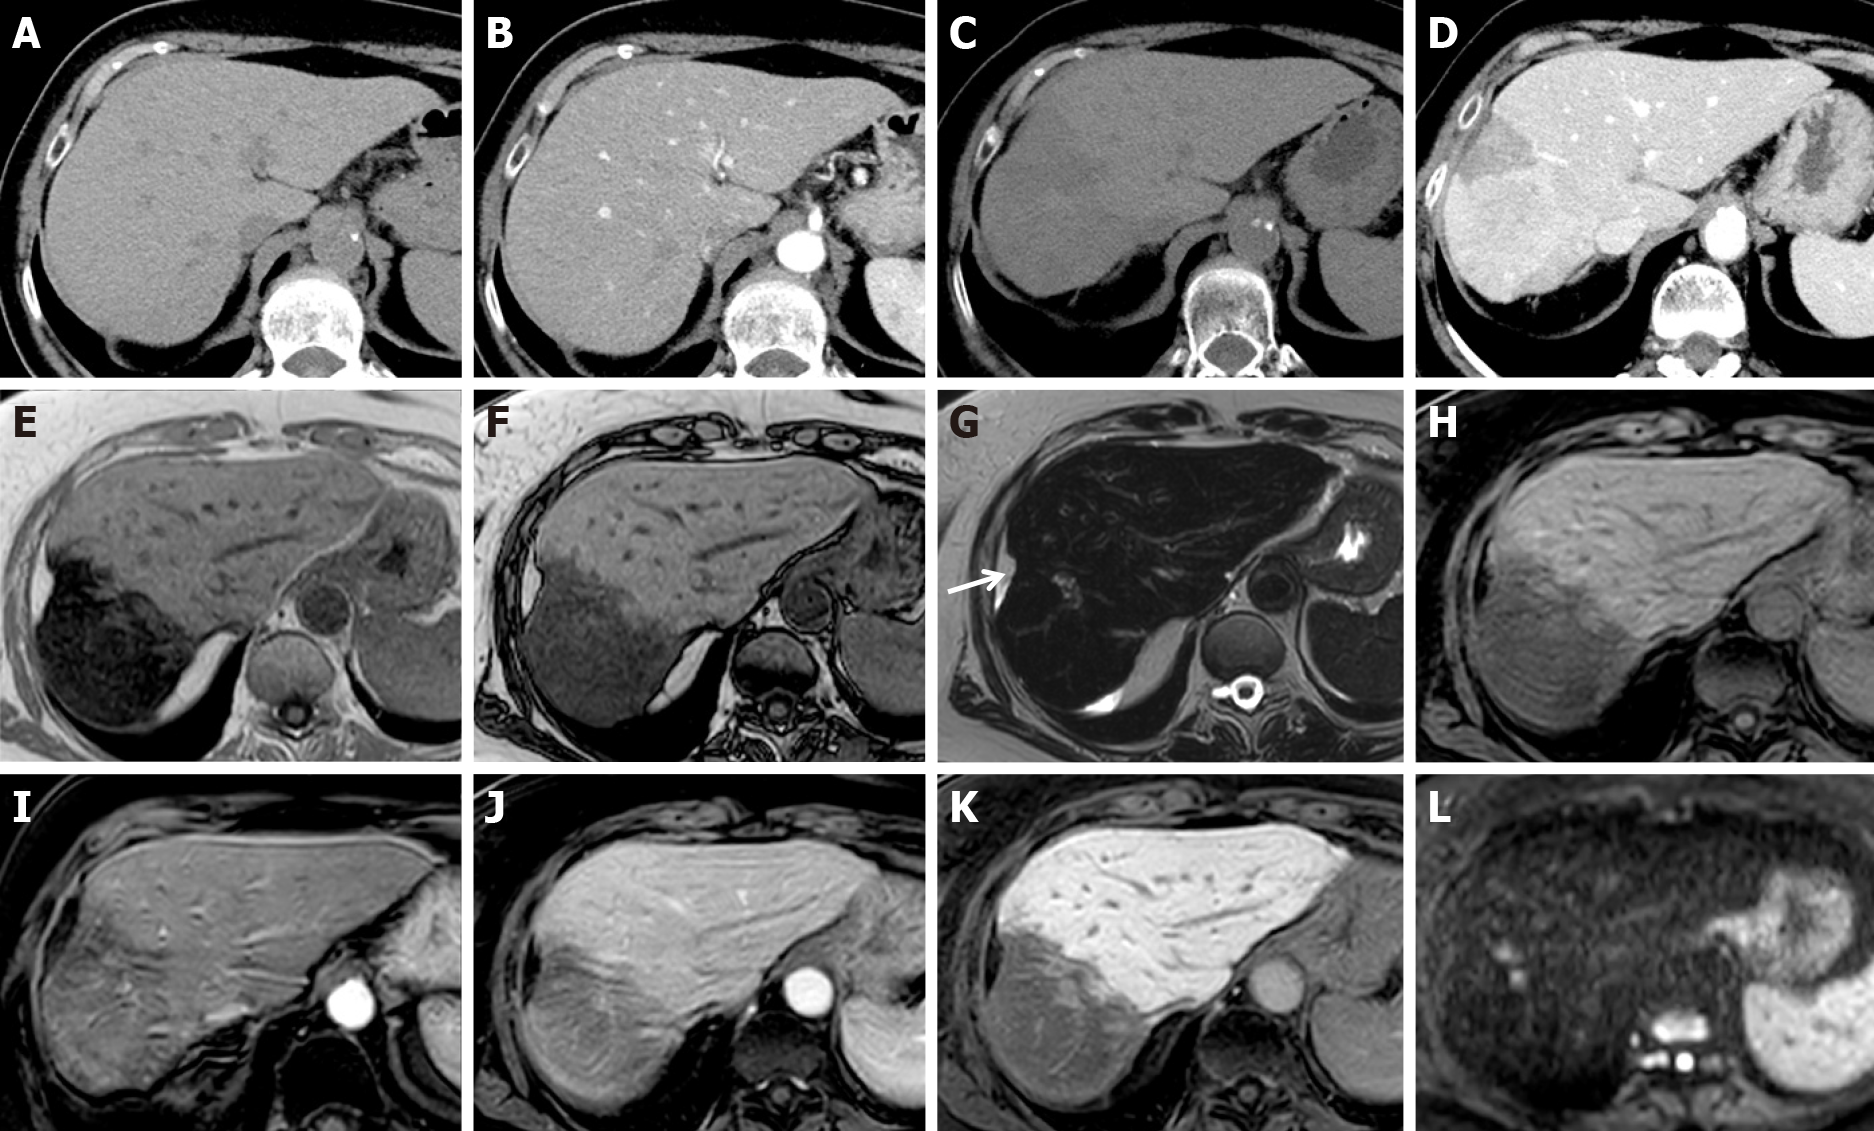
Figure 3 Liver metabolic infarction areas in patients with breast cancer.
A, B: Unenhanced (A) and arterial phase (B) computed tomography (CT) axial scan before therapy show normal liver; C, D: Unenhanced (C) and late arterial phase (D) CT axial scans after 3 mo of therapy show early steatotic changes of the parenchyma and inhomogeneous enhancement in segments VII-VIII; E-L: Magnetic resonance after 6 mo of therapy shows progression of parenchymal involution and atrophy in gradient echo (GE) T1w in-phase (E), GE T1w out-of-phase (F), fat sat GE 3D T1w unenhanced (H), arterial (I), portal (J) and hepatobiliary phase (K). Capsular retraction is seen (white arrow). On T2w (G), and high b-value diffusion-weighted (L) images, no signal alteration was detectable.
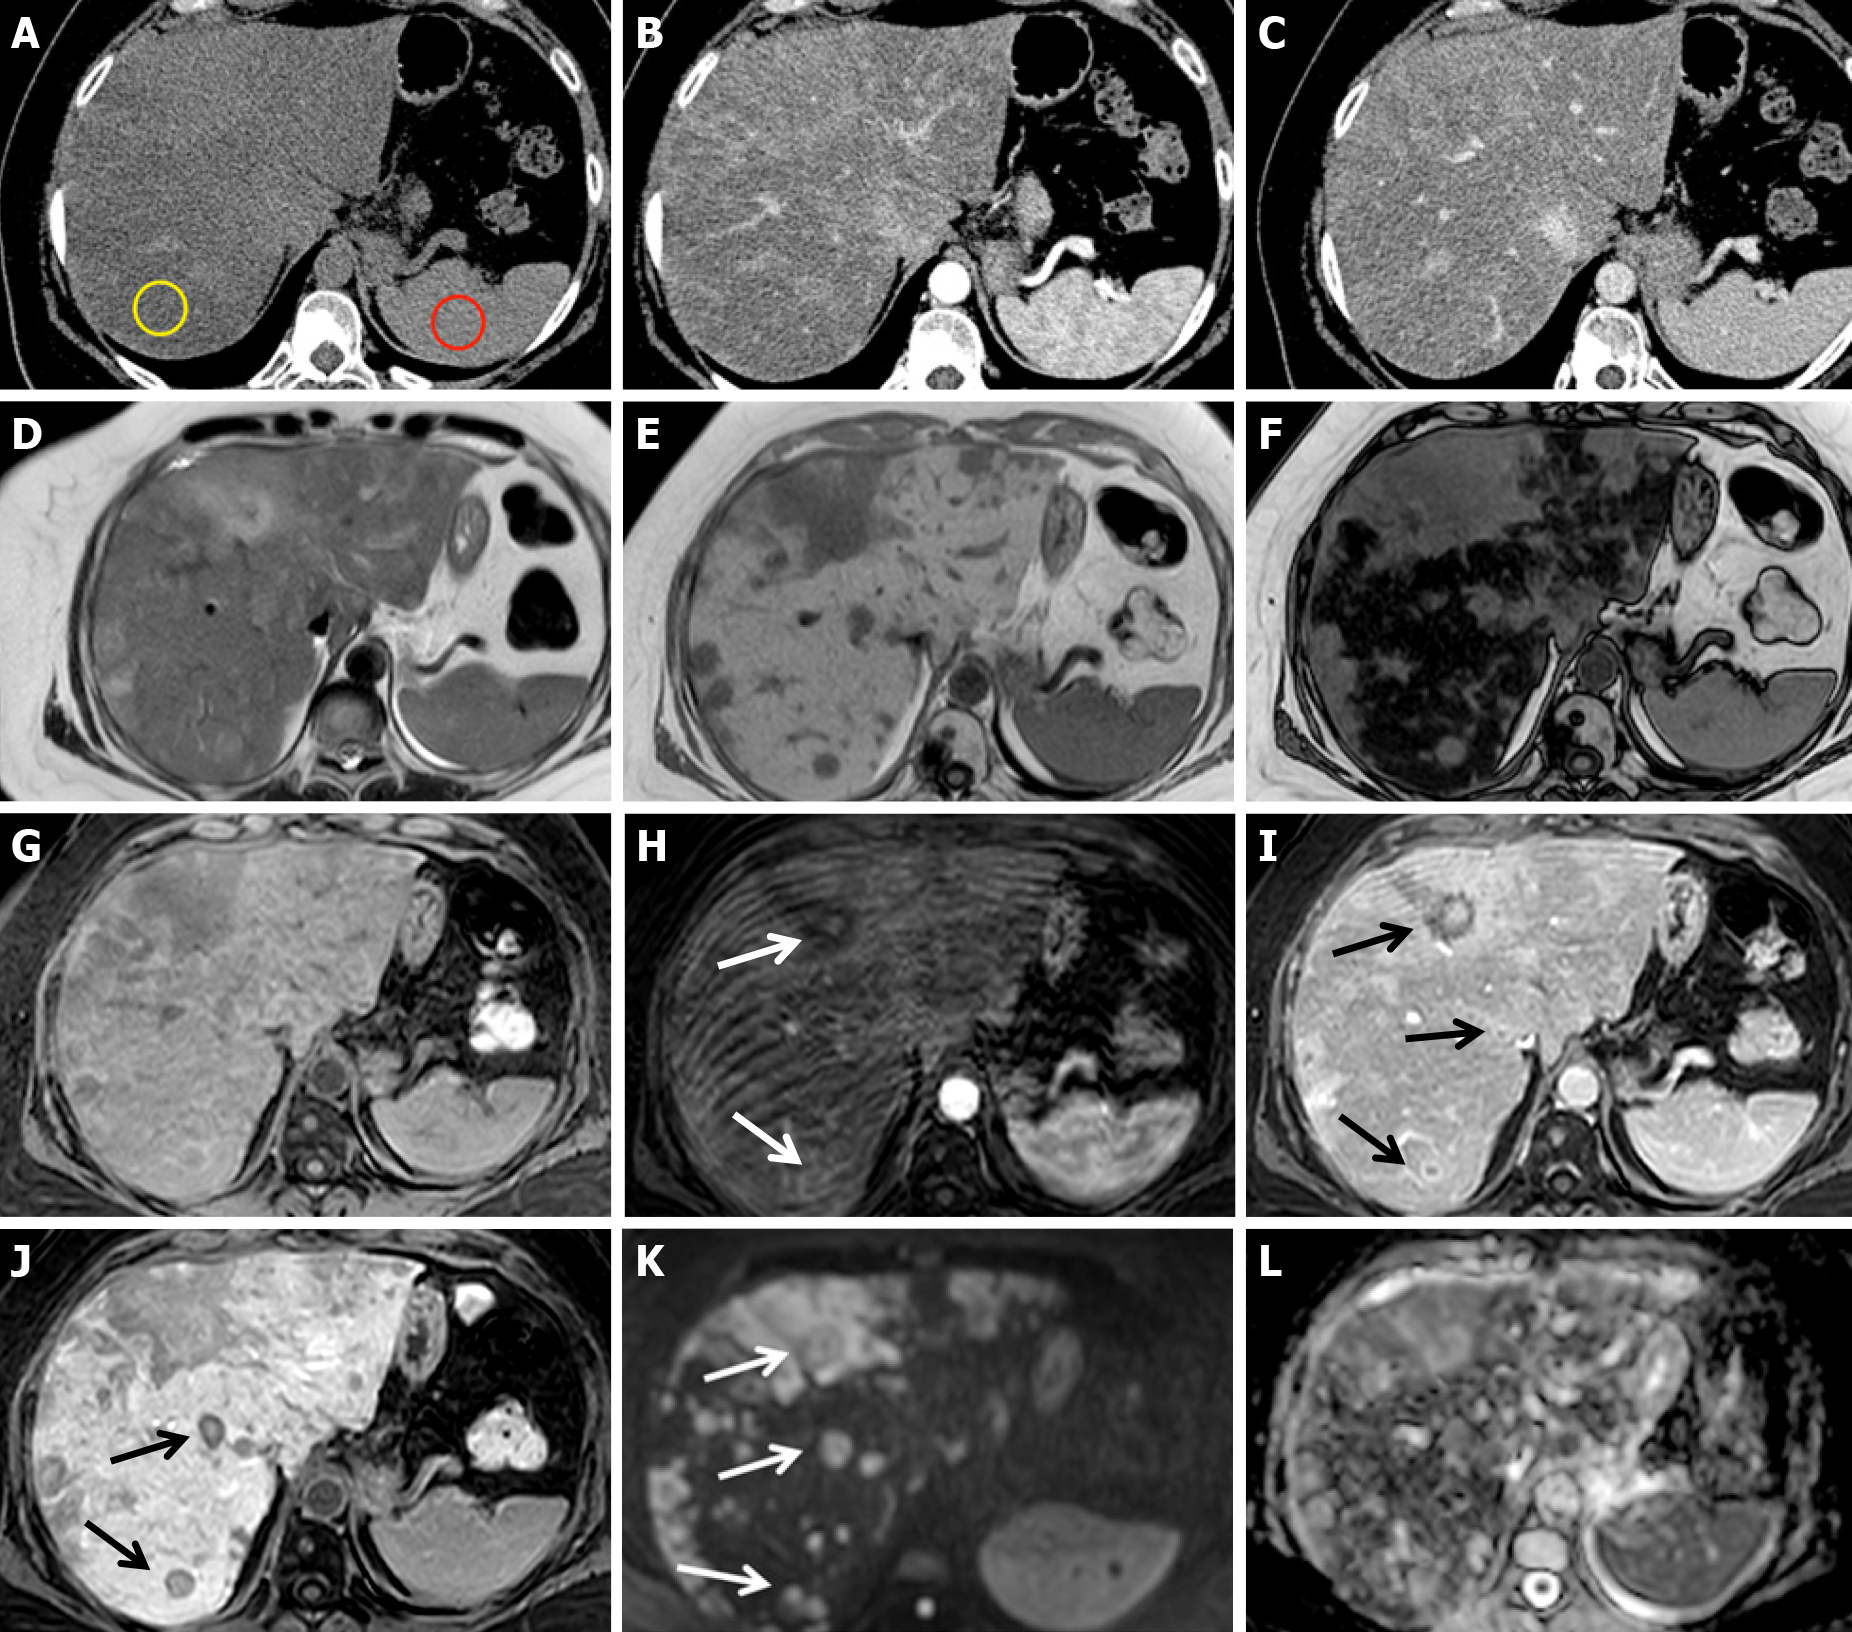
Figure 4 Chemotherapy-associated diffuse steatosis in patients with liver metastatic colorectal cancer 6 mo after the beginning of chemotherapy with 5-fluorouracil + folinic acid + irinotecan.
A-C: Unenhanced computed tomography axial scan (A), arterial (B) and portal phase (C) show severe inhomogeneous hepatic steatosis. Liver attenuation in steatotic areas is 8 HU (yellow ROI), less than that of the spleen (43 HU, red ROI), and the hepatic/splenic attenuation ratio is << 1. No nodules are visible; D-L: On magnetic resonance performed during the following week, gradient echo (GE) T1w in-phase (E) and out-of-phase (F) images confirm severe hepatic steatosis. On unenhanced fat sat GE 3D T1w images (G), arterial (H), portal (I), hepatobiliary (J) phases and high b-value diffusion-weighted images (K), multiple metastases are evident, some of which are characterized by rim enhancement (arrows). The T2-weighted image (D) and apparent diffusion coefficient map (L) are also shown.
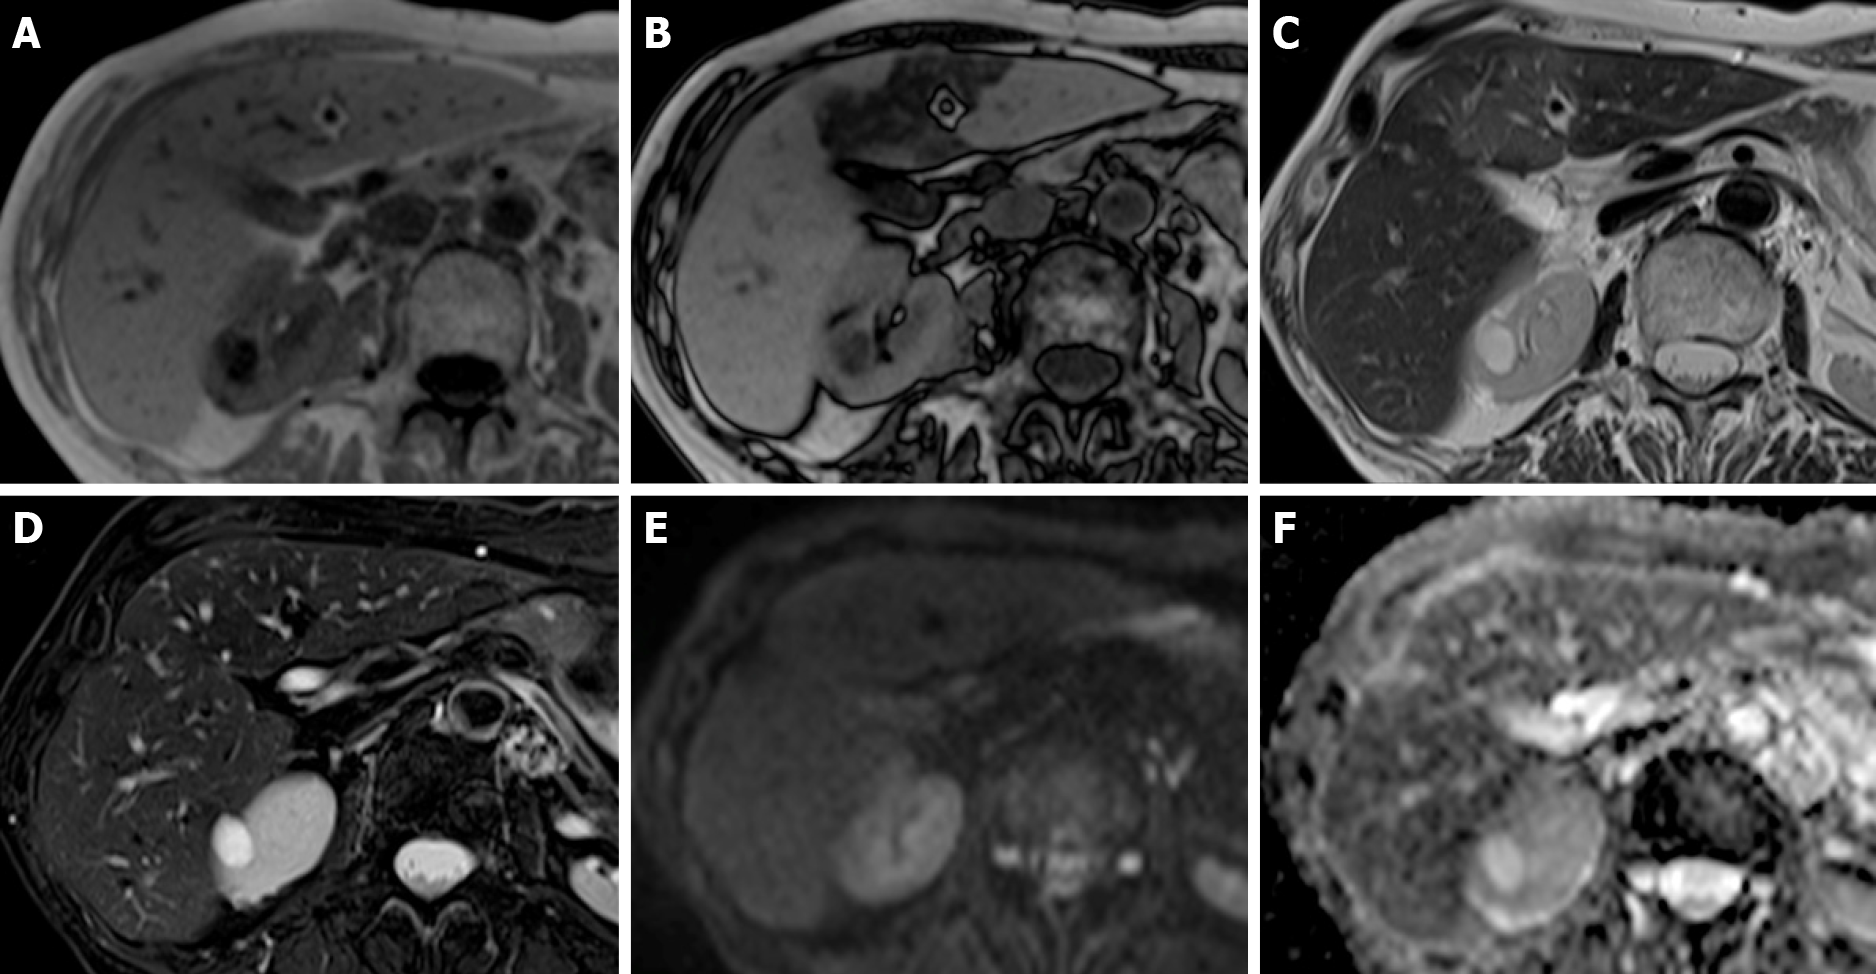
Figure 5 Chemotherapy-associated focal steatosis in patients with lung cancer 3 mo after the beginning of immunotherapy.
A-F: On magnetic resonance, focal geographic fatty deposition, poorly delineated, is seen as signal hypointensity on gradient echo (GE) T1w out-of-phase (B) in the periportal aspect of segment IV and around the falciform ligament. On T2w images (C) it is weakly hyperintense. No signal alterations are seen on the GE T1w in-phase images (A), T2w fat saturation (D), diffusion-weighted (E) images, or apparent diffusion coefficient map (F).
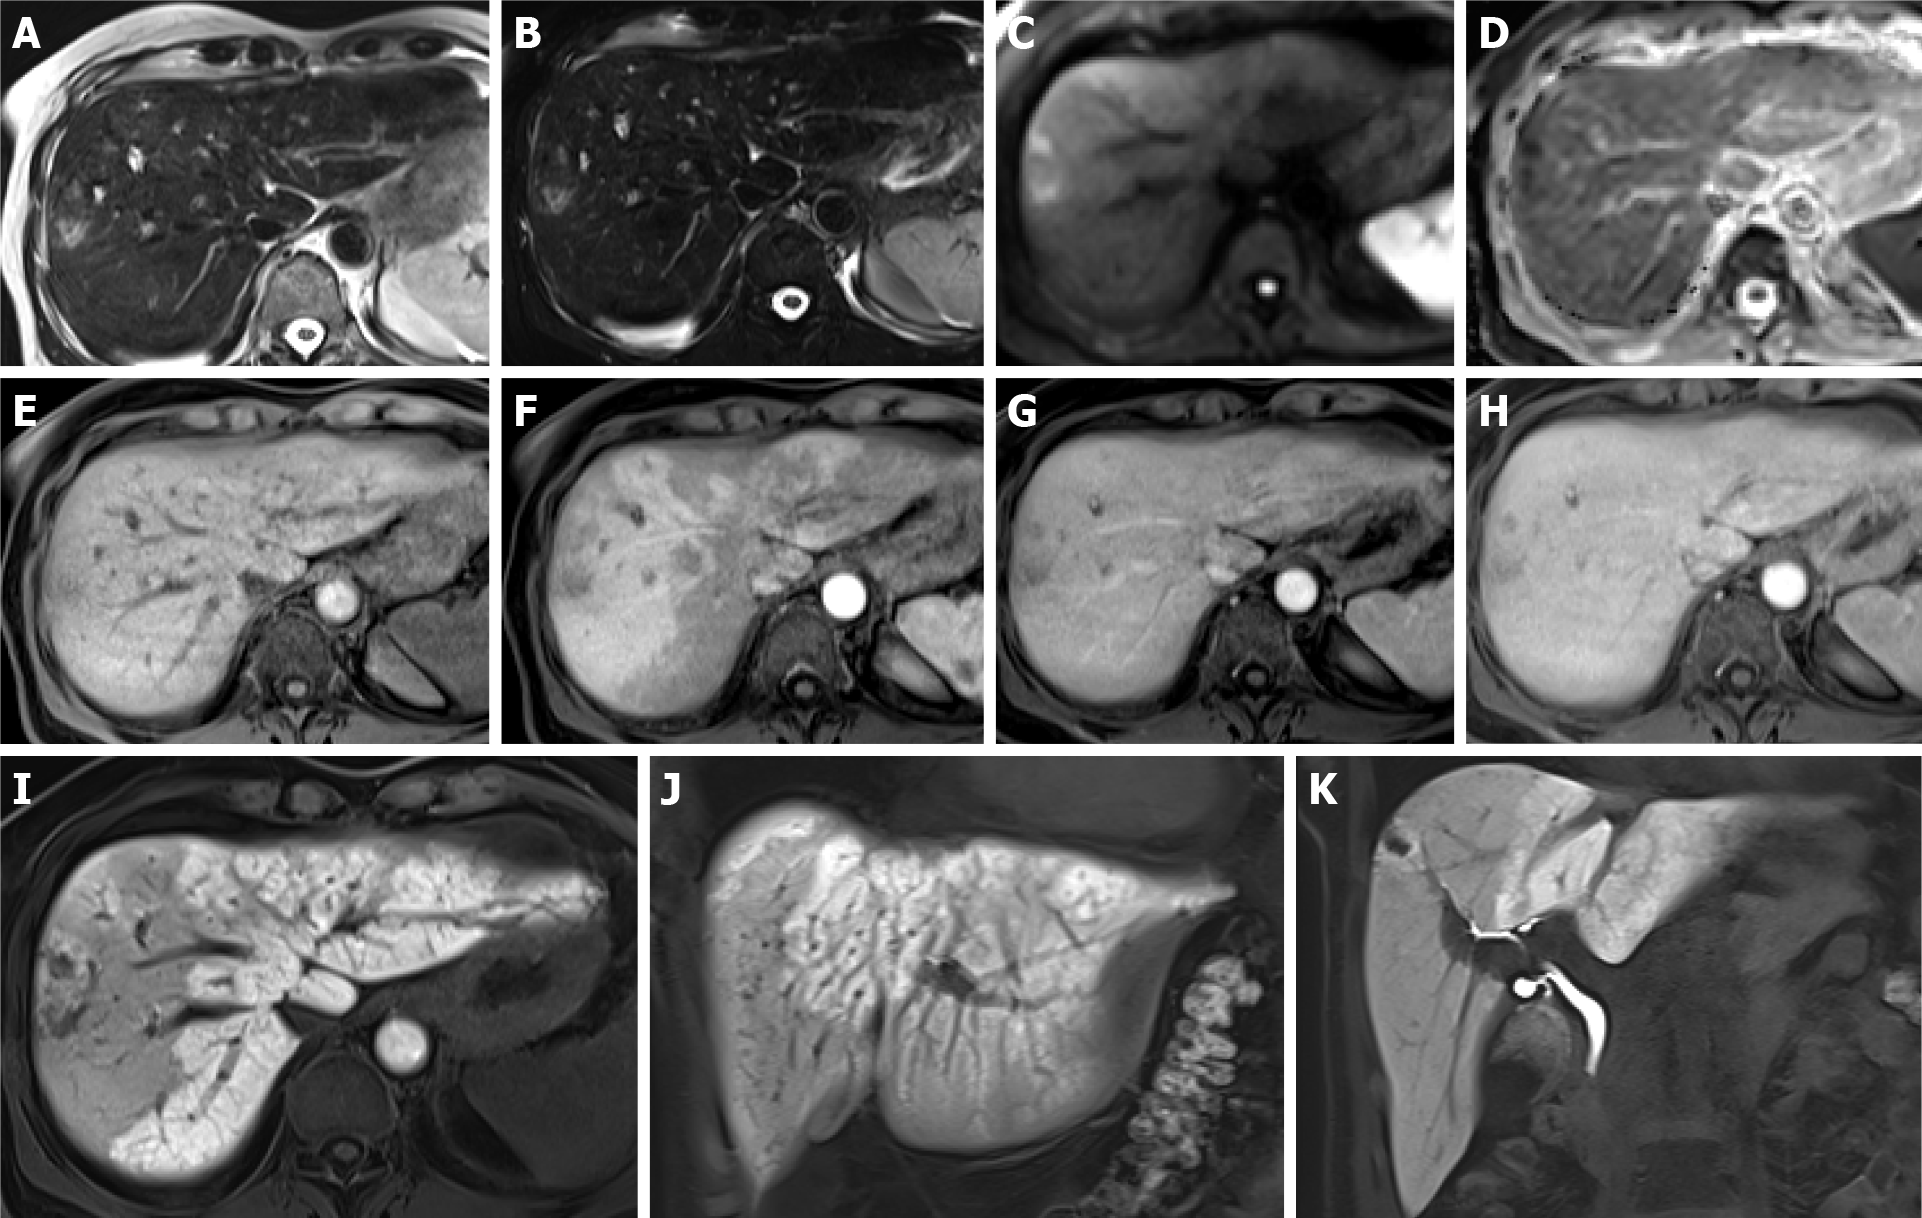
Figure 6 Association between sinusoidal obstructive syndrome and peliosis in patients without a history of hepatopathy, with lung cancer treated with 3 cycles of cisplatin and etoposide and 12 subsequent cycles of immunotherapy.
A-K: After 1 year of therapy, magnetic resonance was performed for abdominal pain and an increase in liver enzymes. Hyperintense nodules on T2w (A), T2w fat sat (B) and high b-value diffusion-weighted images (C) are seen. On the apparent diffusion coefficient map (D), they are hypointense. On dynamic imaging, weak enhancement is seen (E: Unenhanced image; F, G, H: Arterial, portal and equilibrium phases, respectively). In the hepatobiliary phase, they appear predominantly hypointense (I-K). A transcutaneous biopsy was performed, resulting in peliosis nodules. Mosaic pattern enhancement of the liver parenchyma in the arterial phase (F) and reticular aspects in the hepatobiliary phase (I-J) were consistent with sinusoidal obstructive syndrome.
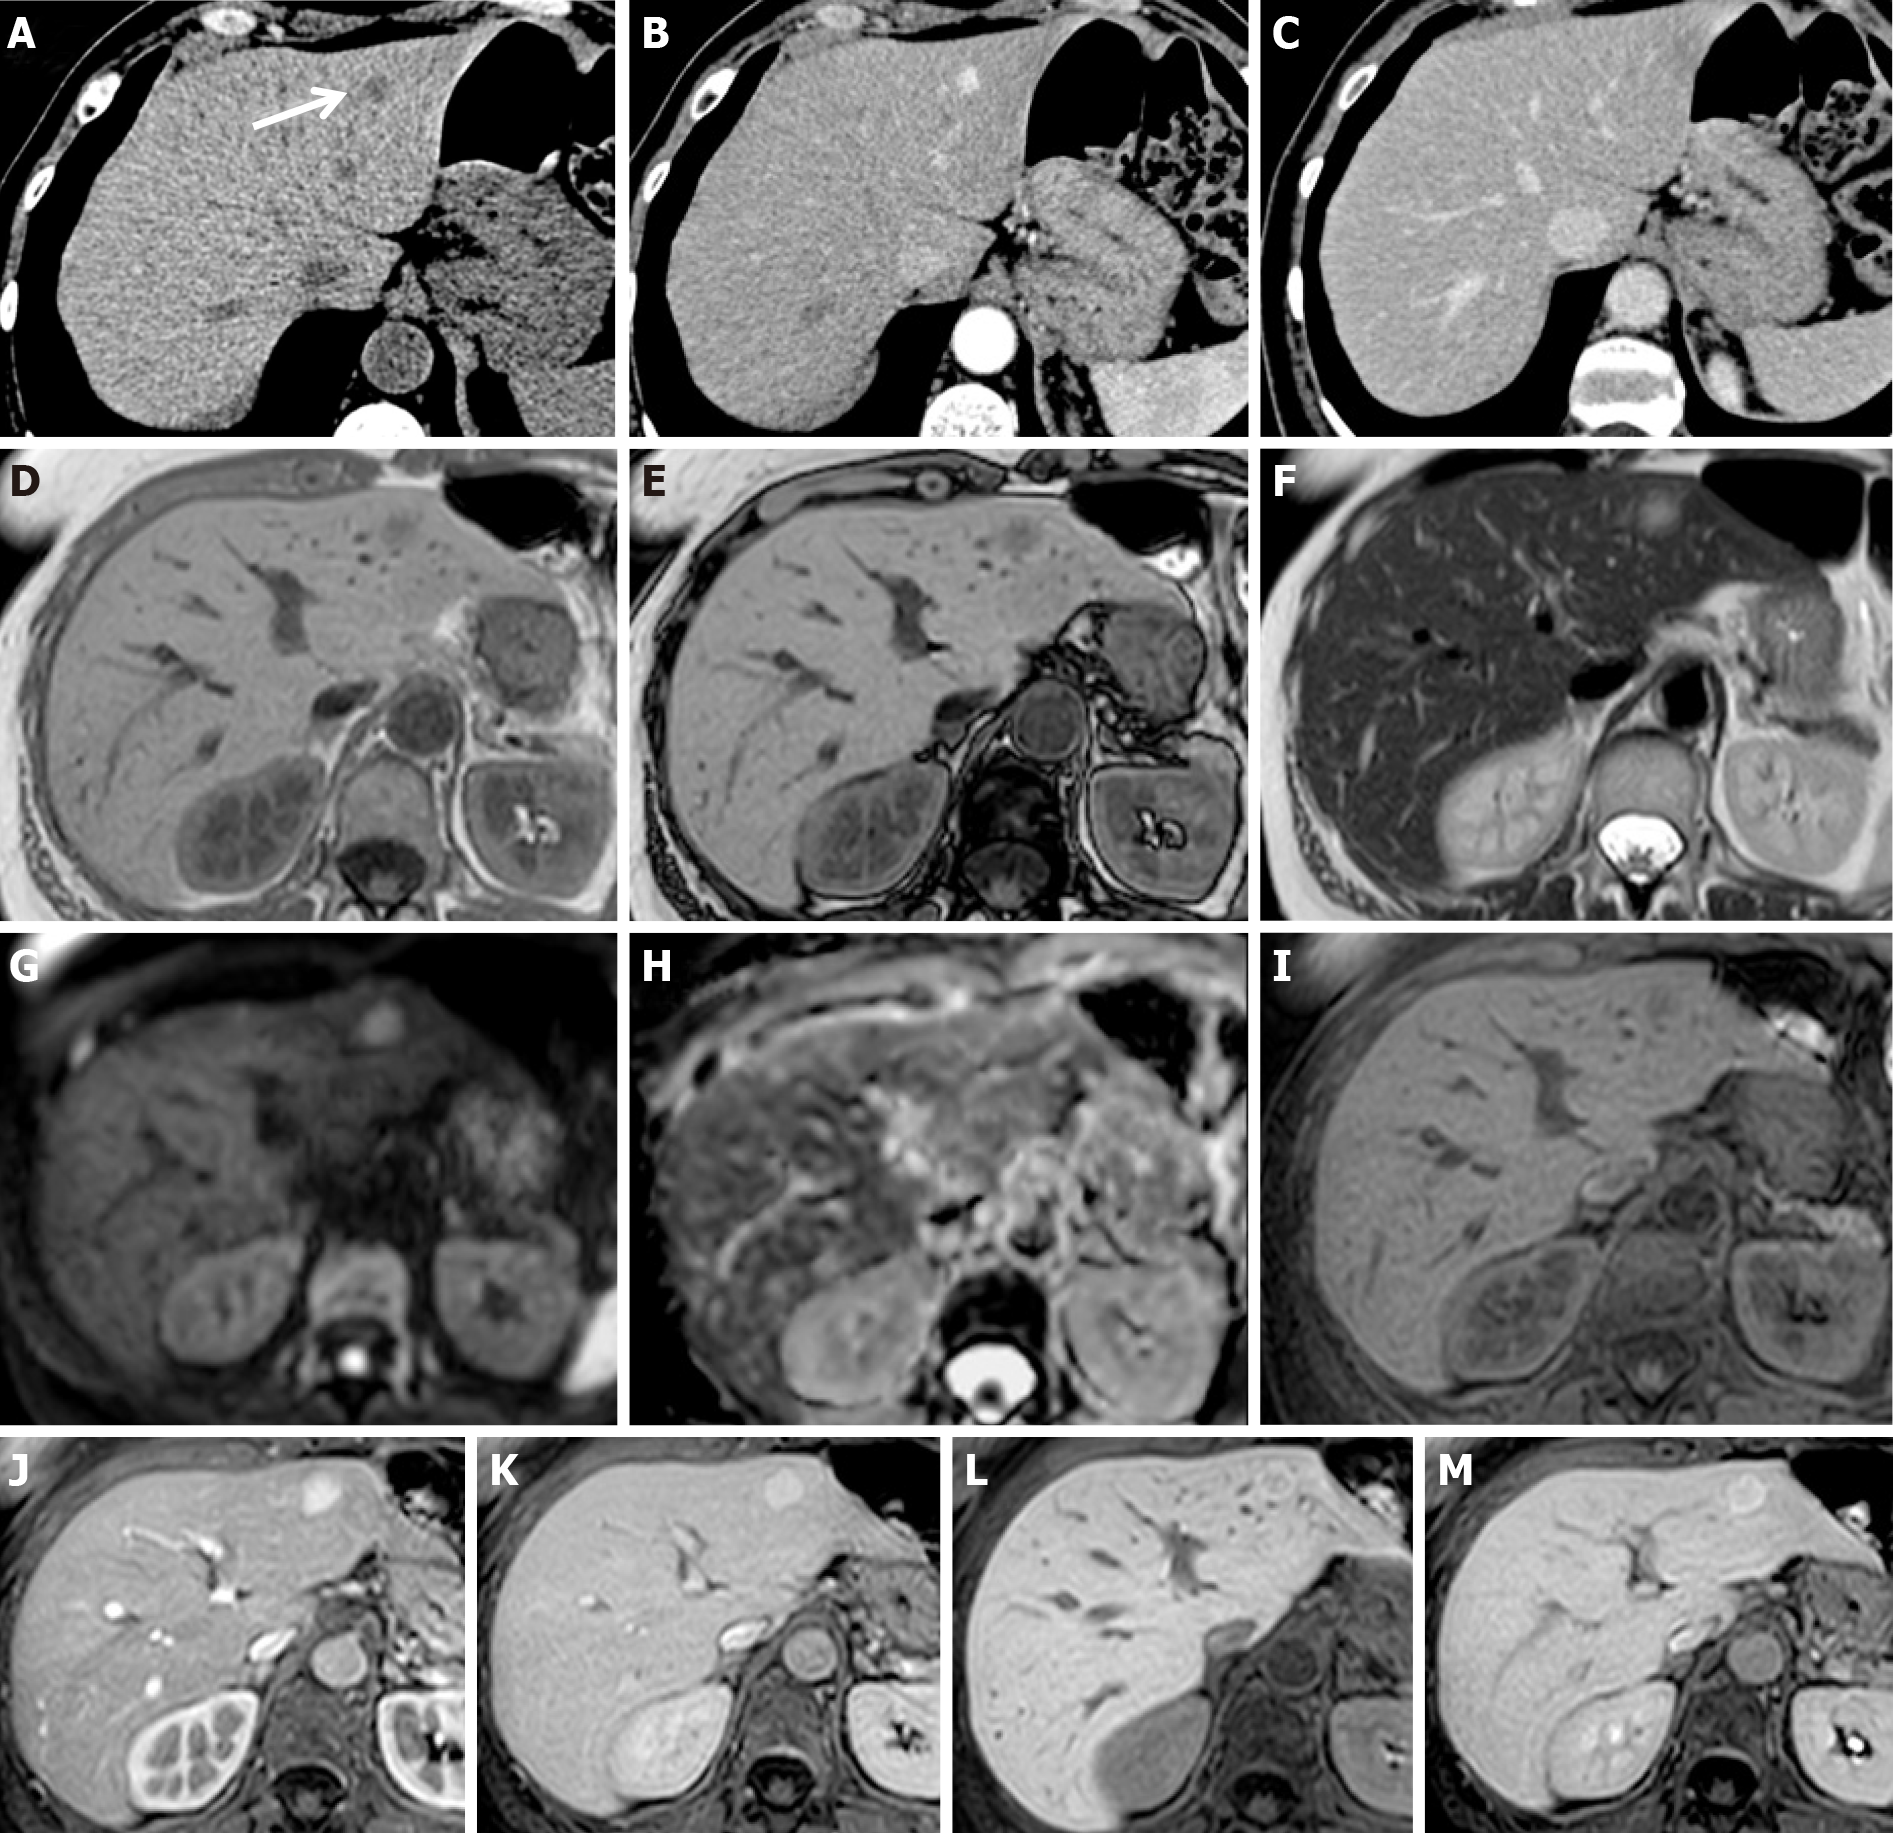
Figure 7 Focal nodular hyperplasia-like nodules in patients with colorectal cancer treated with surgery and adjuvant chemotherapy.
A-C: Six months after adjuvant chemotherapy discontinuation, contrast-enhanced computed tomography (CT) showed a newly appeared nodule in segment II (white arrow), hypodense on unenhanced scan (A), with contrast enhancement on arterial phase (B) without washout in portal phase (C); D-M: Magnetic resonance performed 3 mo after CT showed a volumetric increase in the nodule, characterized by signal hypointensity in gradient echo T1w in-phase (D) and out-of-phase (E) and weak hyperintensity in T2w images (F), without diffusivity restriction on diffusion-weighted imaging (G-H). After liver-specific contrast agent administration, it presented homogeneous wash-in on the arterial phase (J) compared to the unenhanced image (I), no wash-out (K), and weak central signal hypointensity on equilibrium (L) and hepatobiliary (M) phases. A transcutaneous biopsy was performed, resulting in focal nodular hyperplasia-like nodules.
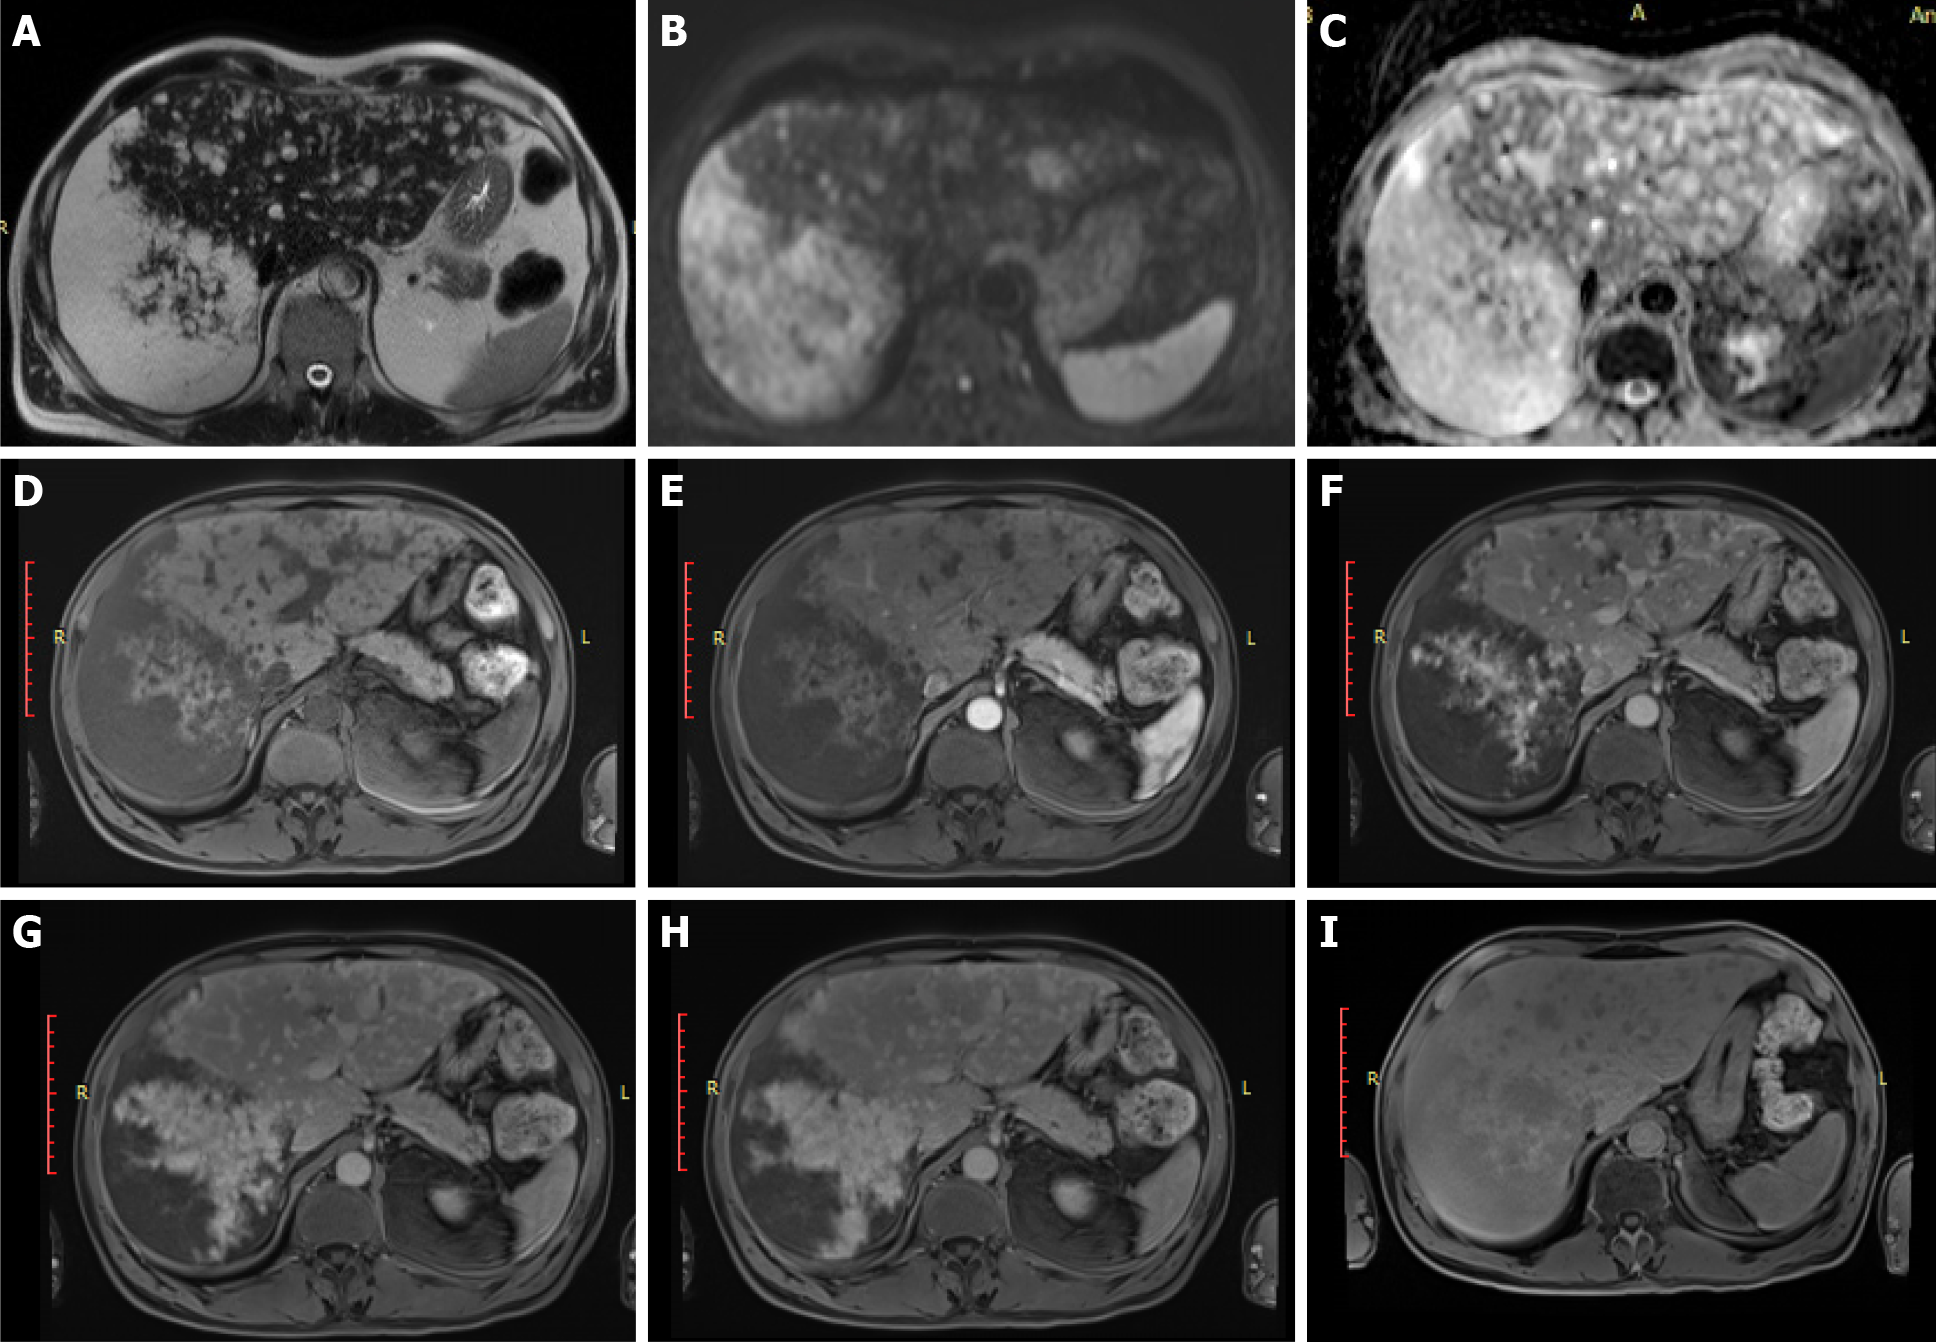
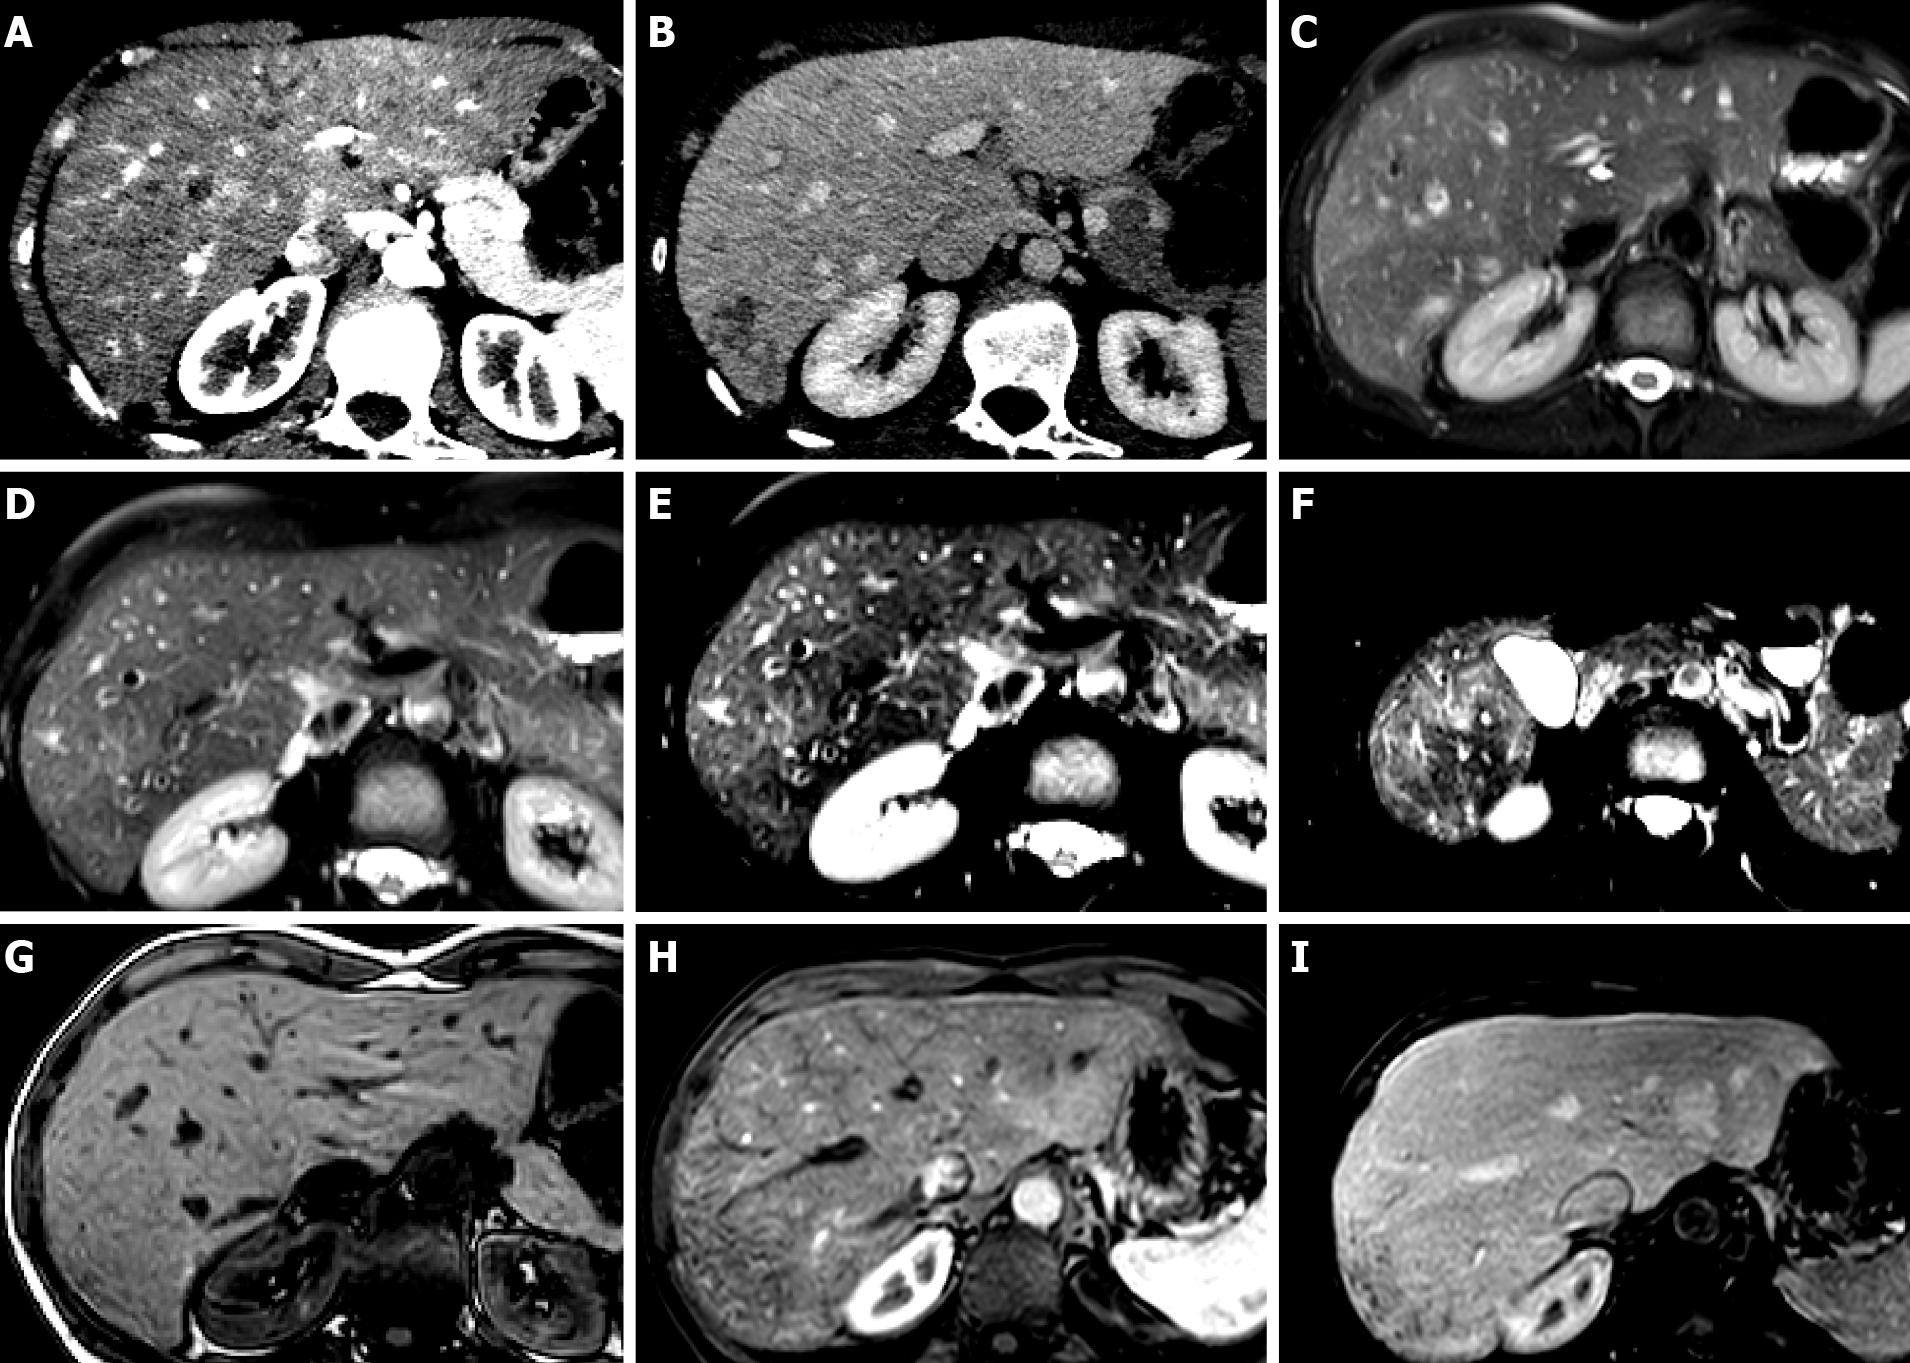
Figure 8 Primary idiopathic diffuse peliosis in patients without a cancer history.
A-C: On magnetic resonance T2w images (A) and on diffusion-weighted imaging (B: High b value; C: Apparent diffusion coefficient map), numerous hemangioma-like lesions are visible, the largest in segments VII-VIII; D-I: After interstitial contrast agent administration, progressive centrifugal enhancement of the lesions was observed (D: Fat sat gradient echo 3D T1w unenhanced image; E, F, G: Arterial, portal and equilibrium phases; H-I: 5 and 30 min after contrast agent administration).
Figure 9 Hepatic sinusoid dilatation in patients with breast cancer during hormone therapy.
A, B: Arterial (A) and portal (B) computed tomography axial scans show a liver mosaic pattern of arterial enhancement, with reticular aspects on the subcapsular parenchyma of segment VII in the portal phase; C-F: Magnetic resonance (MR) T2w images show mild signal hyperintensity on different liver sections and different echo times; G-I: MR unenhanced (G), arterial (H) and portal phases (I) confirm the mosaic pattern mostly subcapsular of the liver parenchyma.
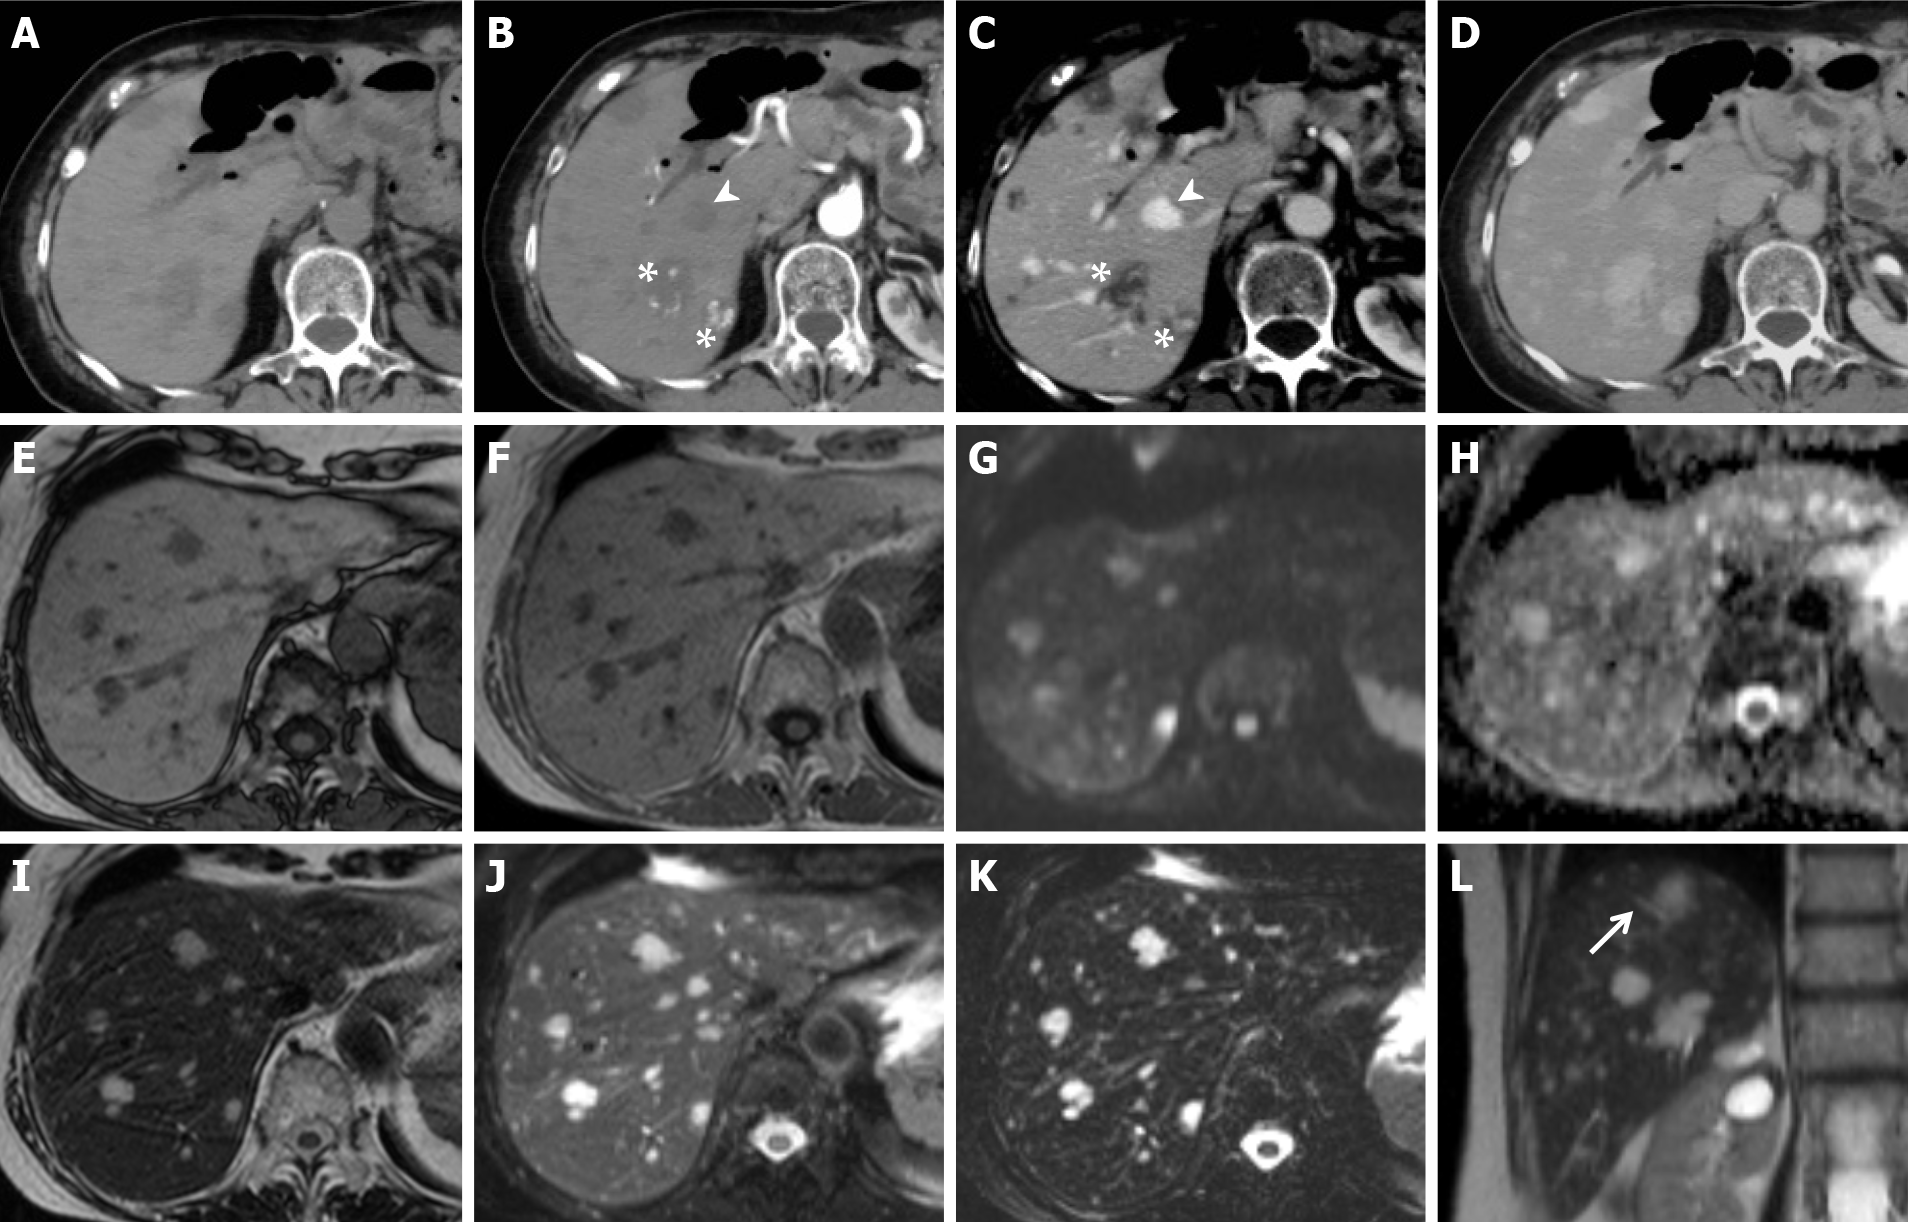
Figure 10 Secondary idiopathic multiple peliotic lesions in patients with a history of 6-mercaptopurine treatment for leukemia.
A-D: Contrast-enhanced computed tomography shows multiple lesions, hypodense on unenhanced scan (A) with dystrophic calcifications and hyperdense foci, probably secondary to hemorrhage. On dynamic imaging (B, axial arterial phase; C, axial portal phase), the lesions present centripetal (arrowhead) or centrifugal (asterisk) globular contrast enhancement without signs of washout. In the delayed phase (D), they appear isodense compared with the hepatic parenchyma; E-L: Magnetic resonance confirming the presence of hypointense lesions on T1w images (E-F) and hyperintense lesions on T2w images (I, J and L, arrow), which maintain high signal in long echoes echo time 320 ms (K). No signs of altered diffusion (G-H) or mass effects are shown. These characteristics were consistent with multiple peliotic lesions.
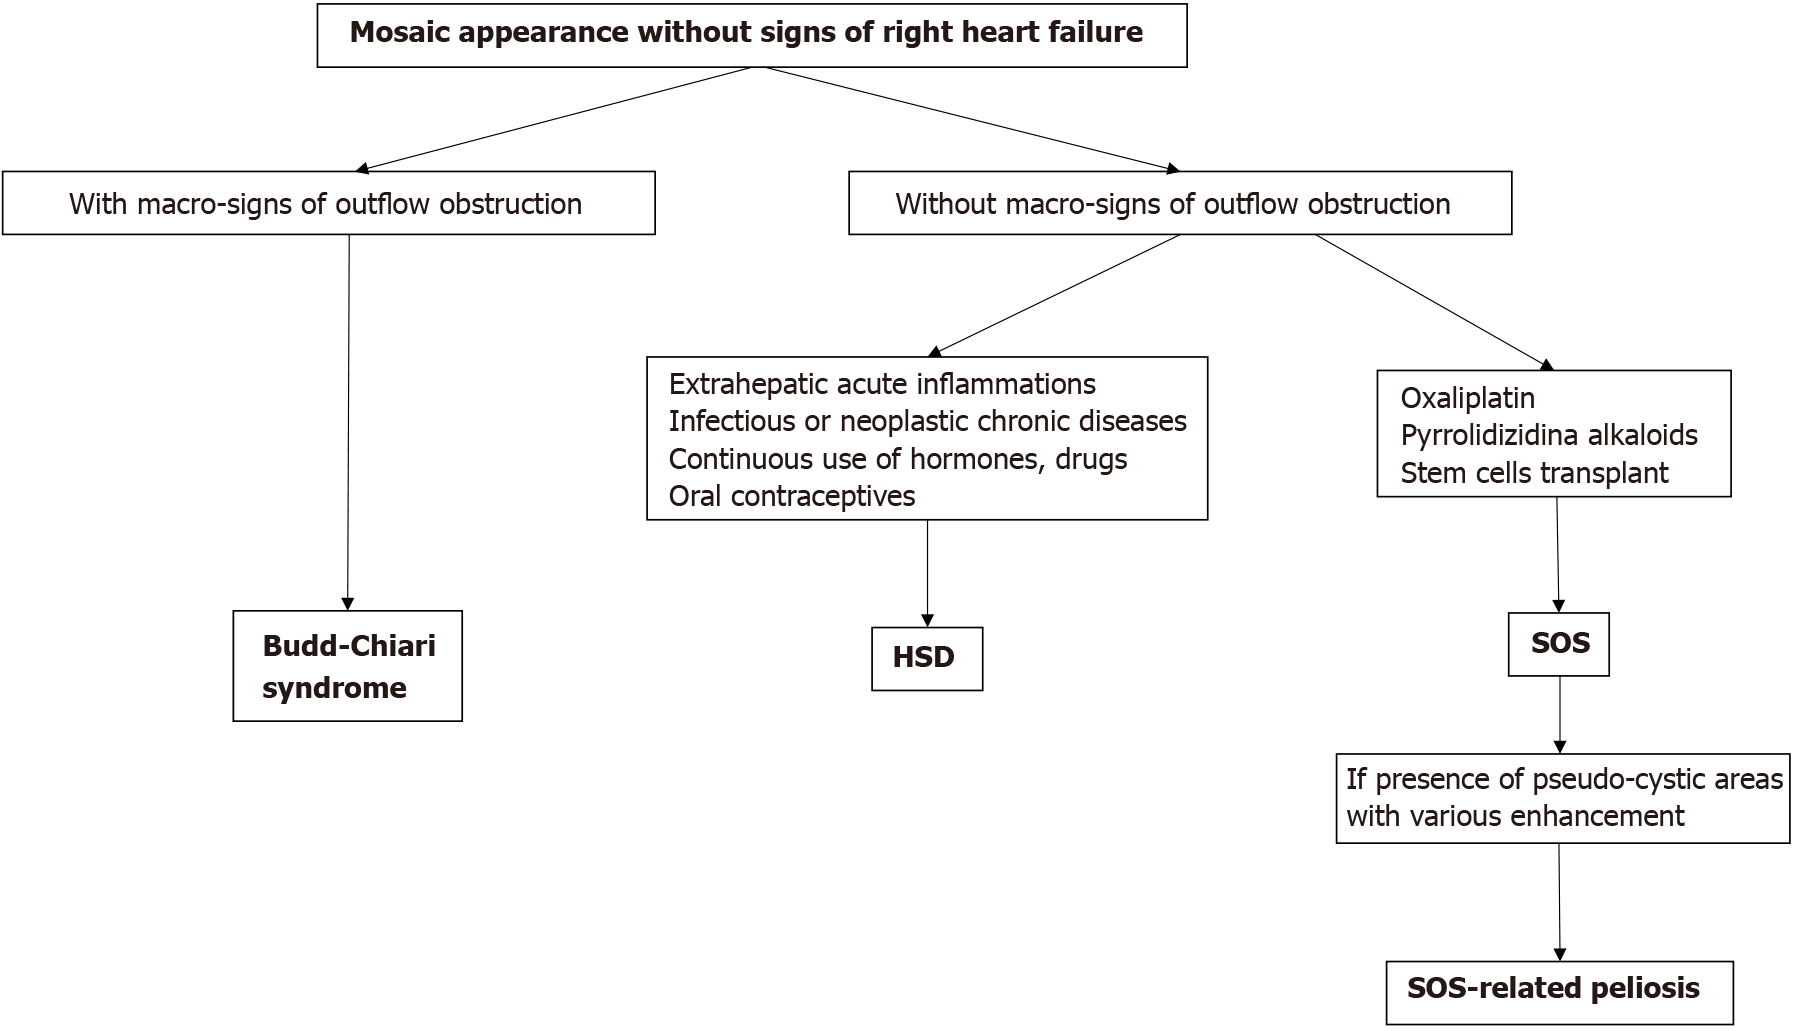
Figure 11 Diagram of different forms of mosaic pattern enhancement in blue liver syndrome.
HSD: Hepatic sinusoid dilatation; SOS: Sinusoidal obstruction syndrome.
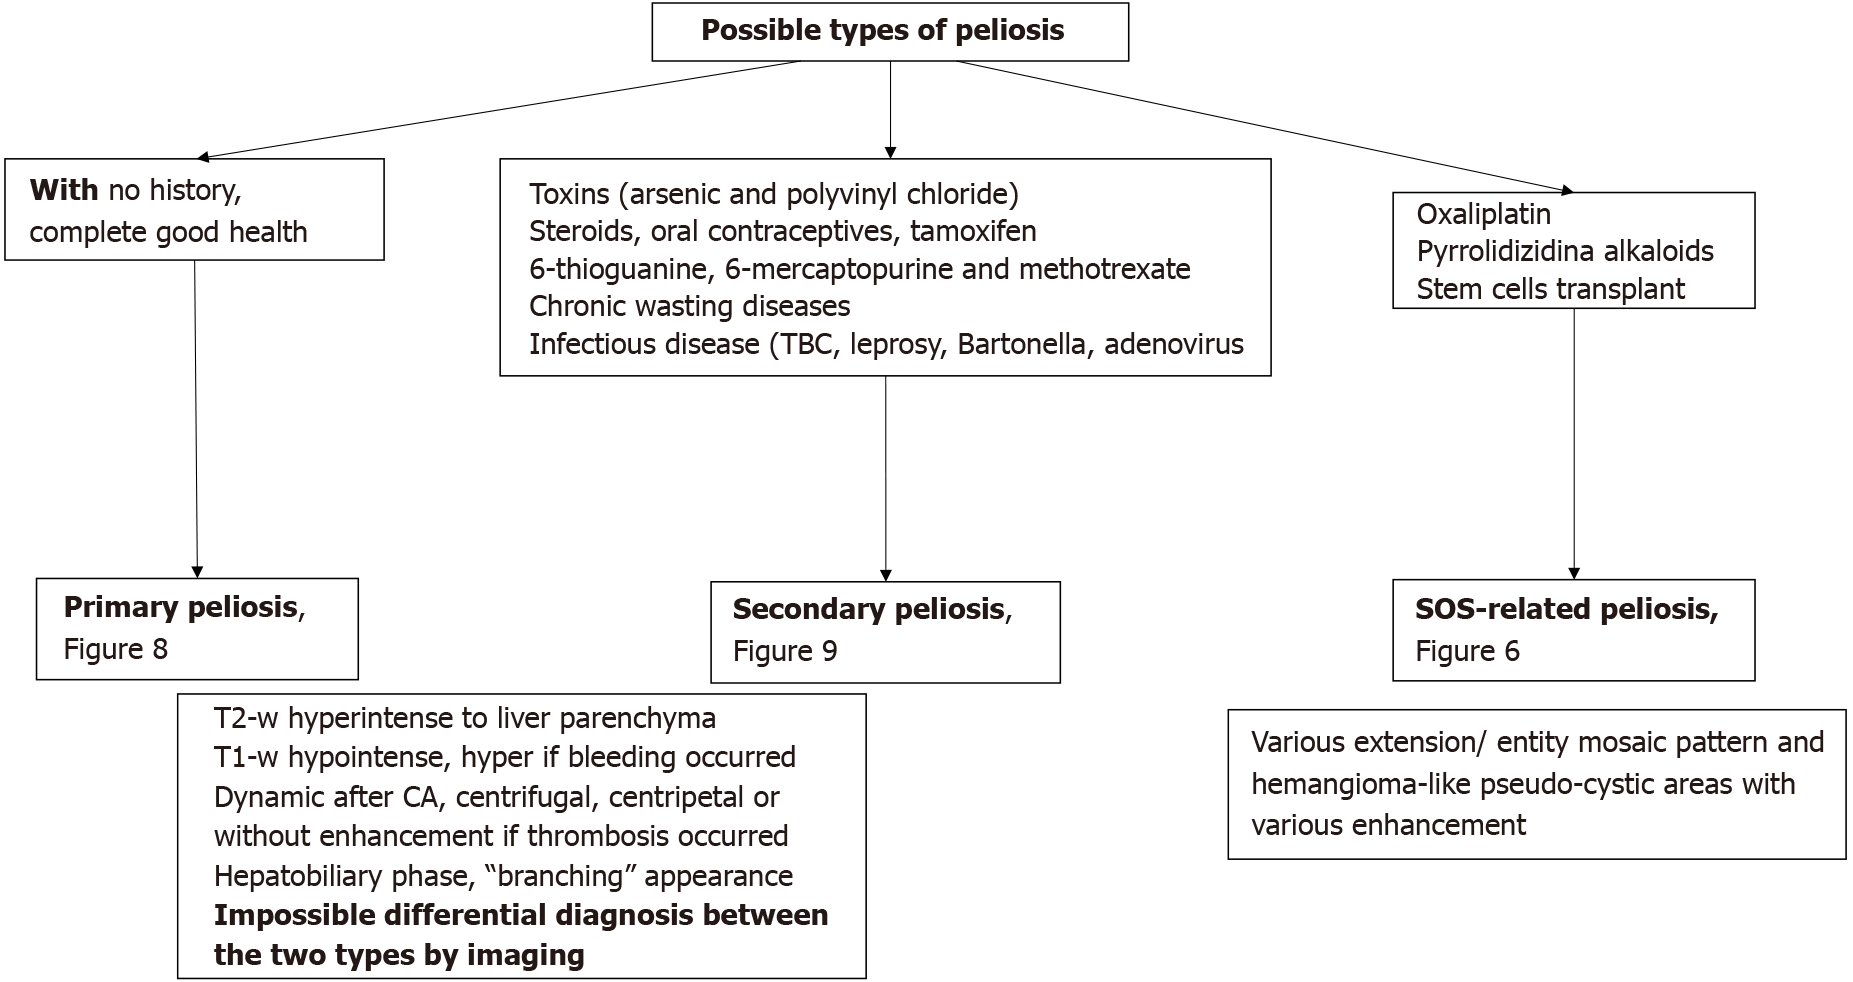
Figure 12 Diagram showing the classification of hepatic peliosis.
SOS: Sinusoidal obstruction syndrome; CA: Contrast agent.
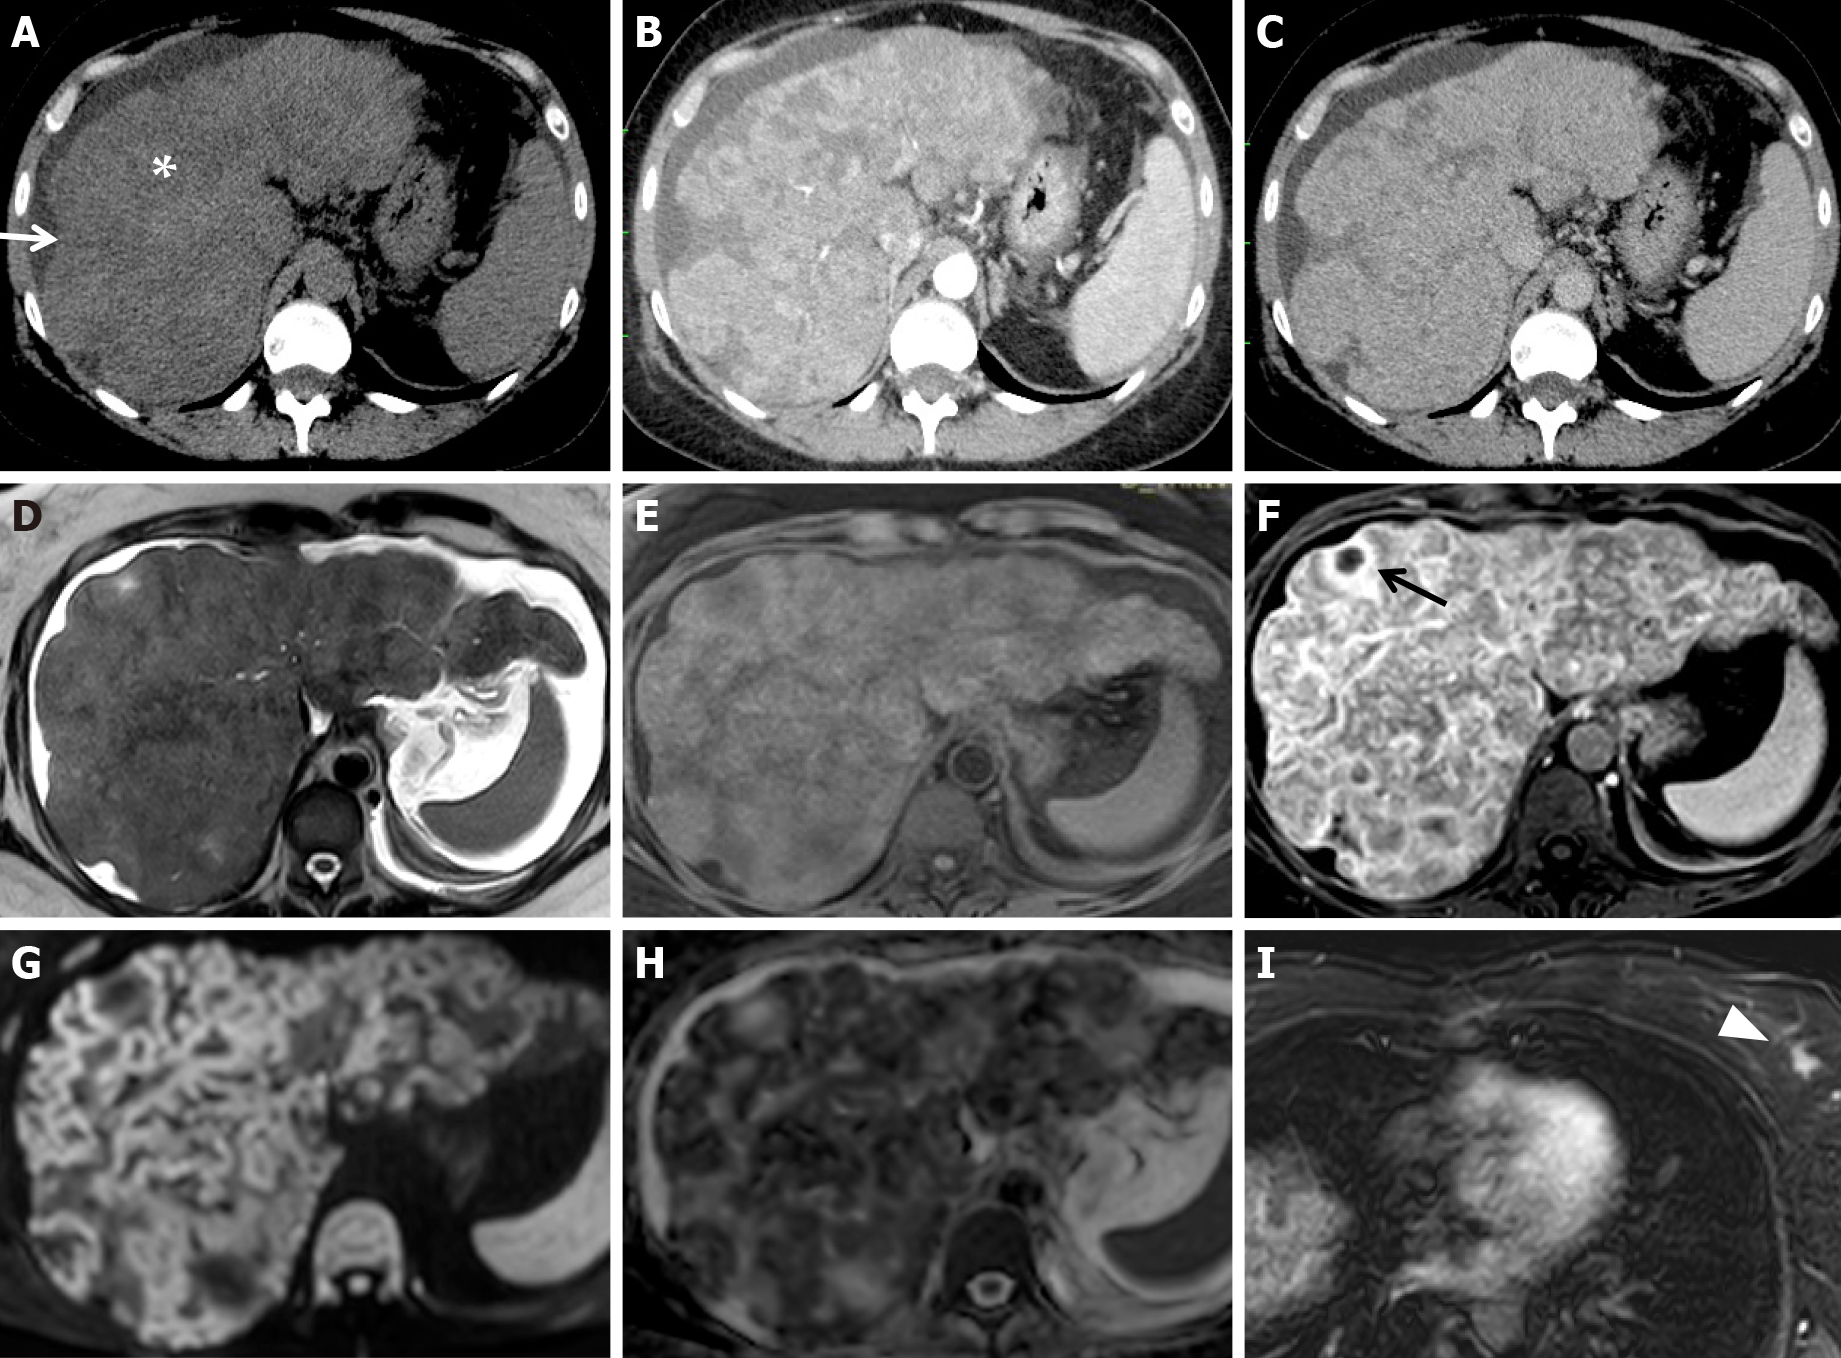
Figure 13 Pathologically proven pseudocirrhosis due to a small breast cancer in a chemotherapy “naïve patient”, having received no chemotherapy.
A-C: On unenhanced (A) computed tomography (CT) axial scans, a lobulated liver contour with retraction of the capsular surface (white arrow), low-attenuation parenchymal areas, and ascites (white asterisk) are seen. On arterial (B) and portal (C) CT axial scans, architectural disorder and heterogeneous contrast enhancement are detectable; D-I: On magnetic resonance, the presence of ascites is confirmed on T2w images (D). Profound structural and architectural changes due to the presence of coarse nodules separated by areas of fibrosis in an unenhanced fat sat gradient echo 3D T1w image (E) and a contrast-enhanced phase T1w image at equilibrium (F) are visible; various confluent nodules with irregular hyperintense rims on high b-value diffusion-weighted images (G) and low signal intensity in apparent diffusion coefficient map value (H) were observed. A small necrotic area inside a nodule is indicated in F (black arrow). One small left breast cancer nodule (white arrowhead) on a contrast-enhanced T1w image is visible in the arterial phase (I).
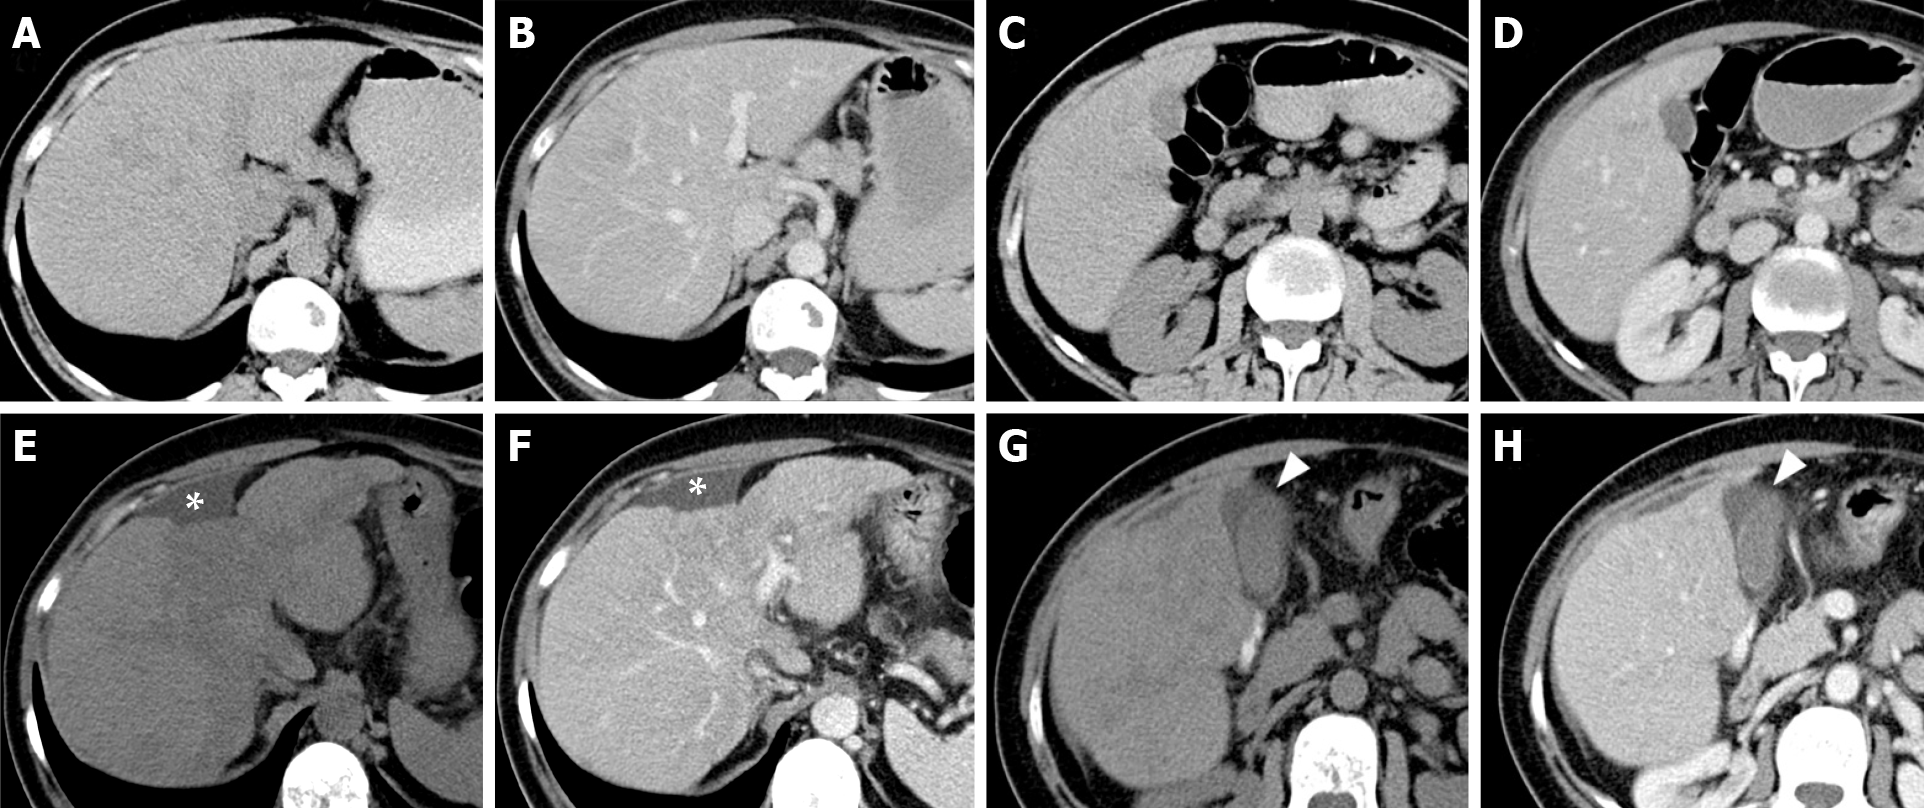
Figure 14 Early features of pseudocirrhosis in patients with metastatic breast cancer treated with gemcitabine for 12 mo.
A-D: On axial unenhanced (A, C) and contrast-enhanced portal (B, D) computed tomography (CT) scan images, executed prior chemotherapy, the liver presents a regular volume, morphology and a smooth surface. No signs of ascites are present; E-H: On CT exam after chemotherapy (12 mo) at the same levels, in the same phases, fatty changes of the liver parenchyma, reduction of the hepatic volume with relative hypertrophy of the left lobe, irregular margins and capsular retraction corresponding to the IV segment (asterisk) were detectable. Peri-hepatic and pericholecystic effusion occurred (arrowhead).
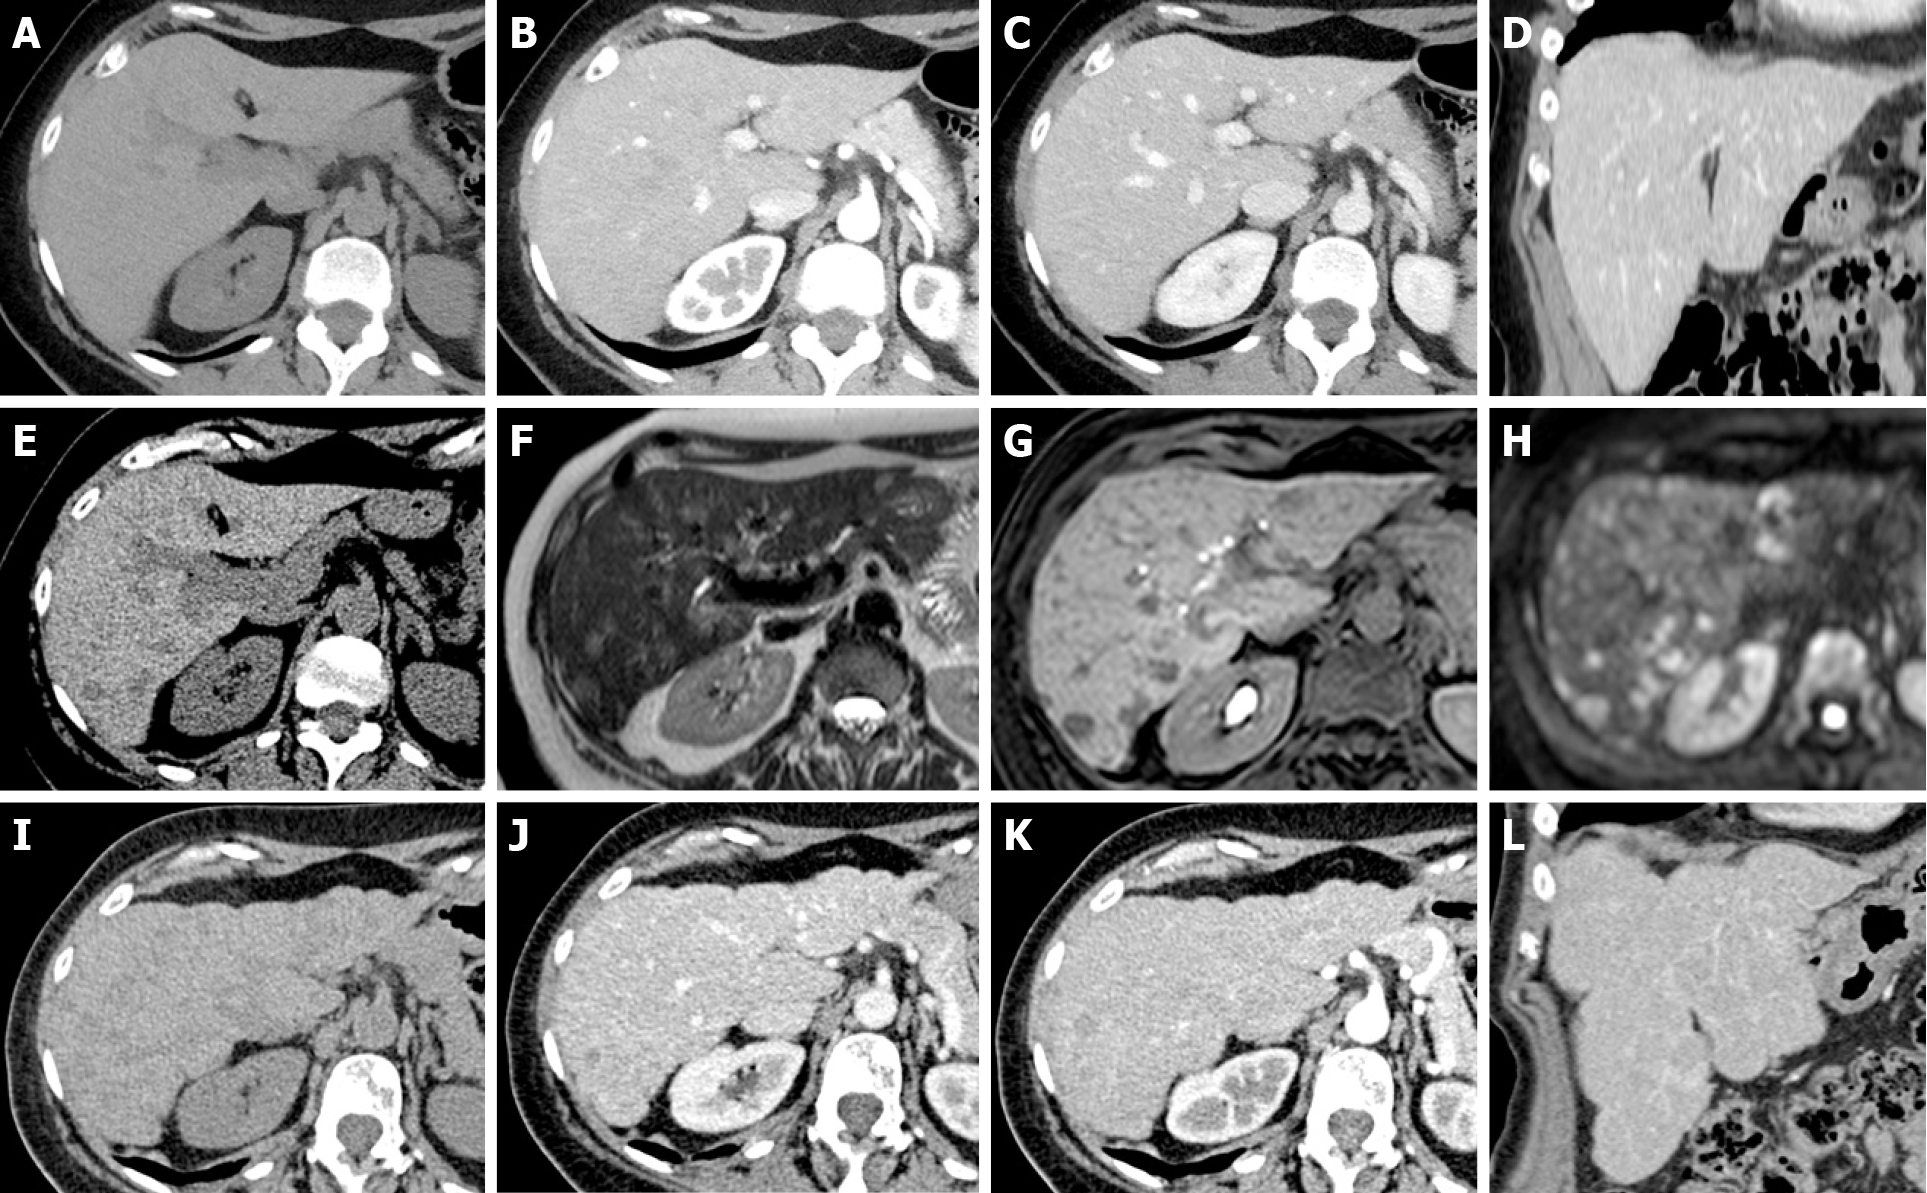
Figure 15 Pseudocirrhosis in patients with breast cancer treated with surgery and 6 mo of chemotherapy (capecitabine and monoclonal antibodies).
A-D: Unenhanced (A: Axial) and contrast-enhanced computed tomography (CT) (B: Axial arterial phase; C: Axial portal phase; D: Coronal portal phase) was performed at staging. The liver shows regular volume, morphology and a smooth surface. No focal lesions were found; thus, no chemotherapy was undertaken; E: At the 1-year follow-up, unenhanced CT demonstrated the appearance of a hypodense focal lesion (arrowhead); F-H: A complete magnetic resonance study with liver-specific contrast agent confirmed the presence of new focal lesions consistent with metastases. Mild hyperintensity in the T2w sequence (F), clear hypointensity in the fat sat gradient echo 3D T1w hepatobiliary phase (G) and high signal in diffusion-weighted images (H) are shown. Chemotherapy was started. I-L: A 6-mo follow-up unenhanced (I: Axial) and contrast-enhanced CT (J: Axial arterial phase; K: Axial portal phase; L: Coronal portal phase) shows typical signs of liver pseudocirrhotic changes: parenchymal volume reduction, irregular macrocyclic margins, right lobe atrophy and caudate lobe hypertrophy.
- Citation: Calistri L, Rastrelli V, Nardi C, Maraghelli D, Vidali S, Pietragalla M, Colagrande S. Imaging of the chemotherapy-induced hepatic damage: Yellow liver, blue liver, and pseudocirrhosis. World J Gastroenterol 2021; 27(46): 7866-7893
- URL: https://www.wjgnet.com/1007-9327/full/v27/i46/7866.htm
- DOI: https://dx.doi.org/10.3748/wjg.v27.i46.7866


