Copyright
©The Author(s) 2021.
World J Gastroenterol. Nov 28, 2021; 27(44): 7669-7686
Published online Nov 28, 2021. doi: 10.3748/wjg.v27.i44.7669
Published online Nov 28, 2021. doi: 10.3748/wjg.v27.i44.7669
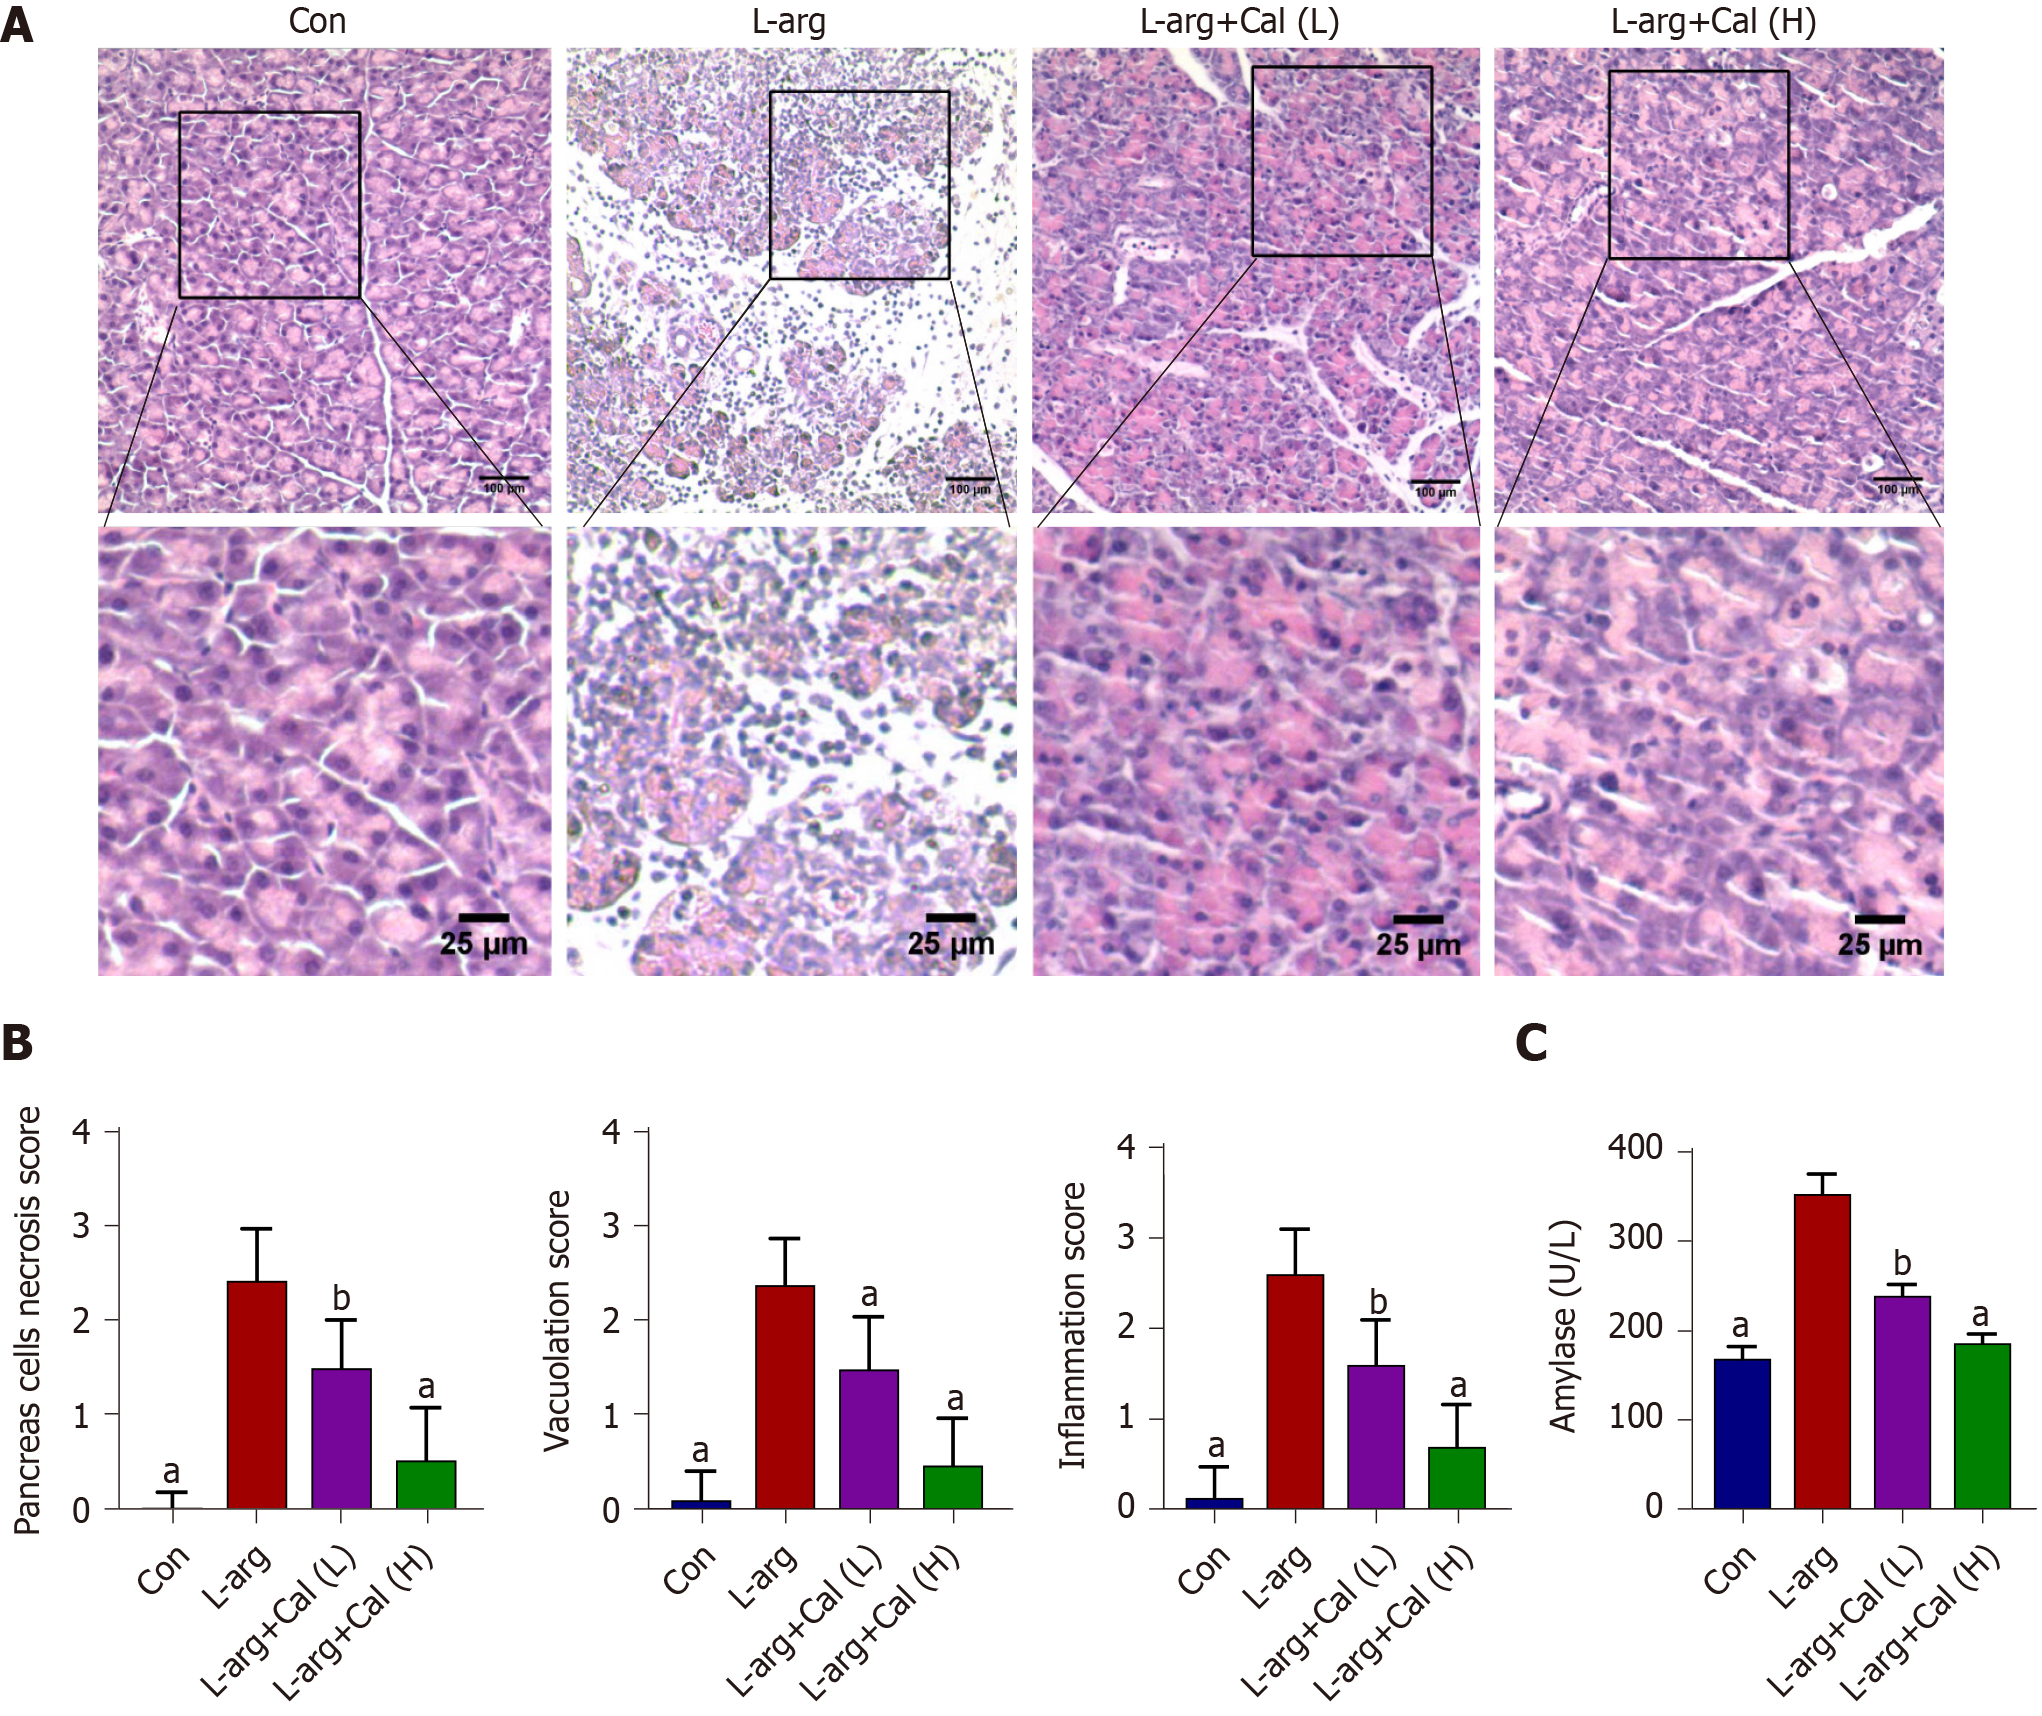
Figure 1 Effects of calycosin on L-arginine induced severe acute pancreatitis.
Mice were pretreated with calycosin [calycosin (Cal): 25 and 50 mg/kg] for 1 h, L-arginine (L-arg: 4 g/kg) was intraperitoneally (i.p.) injected every hour for two consecutive hours. A: The histological assessment of pancreatic tissue damage in the control (Con), L-arg and Cal group (L: 25 mg/kg; H: 50 mg/kg); B: Pancreatic histological scores; C: Serum amylase and lipase levels. Data represent mean ± SD values. aP < 0.001 vs L-arg group; bP < 0.01 vs L-arg group. Con: Control group; Cal: Calycosin group; L-arg: L-arginine group.
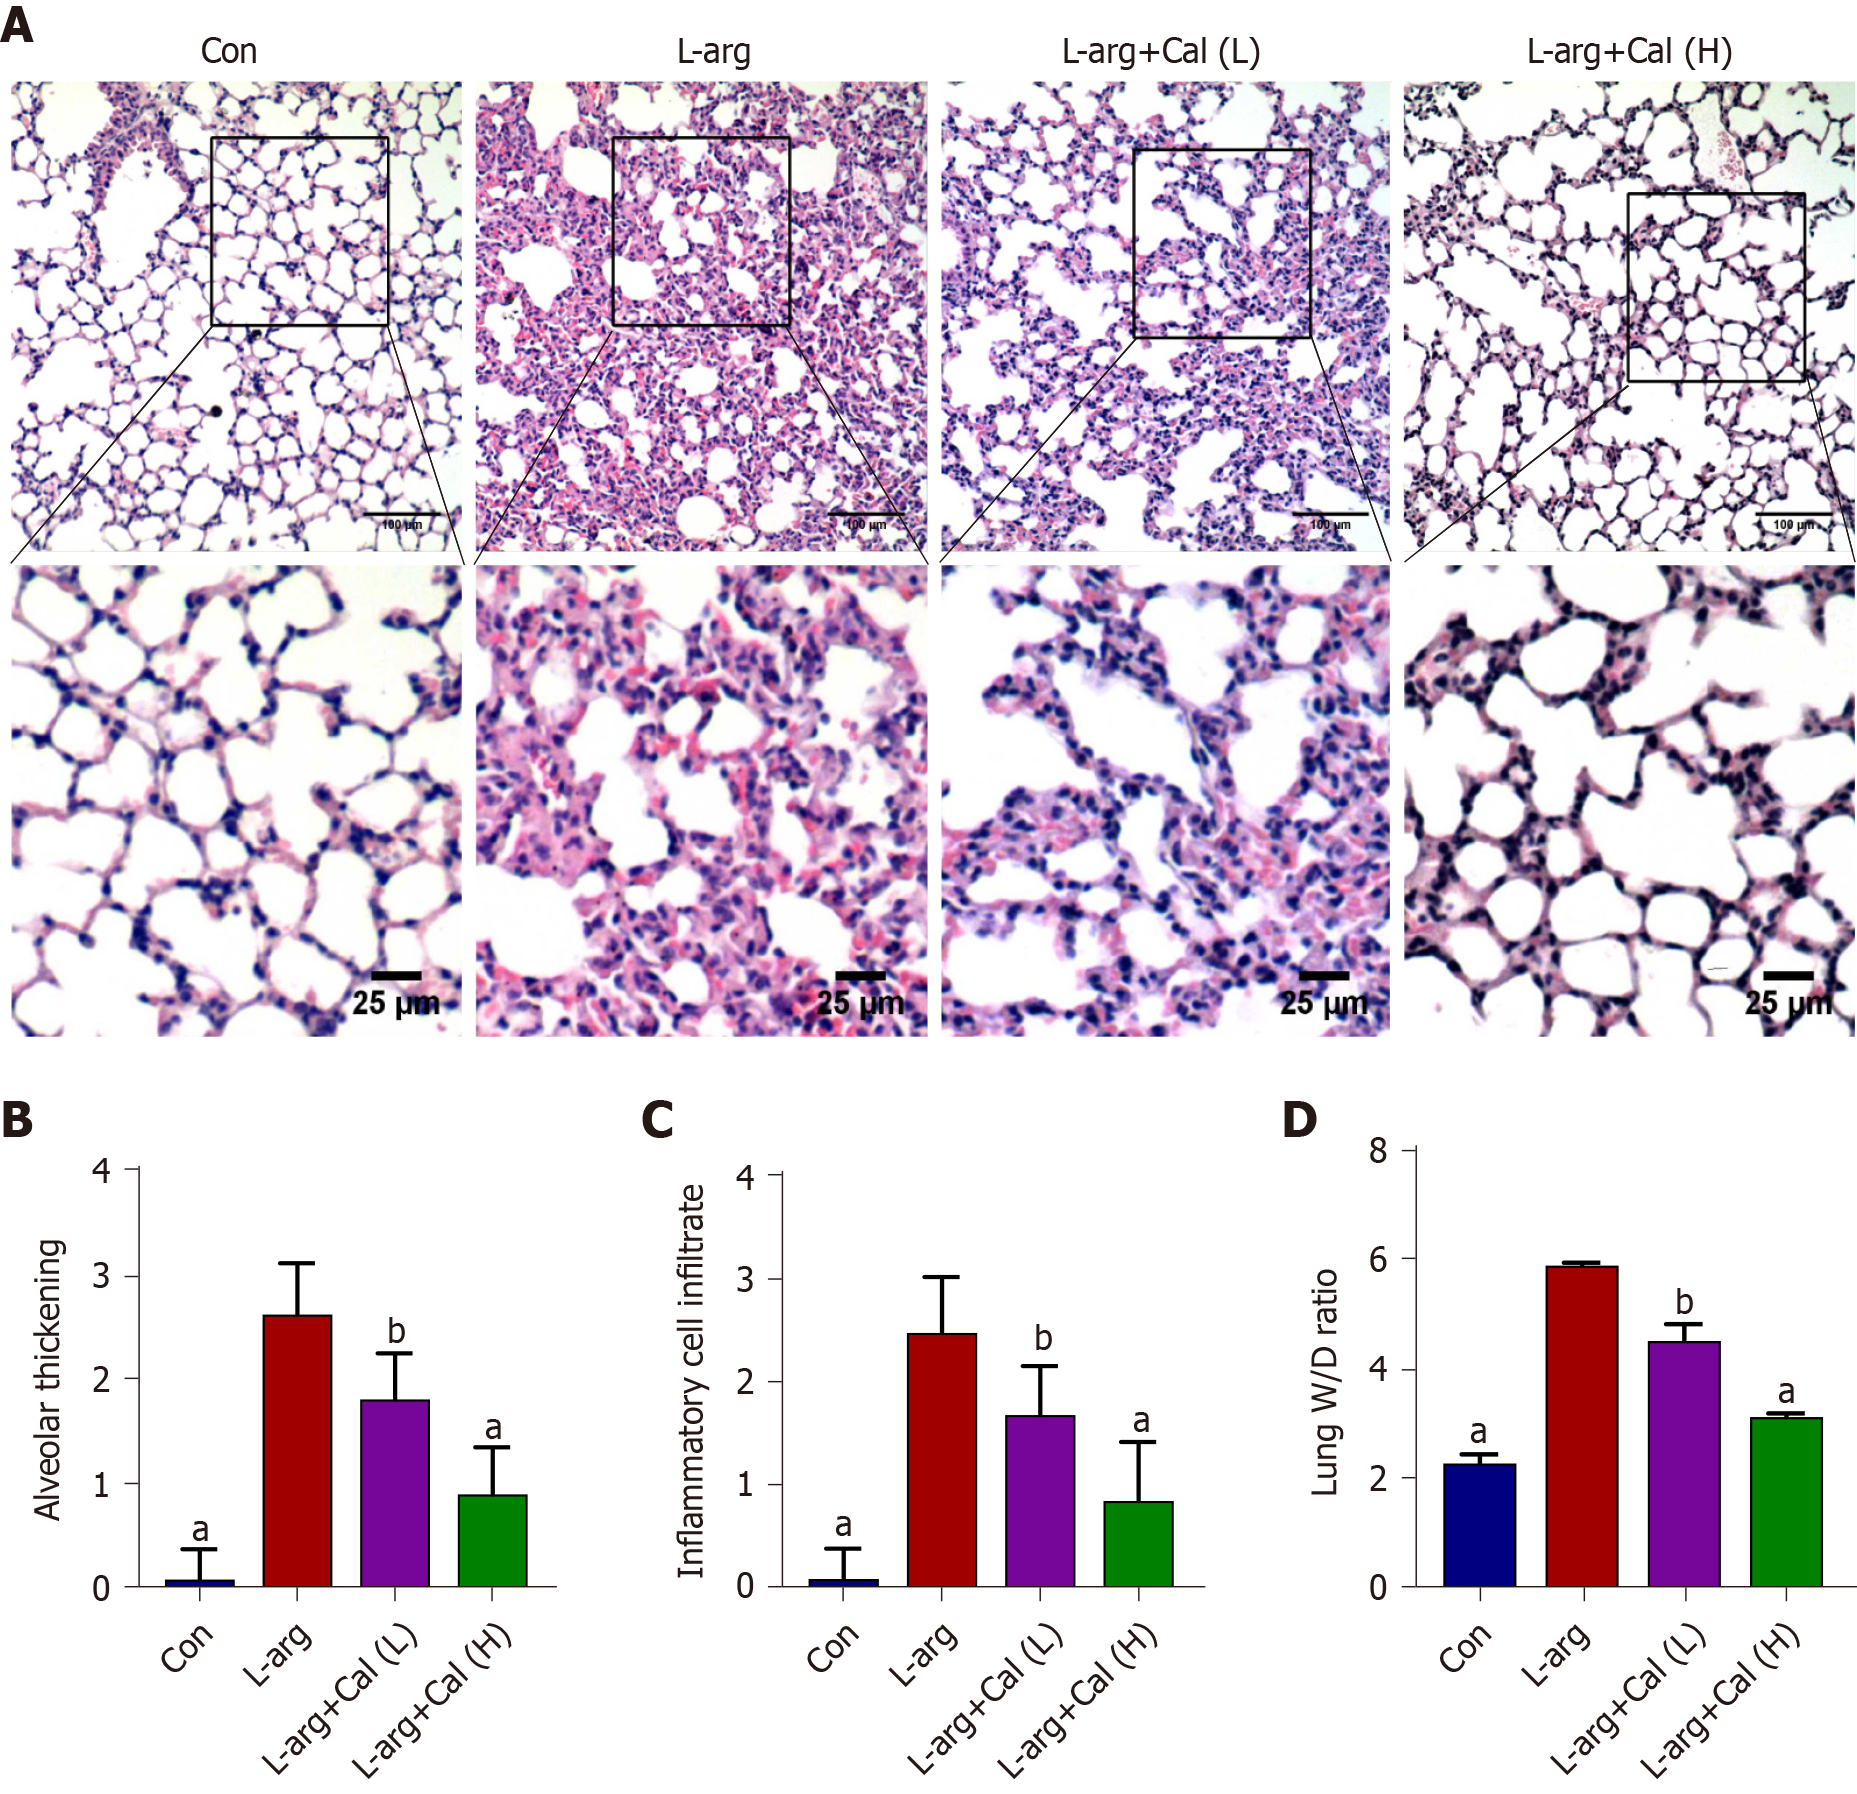
Figure 2 The effects of calycosin on histopathological findings of lung tissue in mice.
H&E sections were examined by light microscopy. A: Representative pathological images of the lung tissue; B: Lung injury scores in alveolar thickness; C: Inflammatory infiltrate; D: The lung wet/dry weight ratios are shown. Data represent mean ± SD values. aP < 0.001 vs L-arg group; bP < 0.01 vs L-arg group. Con: Control group; Cal: Calycosin group; L-arg: L-arginine group.
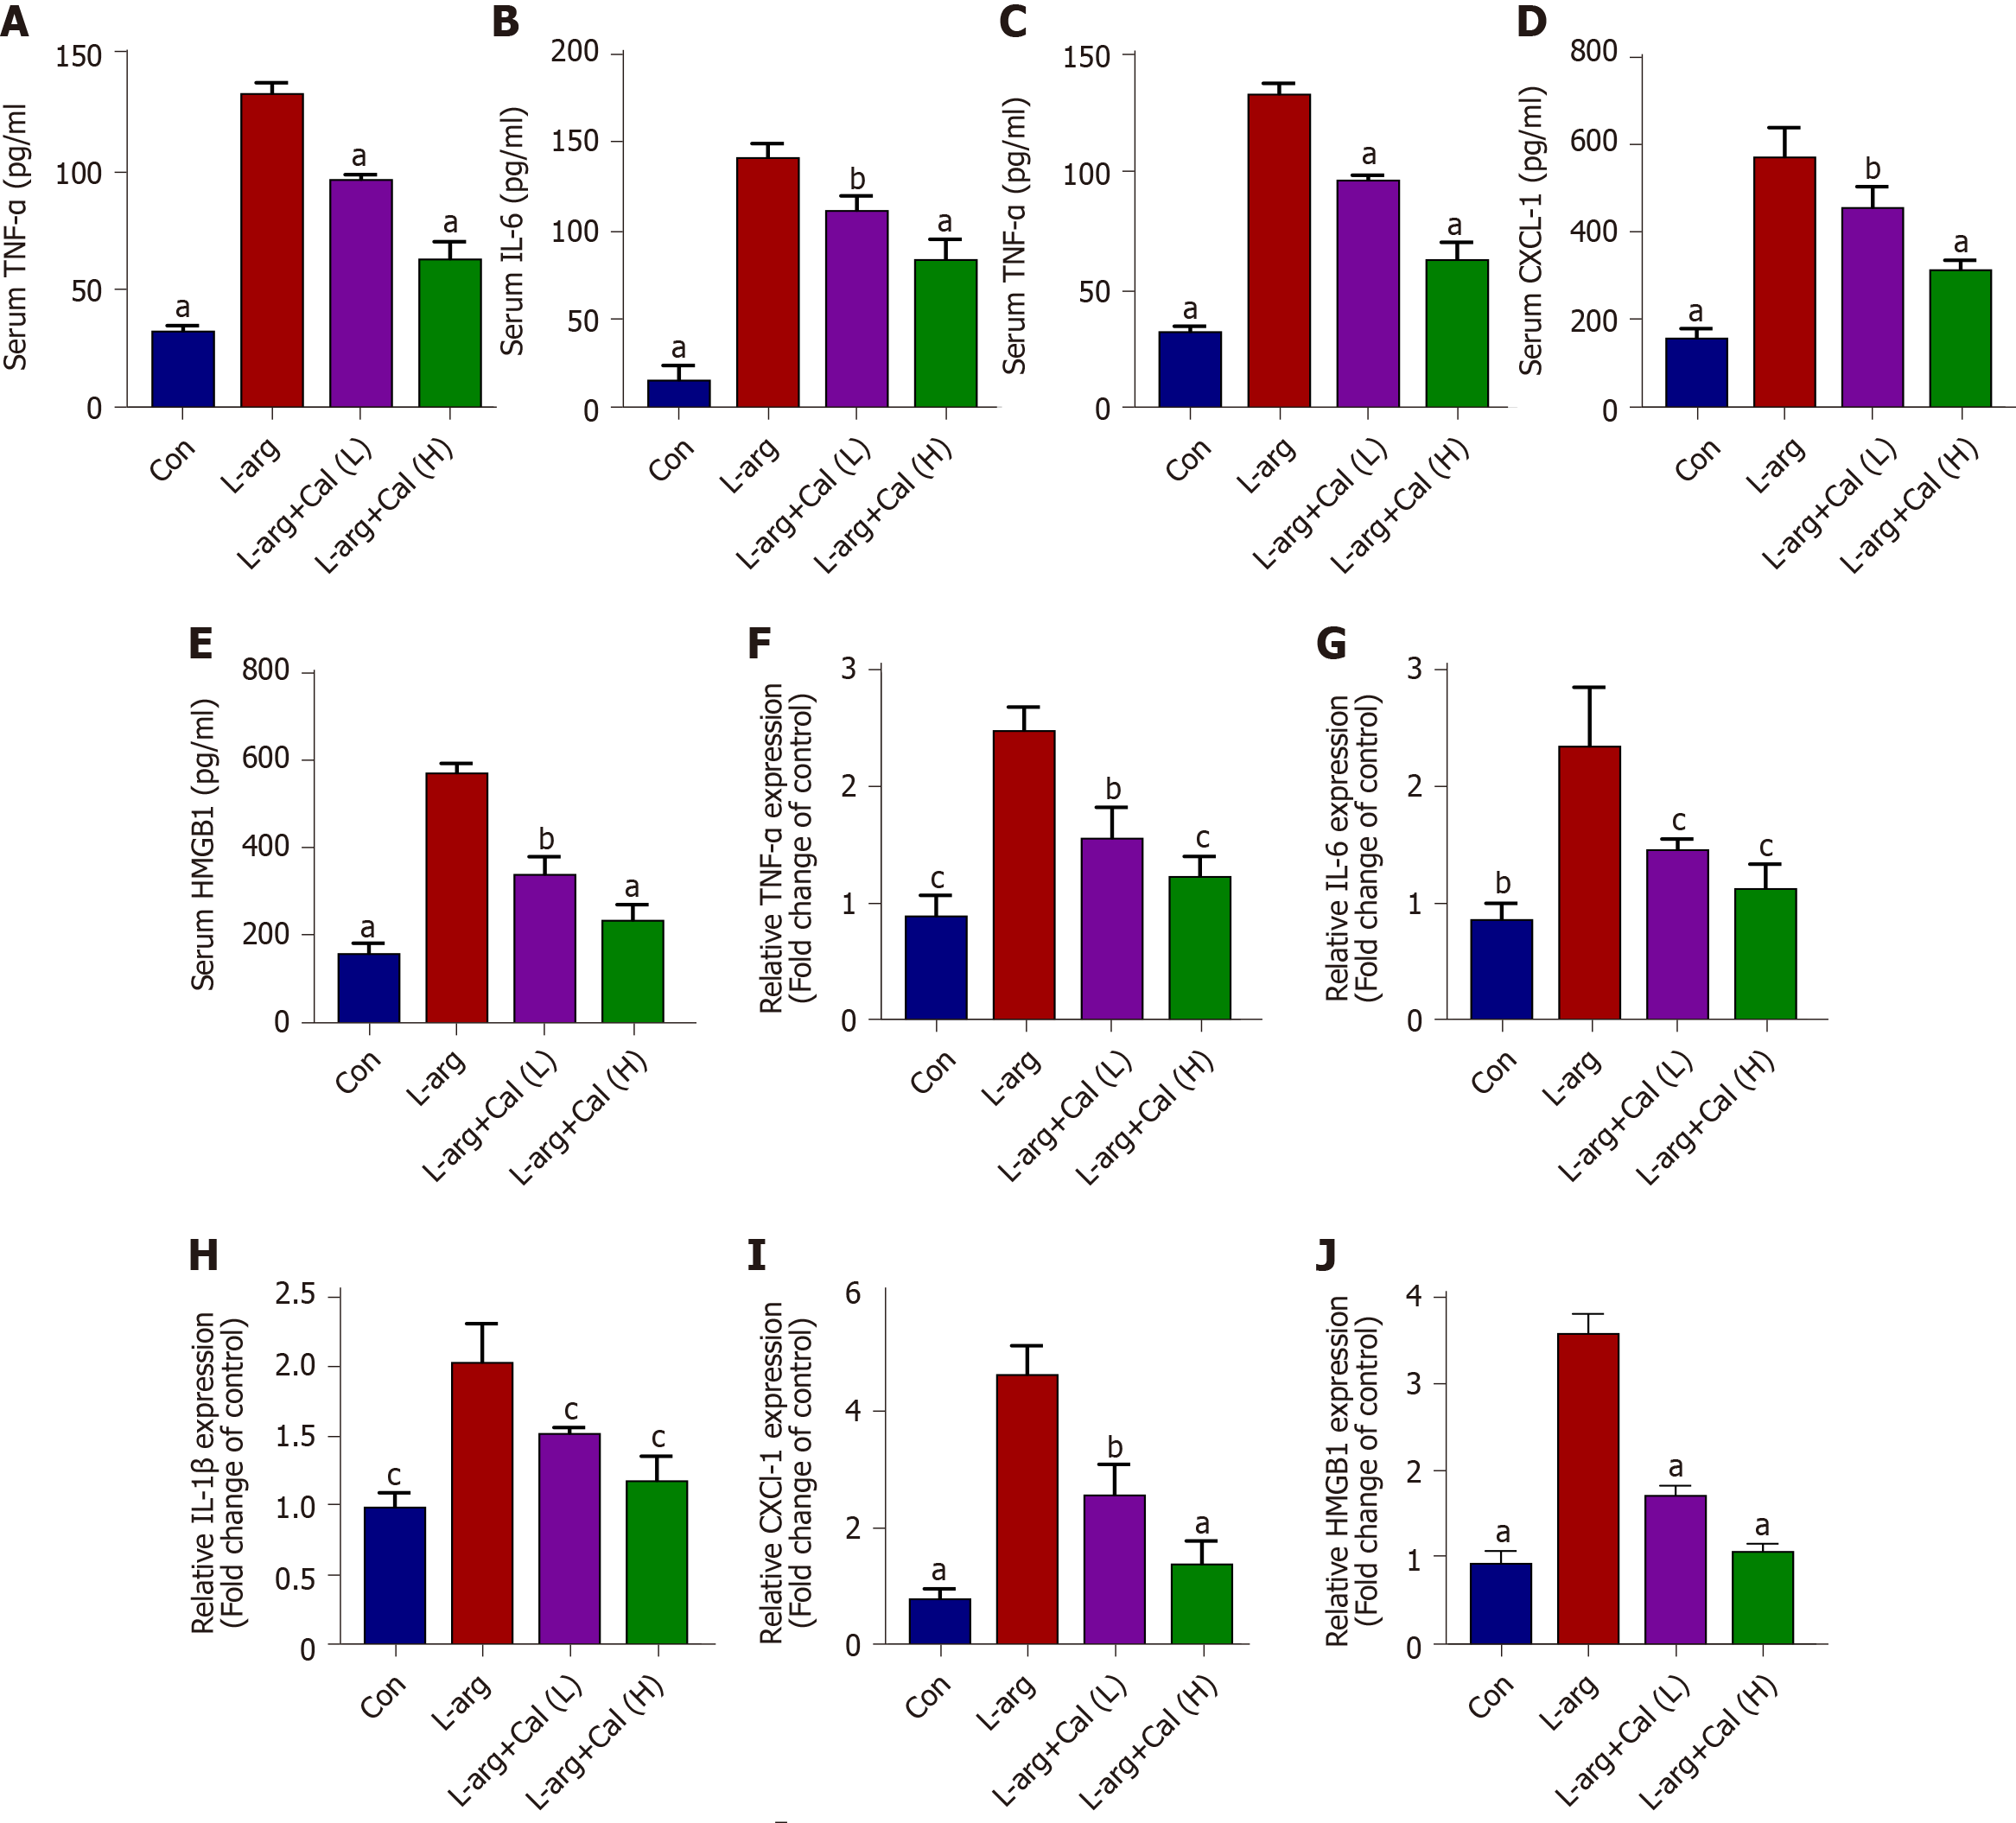
Figure 3 Effect of calycosin on tumor necrosis factor α, interleukin-6, interleukin-1β, chemokine ligand 1 and high mobility group box 1 in serum and mRNA levels.
A: TNF-α; B: IL-6; C: IL-1β; D: CXCL-1; E: HMGB1 in serum levels were determined by ELISA kits. F: TNF-α; G: IL-6; H: IL-1β; I: CXCL-1; J: HMGB1 in mRNA levels. Data represent mean ± SD values. aP < 0.001 vs L-arg group; bP < 0.01 vs L-arg group; cP < 0.05 vs L-arg group. TNF-α: Tumor necrosis factor α; IL-6: Interleukin-6; IL-1β: Interleukin-1β; HMGB1: High mobility group box 1; CXCL-1: Chemokine ligand 1; L-arg: L-arginine; Con: Control group; Cal: Calycosin group; L-arg: L-arginine group.
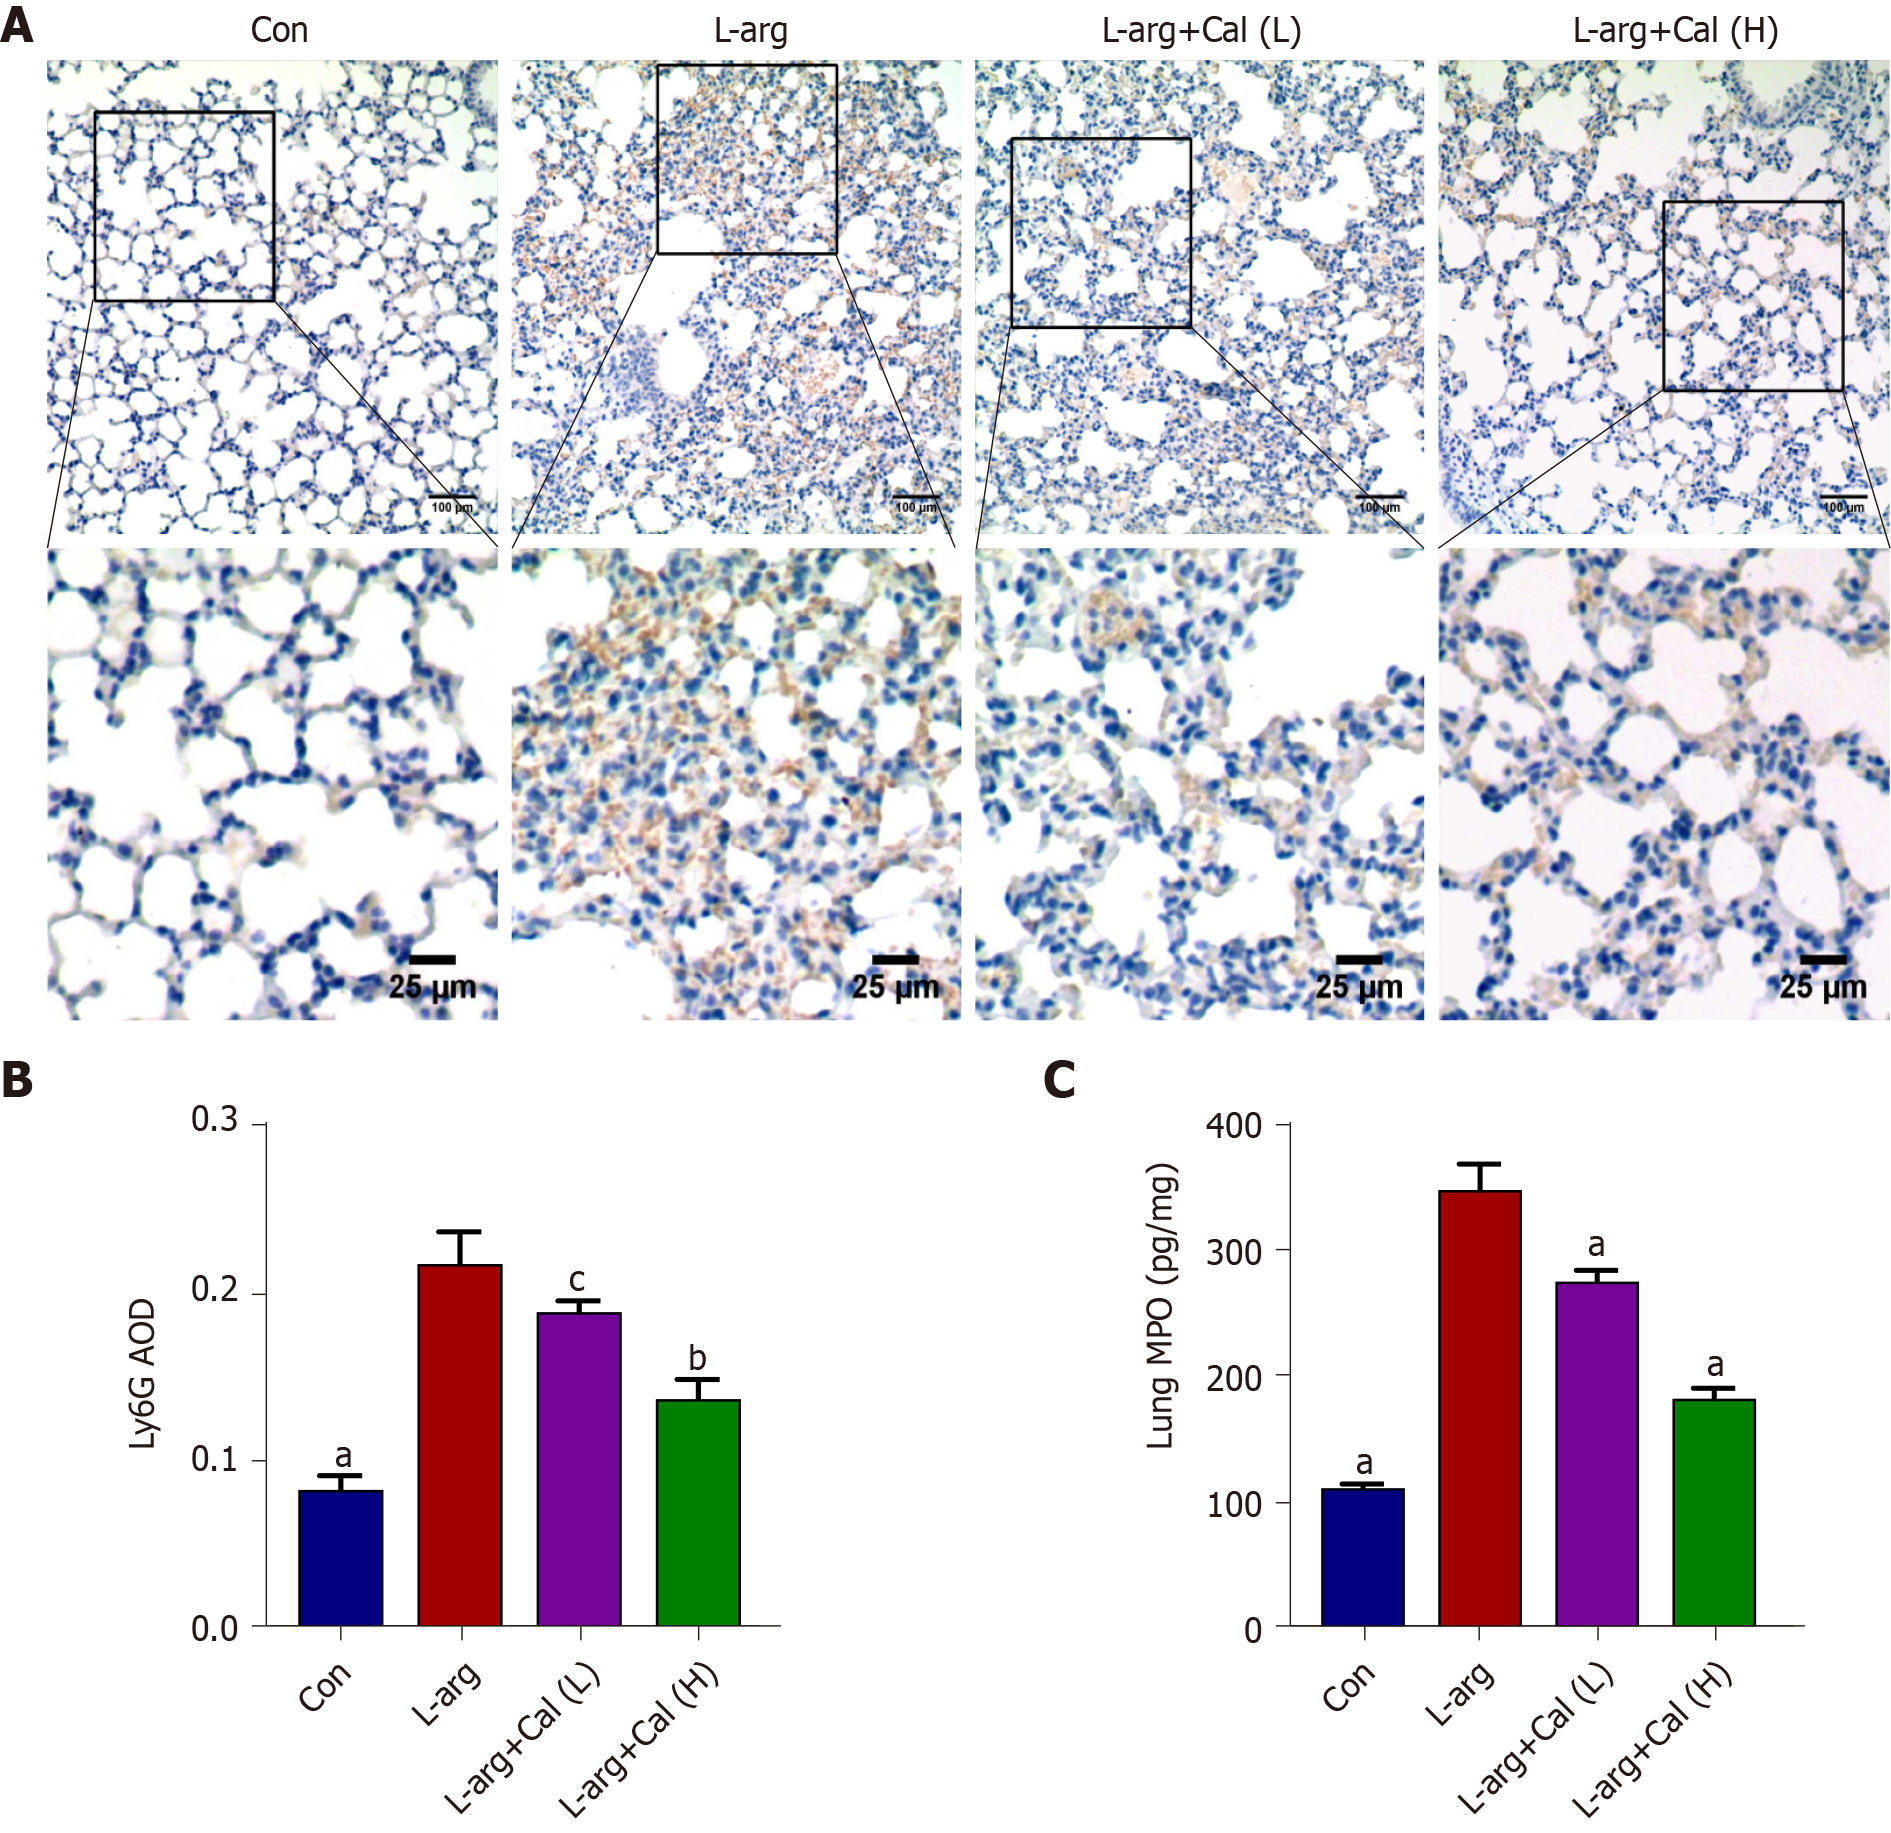
Figure 4 The effect of calycosin on the immunological staining of lung slices for Ly6G.
A: Micrographs of lung section stained with immunological staining of lung slices for Ly6G (brown); B: Average optical density for Ly6G was determined; C: Levels of myeloperoxidase in per milligram lung tissue were determined by enzyme-linked immunosorbent assay kits. Data represent mean ± SD values. aP < 0.001 vs L-arg group; bP < 0.01 vs L-arg group; cP < 0.05 vs L-arg group. Con: Control group; Cal: Calycosin group; L-arg: L-arginine group.
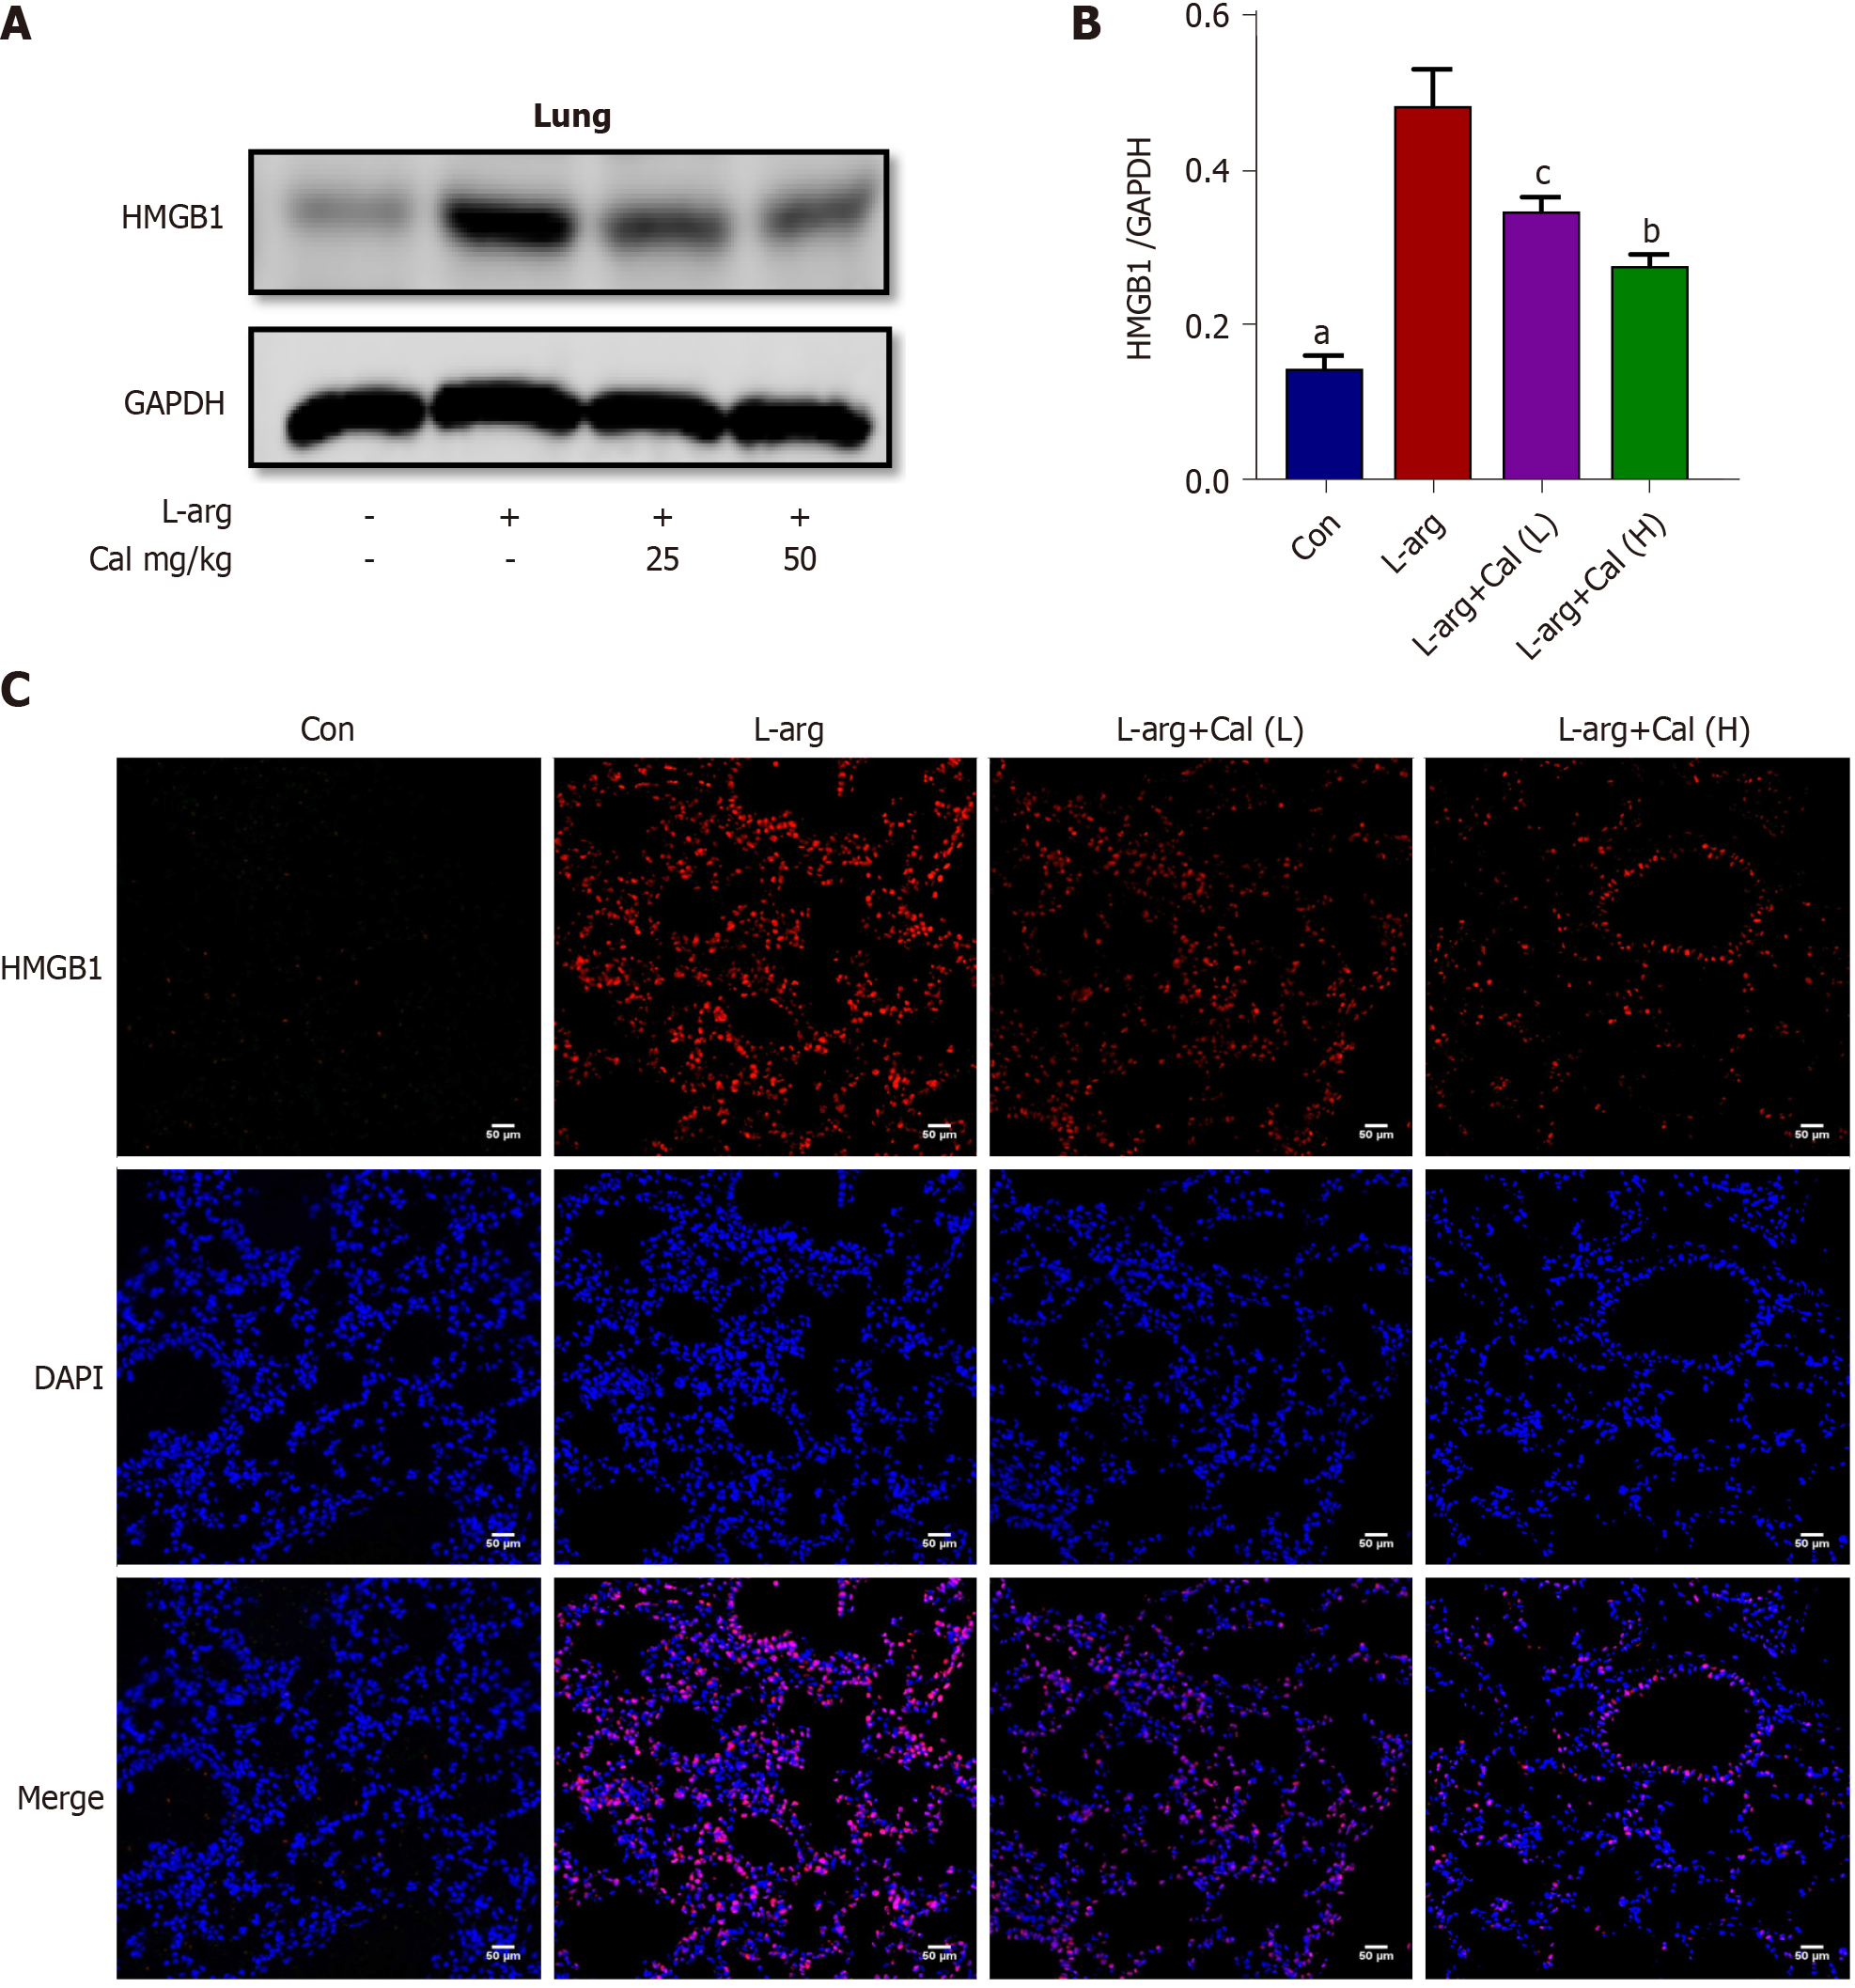
Figure 5 Effects of calycosin on the expression of high mobility group box 1 in lung tissues.
A: Western blot detection of high mobility group box 1 (HMGB1) expression in lung tissue; B: Quantitative analysis of HGMB1 in lung tissue; C: Immunofluorescence staining of HMGB1 in lung tissue. Data represent mean ± SD values. aP < 0.001 vs L-arg group; bP < 0.01 vs L-arg group; cP < 0.05, vs L-arg group. L-arg: L-arginine; HMGB1: High mobility group box 1; Con: Control group; Cal: Calycosin group.
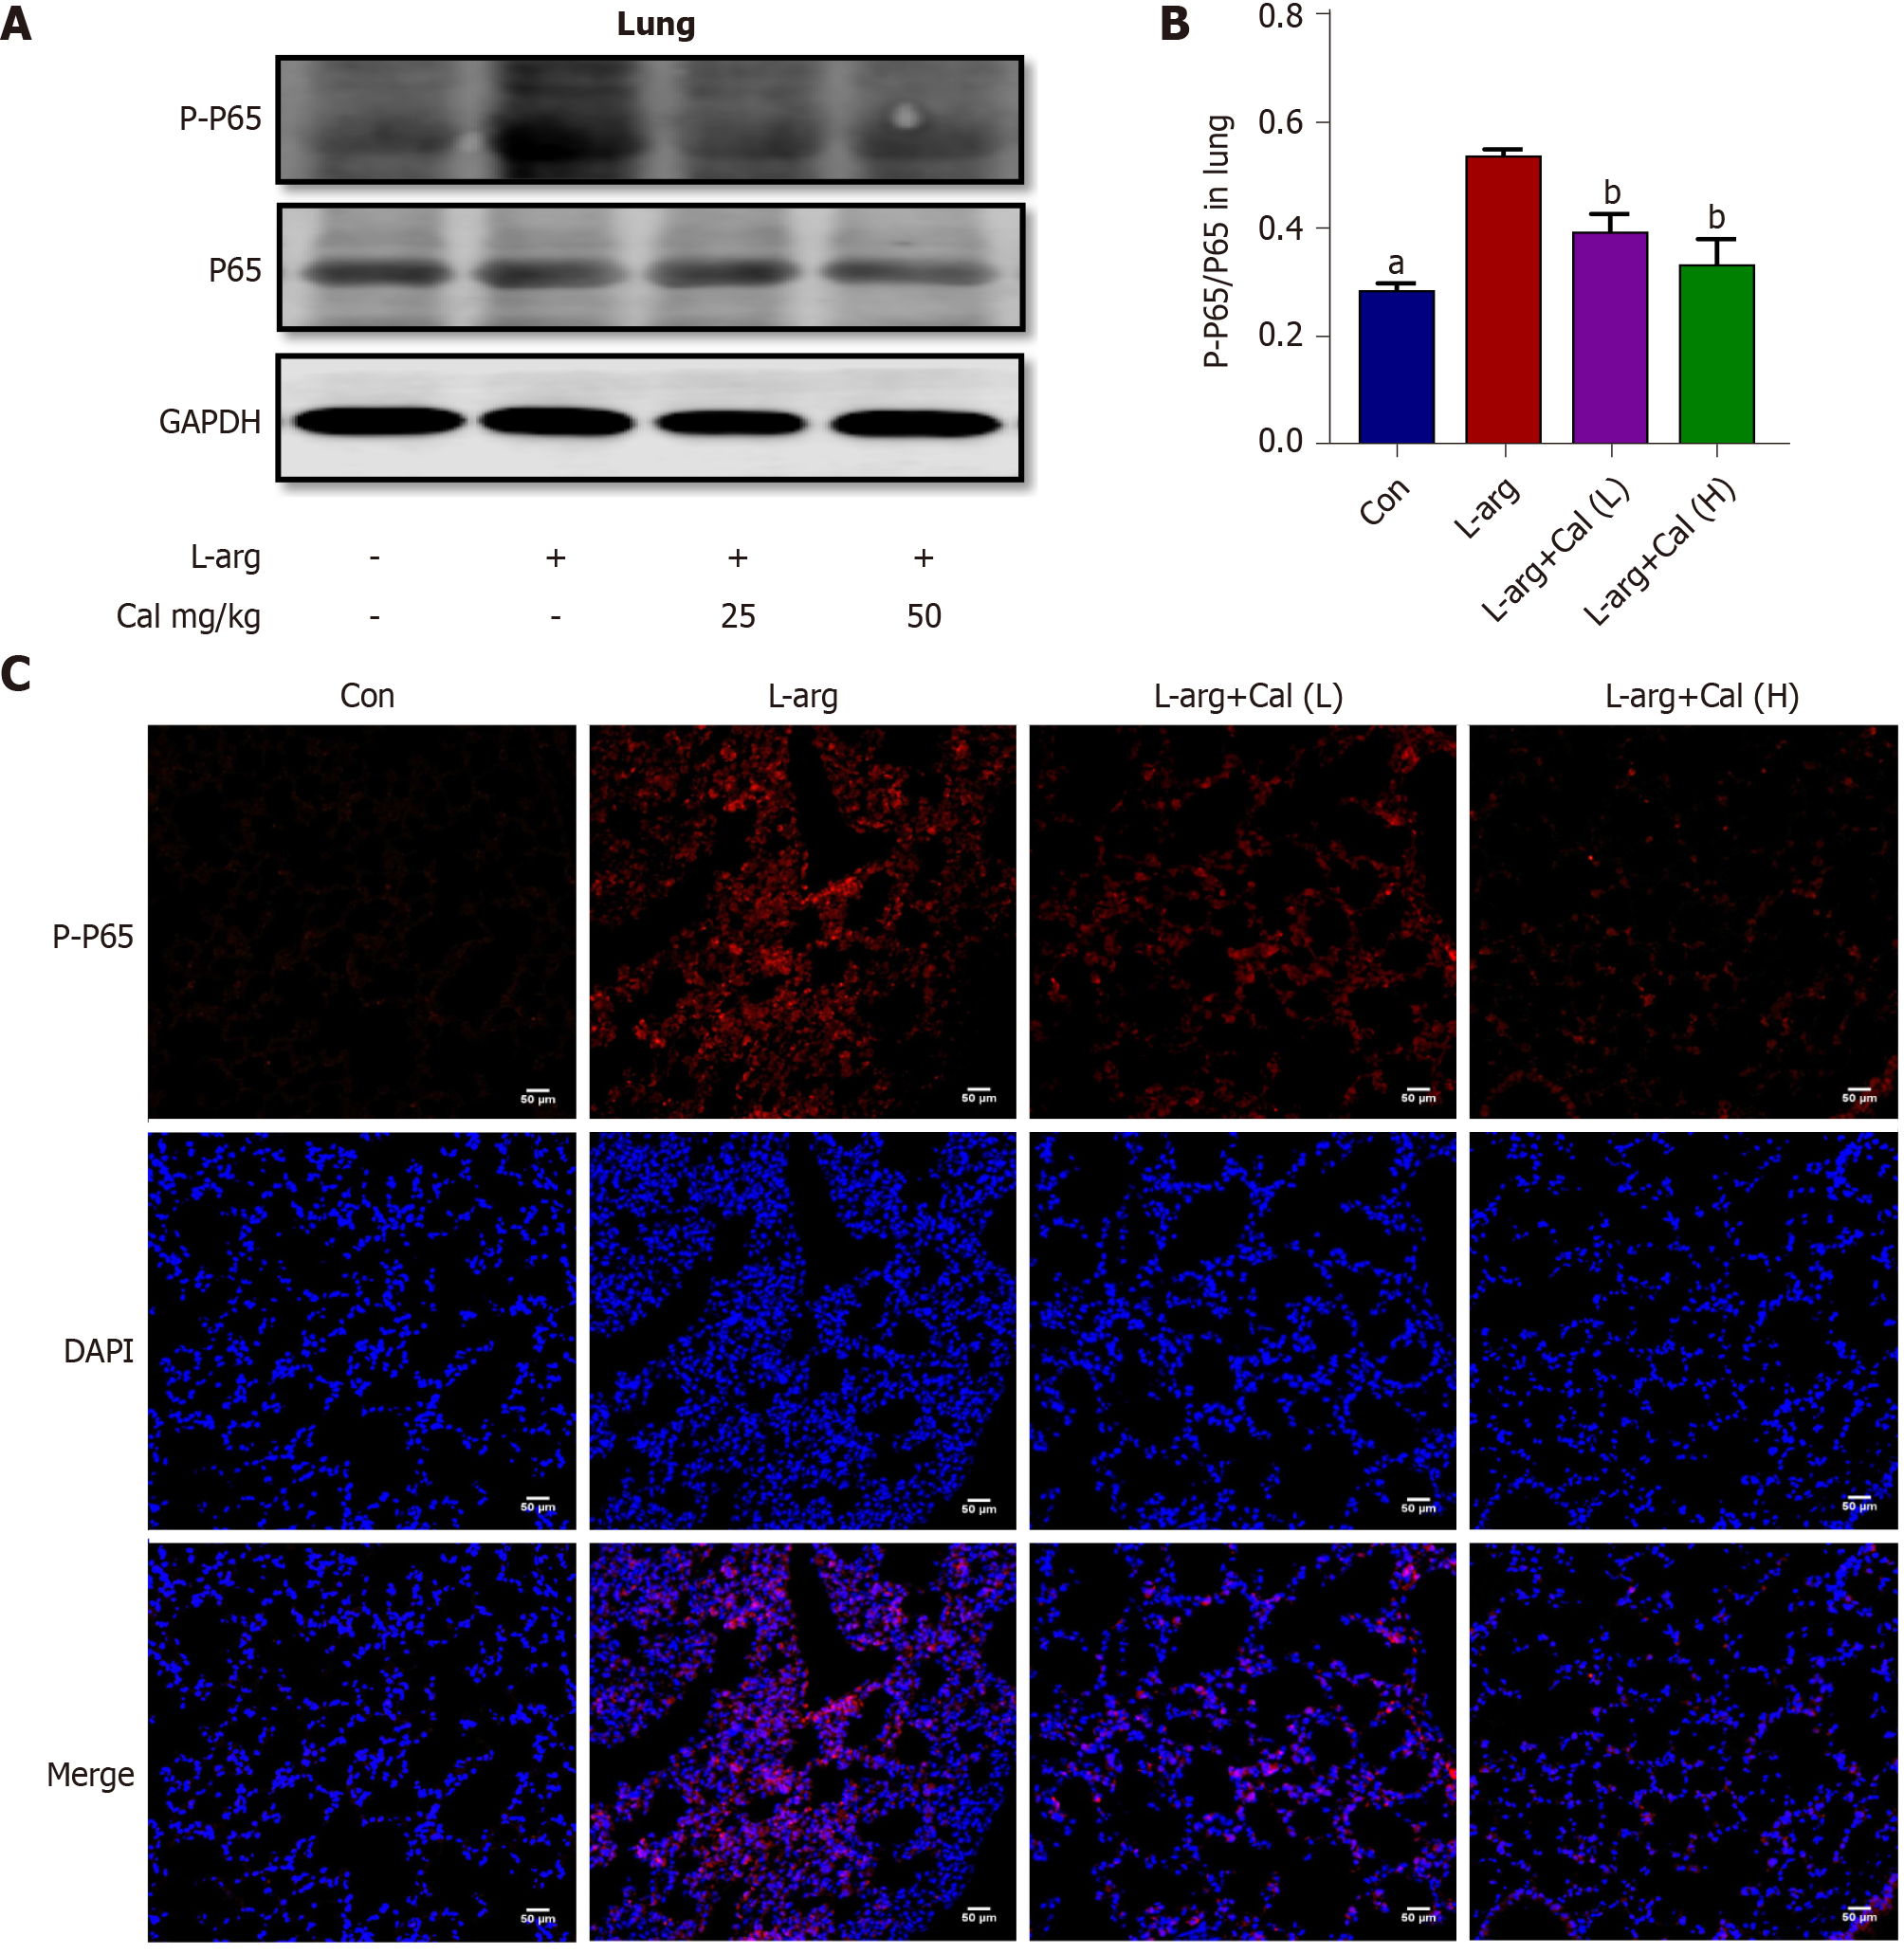
Figure 6 Effects of calycosin on the expression of phosphorylated nuclear factor-kappa B-p65 expression in lung tissues.
A: Western blot detection of phosphorylated nuclear factor-kappa B-p65 (NF-κB-p65) expression in lung tissue; B: Quantitative analysis of phosphorylated NF-κB-p65 in lung tissue; C: Immunofluorescence staining of phosphorylated NF-κB-p65 in lung tissue. Data represent mean ± SD values. aP < 0.001 vs L-arg group; bP < 0.01 vs L-arg group. p-p65: Phosphorylated nuclear factor-kappa B-p65; Con: Control group; Cal: Calycosin group; L-arg: L-arginine group.
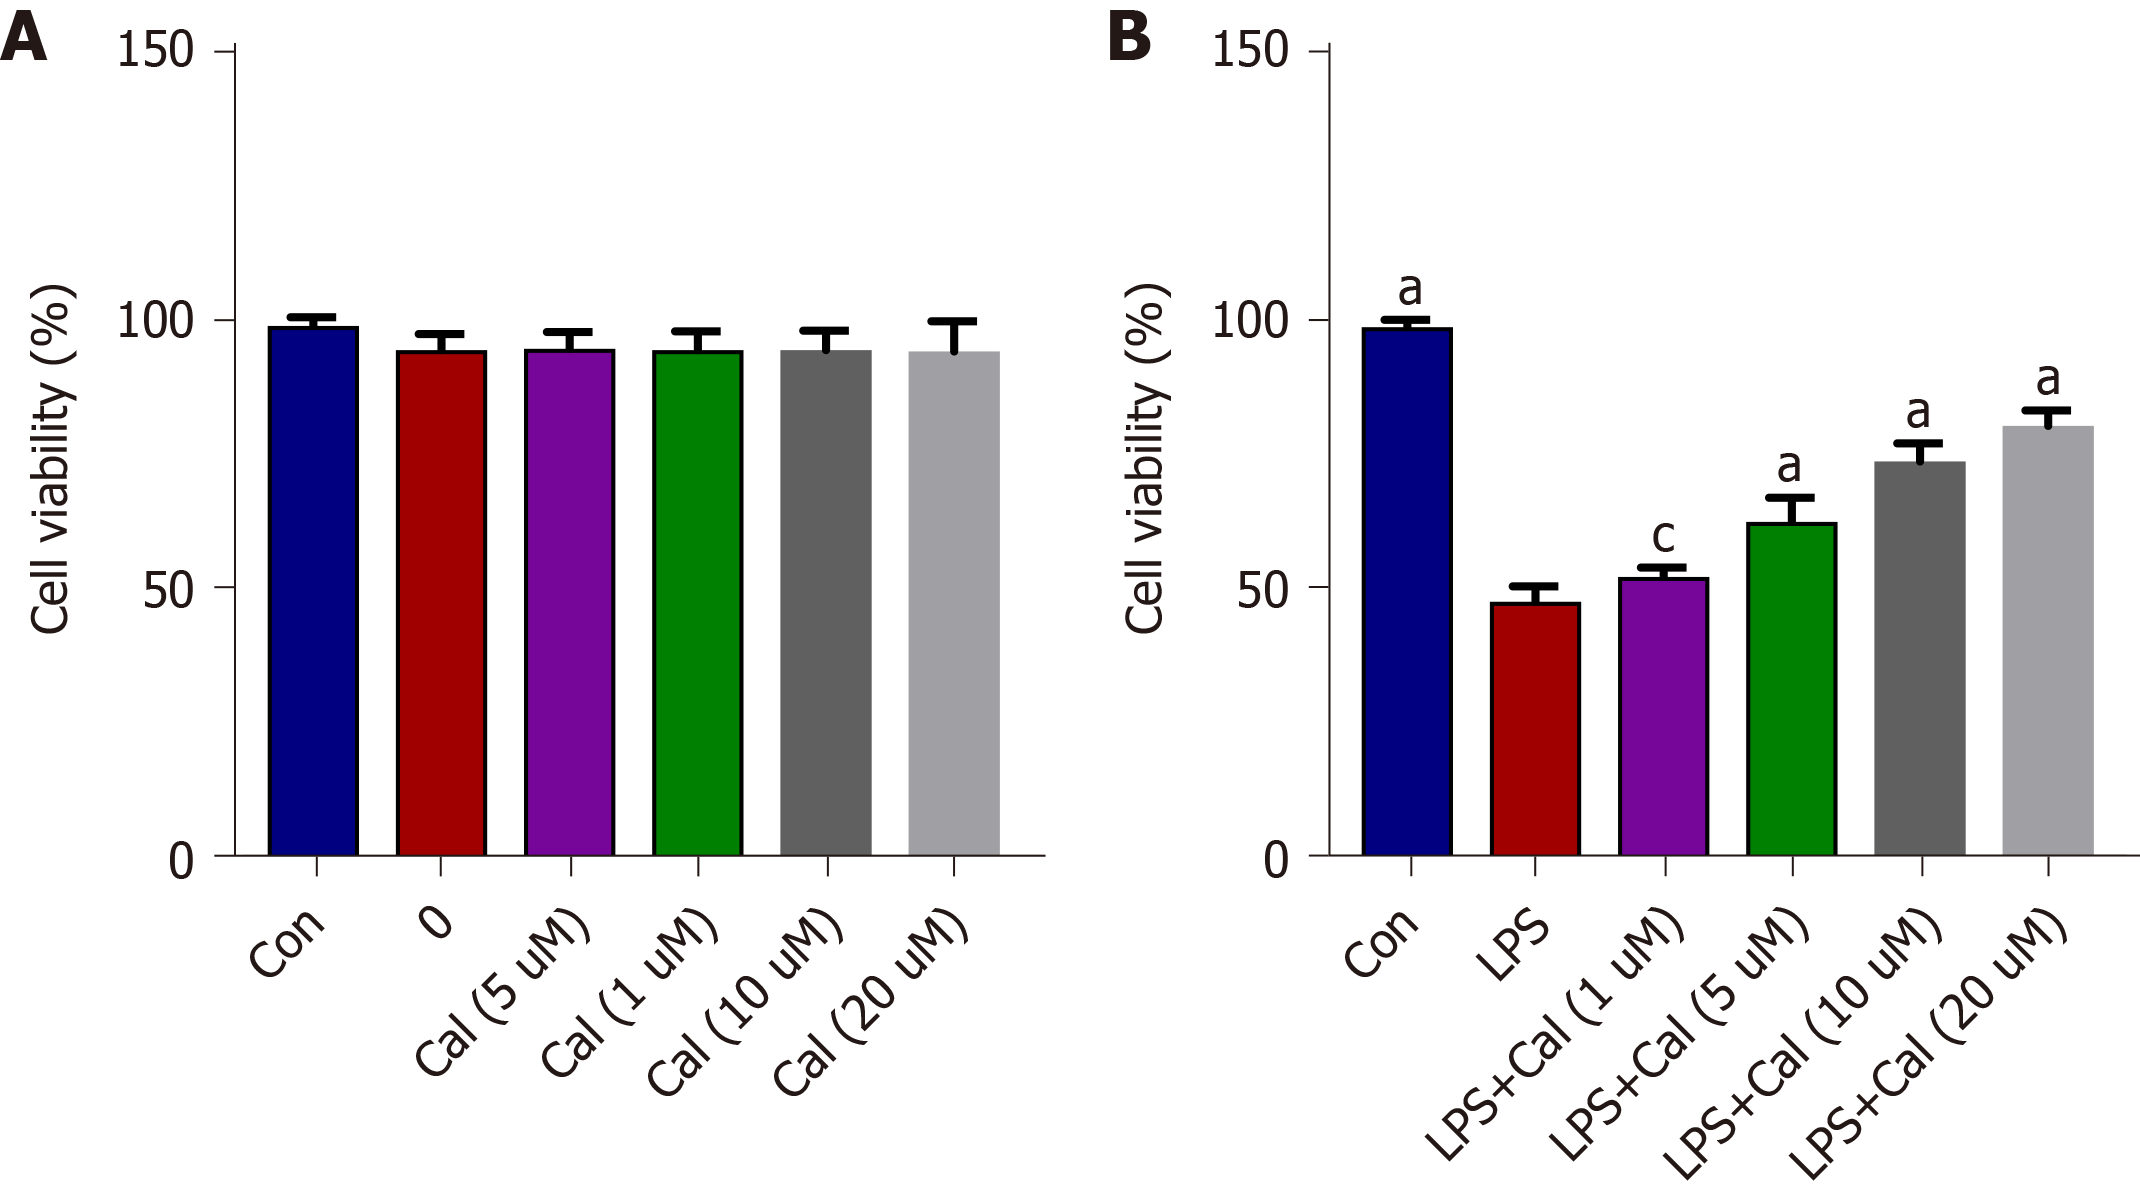
Figure 7 Effects of calycosin on the cell viability of A549 cells.
A: Cell vitality was detected by the CCK8 assay after calycosin Cal (1 µM, 5 µM, 10 µM, and 20 µM) treatment; B: Cal pretreatment markedly increased cell vitality induced by lipopolysaccharide (LPS, 1 µg/mL). Data represent mean ± SD values. aP < 0.001 vs LPS group; cP < 0.05 vs L-arg group. Con: Control group; Cal: Calycosin group; LPS: Lipopolysaccharide group.
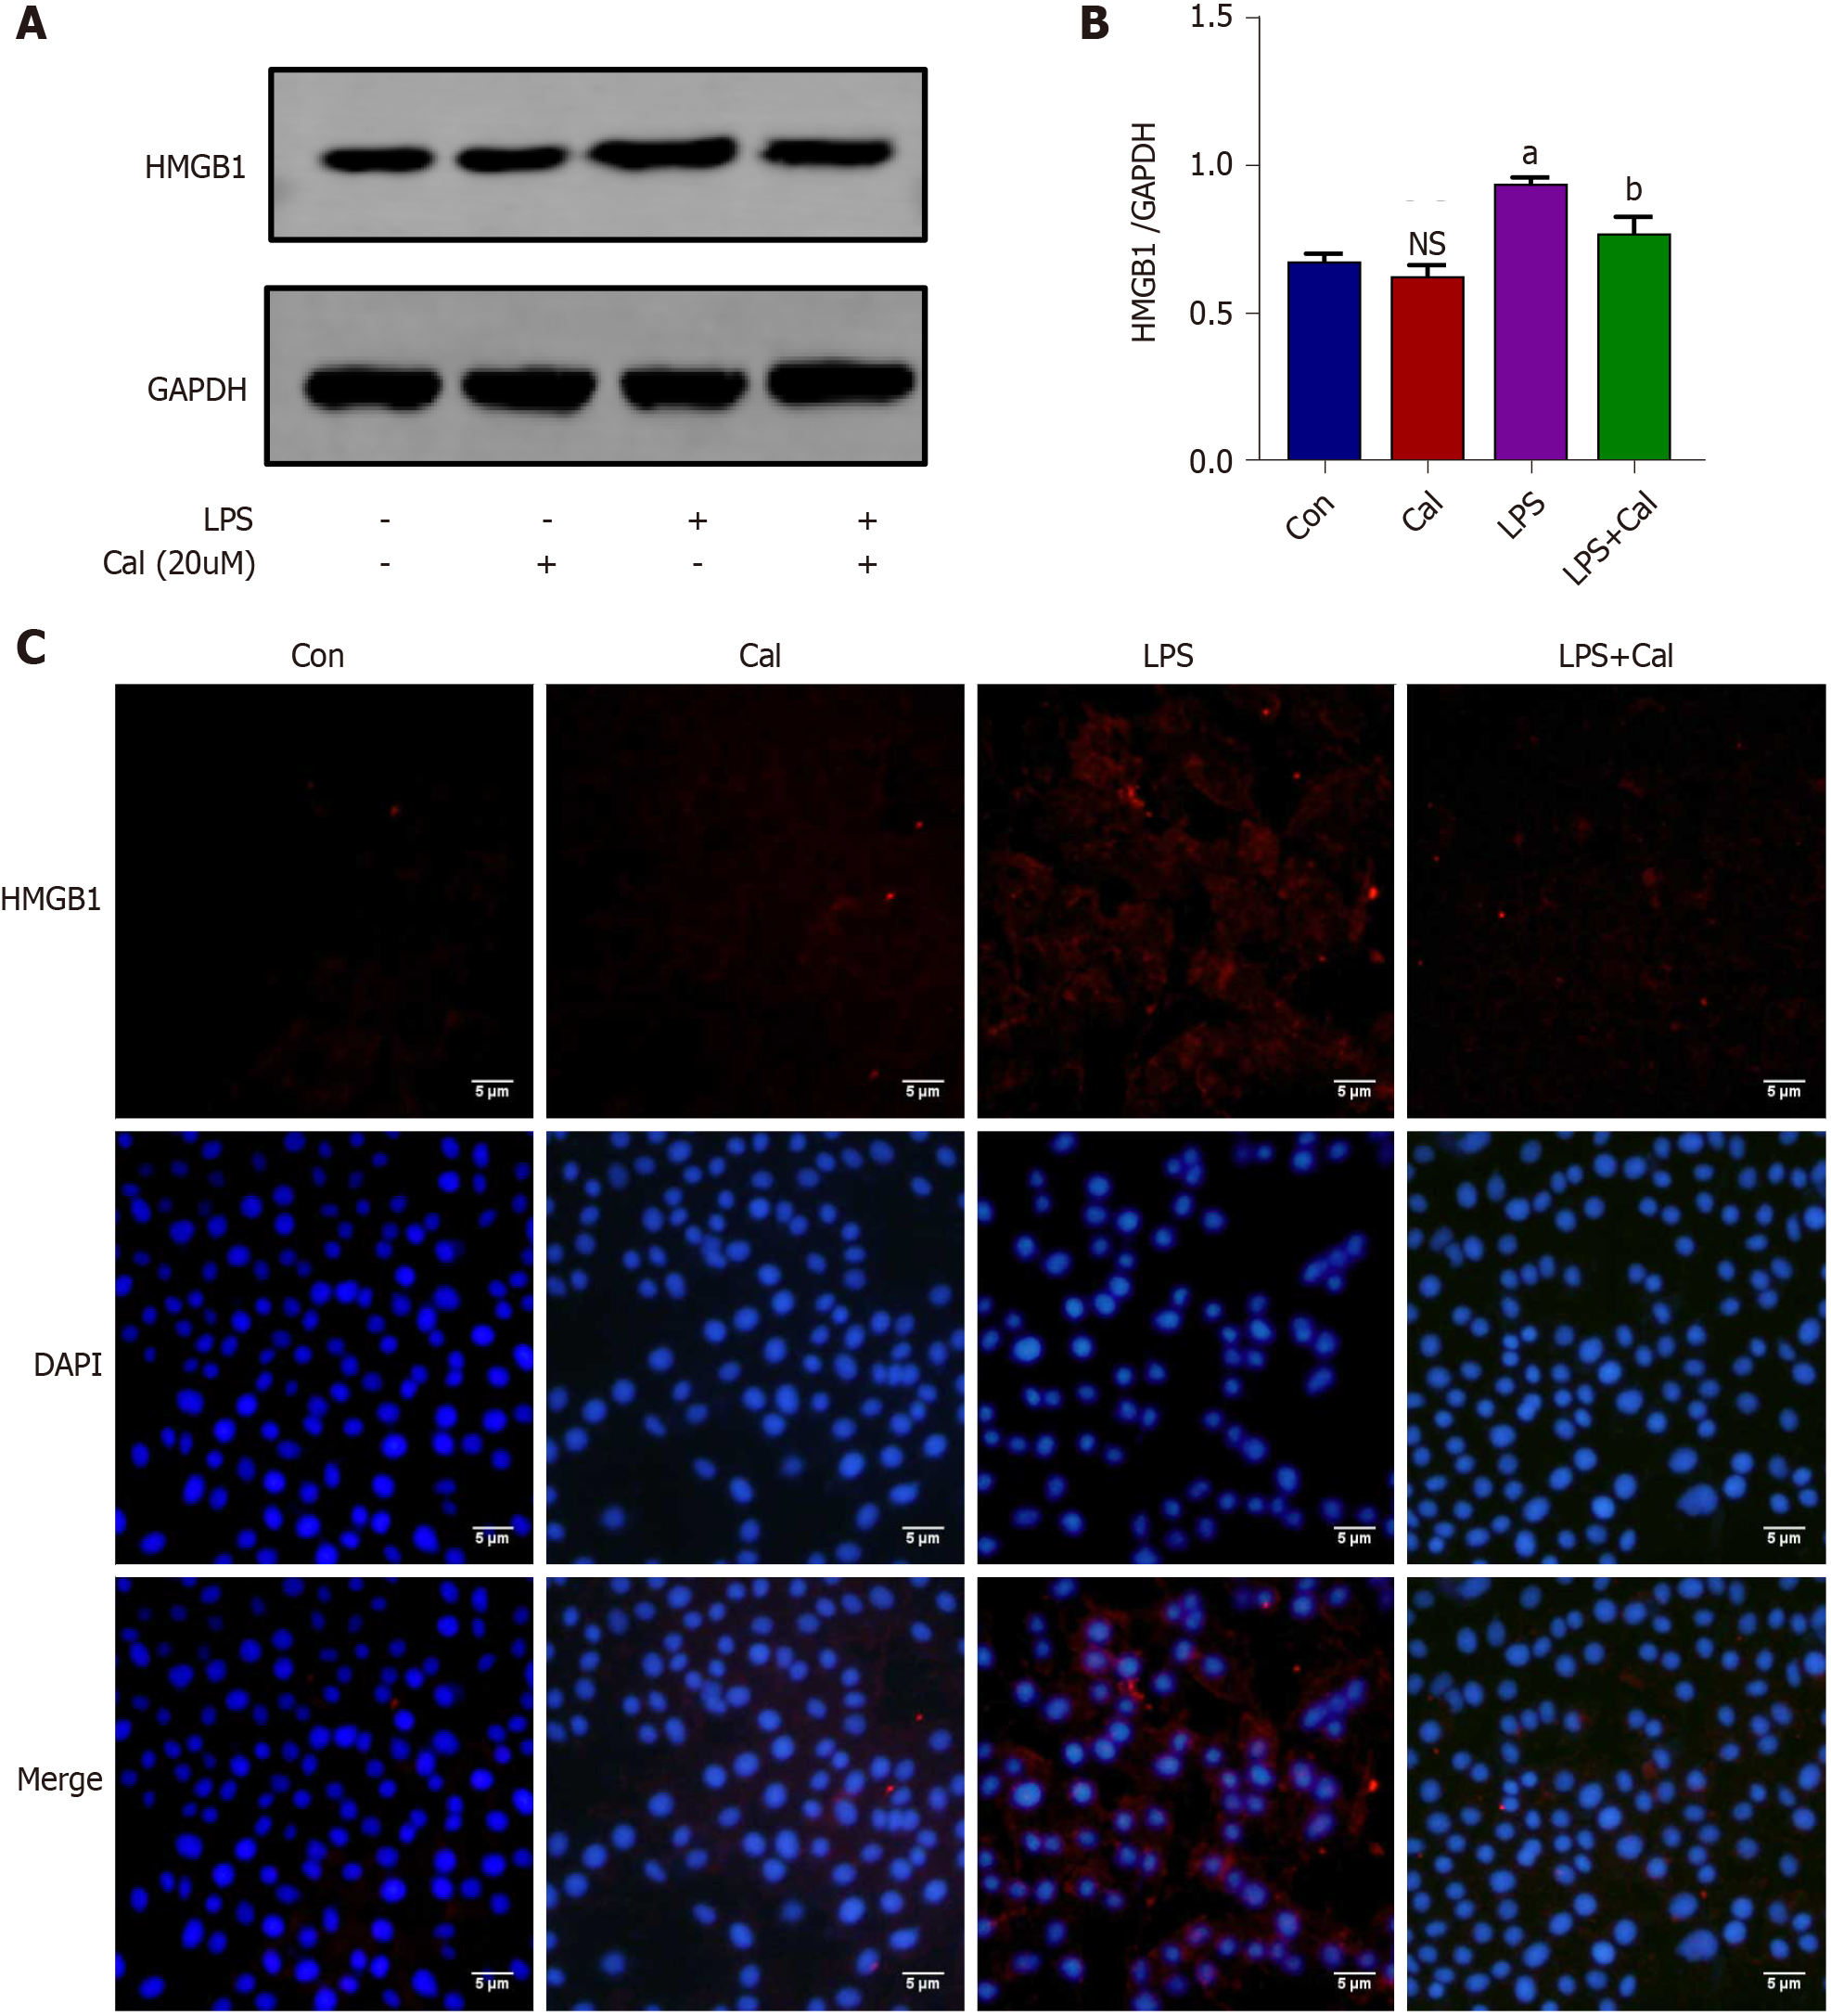
Figure 8 Effects of calycosin on the expression of high mobility group box 1 in vitro model of LPS-induced ALI using A549 cells.
A: Western blot detection of high mobility group box 1 (HMGB1) expression in A549 cells; B: Quantitative analysis of HMGB1 in A549 cells; C: Immunofluorescence staining of HMGB1 in A549 cells. Control group (untreated), Calycosin group (Cal, 20 µM), LPS group and LPS + Cal group were treated with 1 µg/mL LPS for 24 h in the absence or presence of Cal (20 µM) pretreatment for 1 h. Data represent mean ± SD values. aP < 0.001 vs control group; bP < 0.01 vs LPS group. ns: No significance vs Con group. HMGB1: High mobility group box 1; Con: Control group; Cal: Calycosin group; LPS: Lipopolysaccharide group.
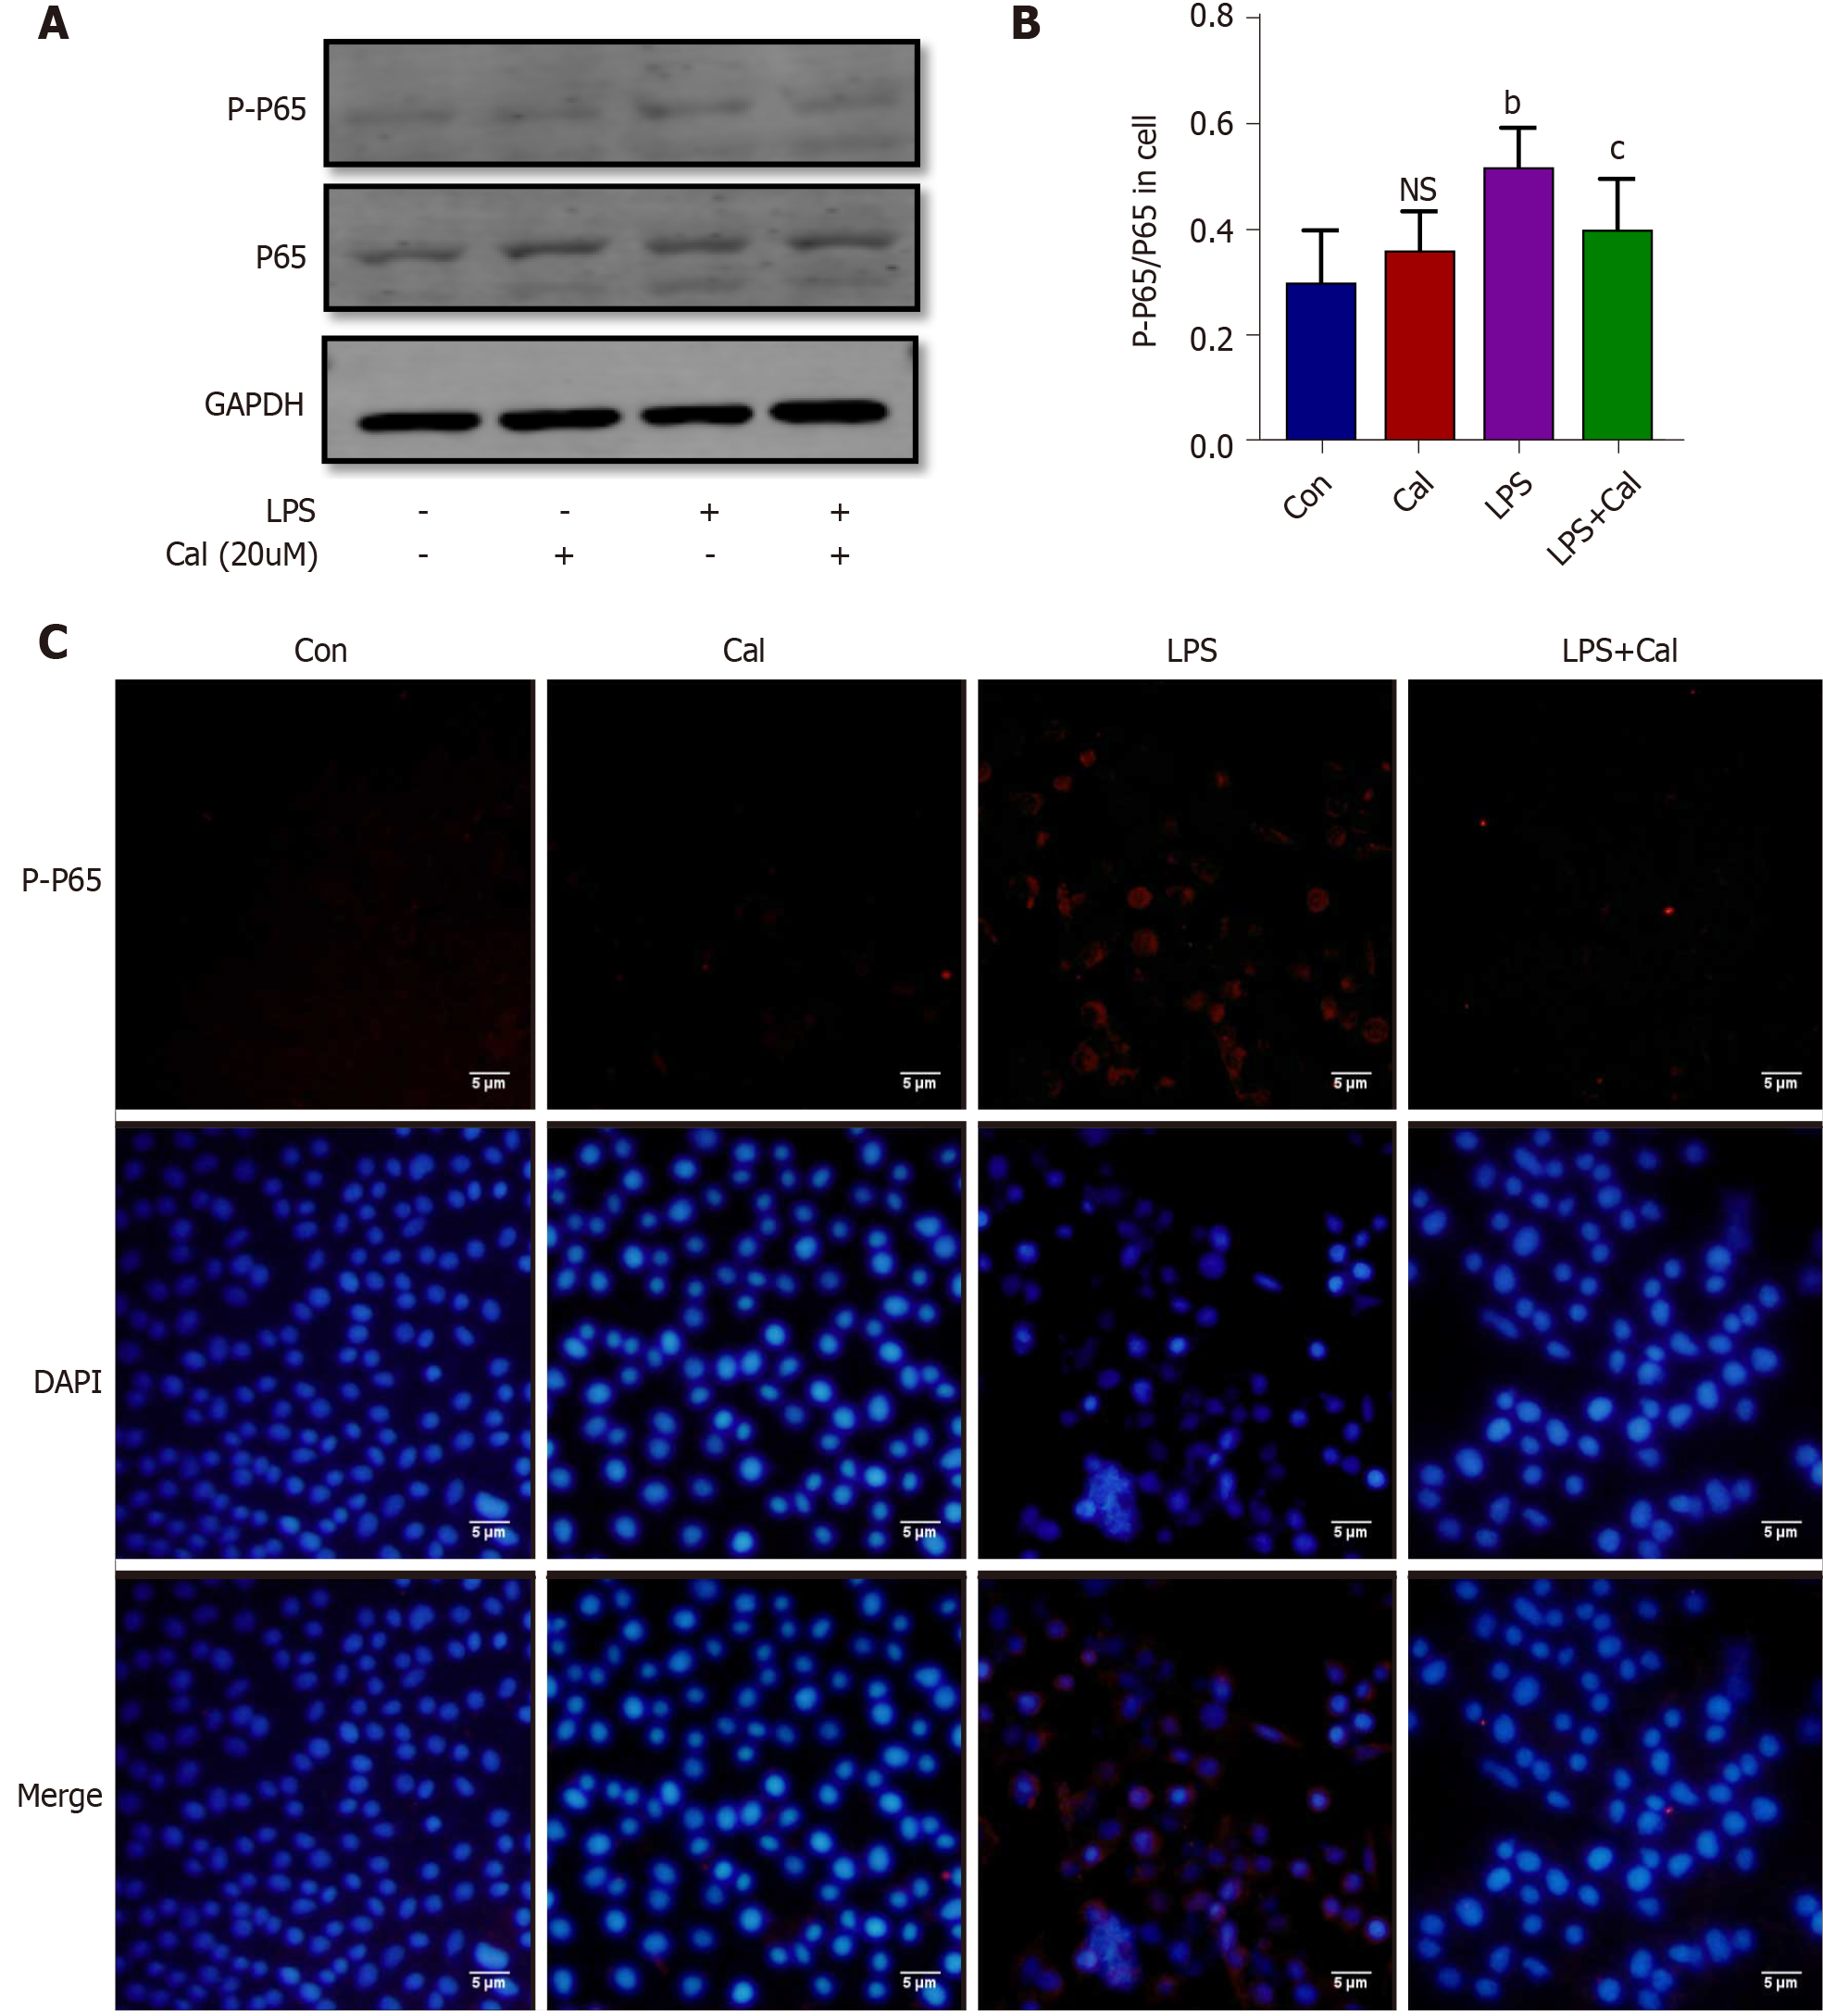
Figure 9 Effects of calycosin on the expression of phosphorylated nuclear factor-kappa B-p65 expression in the in vitro model of LPS-induced ALI using A549 cells.
A: Western blot detection of phosphorylated nuclear factor-kappa B-p65 (NF-κB-p65) expression in A549 cells; B: Quantitative analysis of phosphorylated NF-κB-p65 in A549 cells; C: Immunofluorescence staining of phosphorylated NF-κB-p65 in A549 cells. Data represent mean ± SD values; bP < 0.01 vs Con group; cP < 0.05 vs LPS group. Ns: No significance vs Con group. p-p65: Phosphorylated nuclear factor-kappa B-p65; Con: Control group; Cal: Calycosin group; LPS: Lipopolysaccharide group.
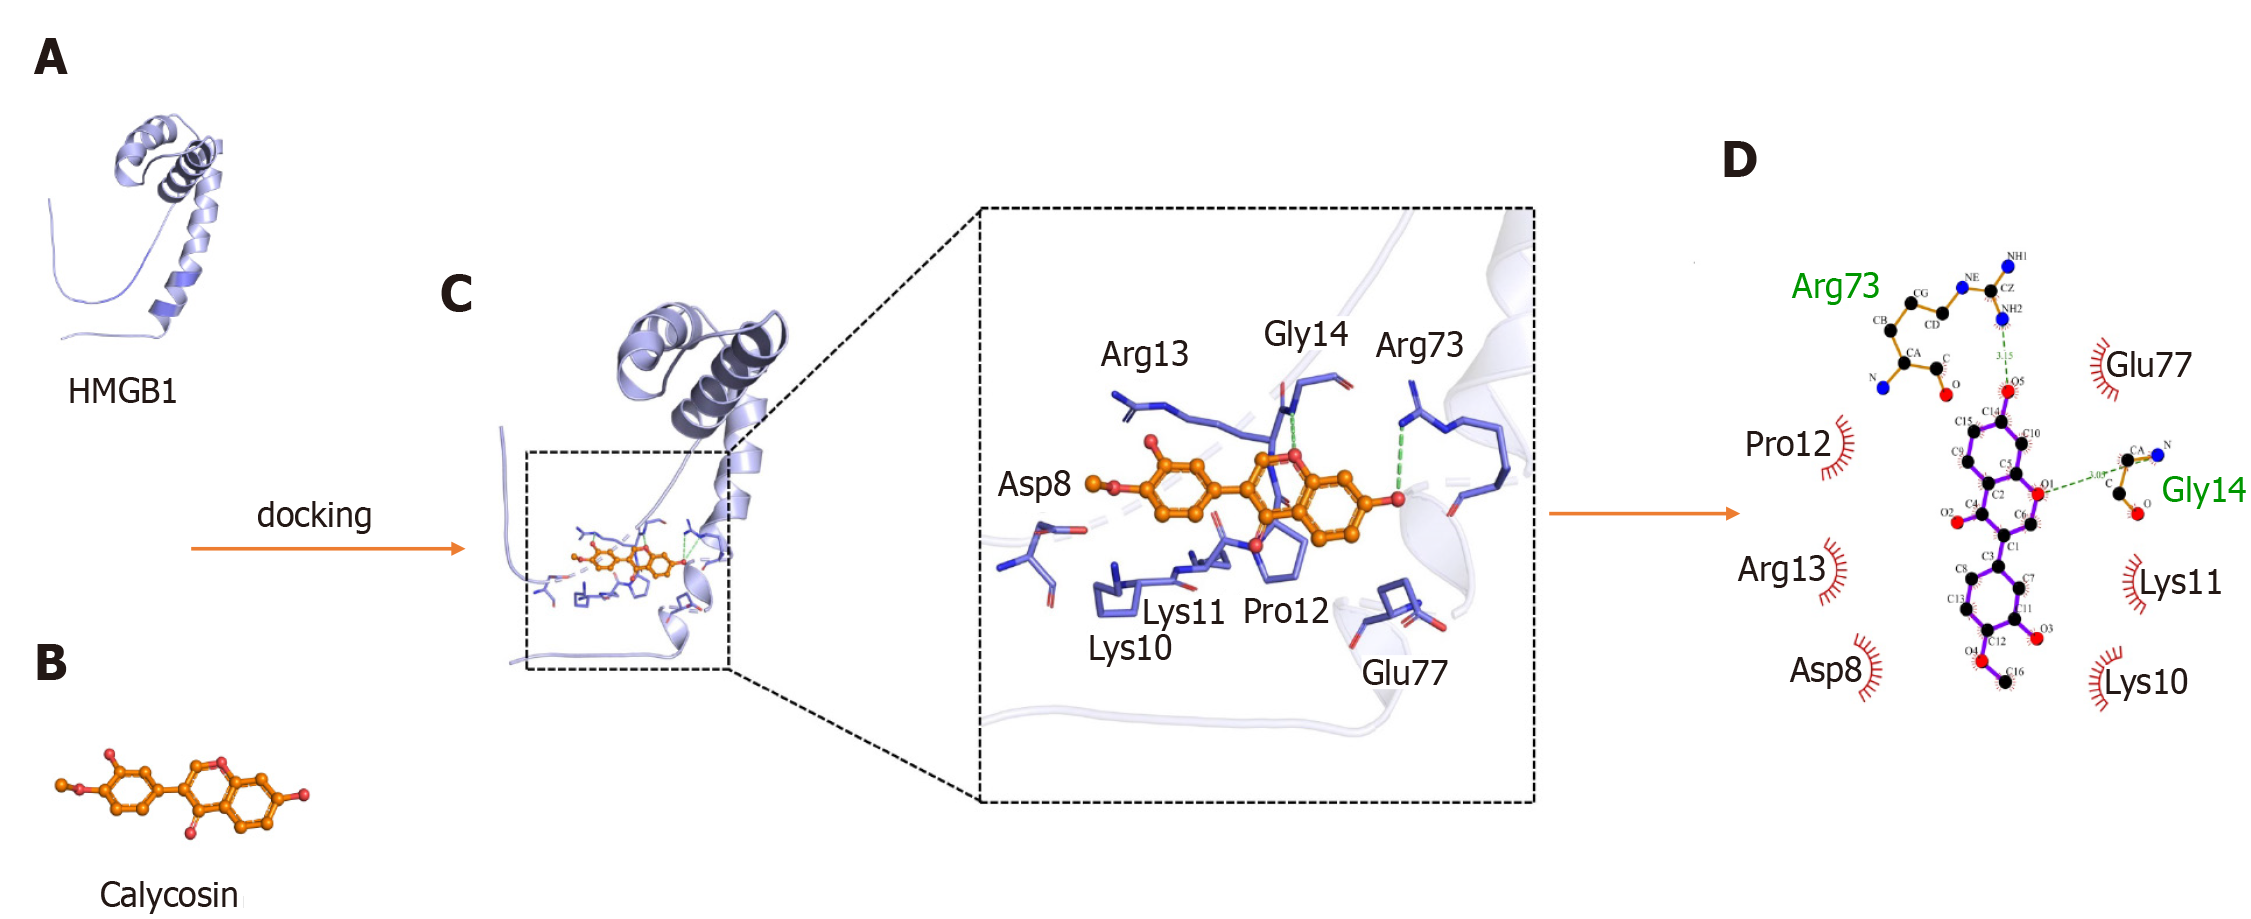
Figure 10 Theoretical binding mode of calycosin and high mobility group box 1 A-box.
A: The 3D structure of high mobility group box 1 (HMGB1) A-box; B: The 3D structure of calycosin (Cal); C: 3D docking mode between Cal and HMGB1 A-box simulated by Discovery Studio and the amino acid of the active site; D: Two-dimensional schematic interaction diagram between Cal and HMGB1 A-box, the color of the amino acid residue is drawn by interaction. HMGB1: High mobility group box 1; Cal: Calycosin.
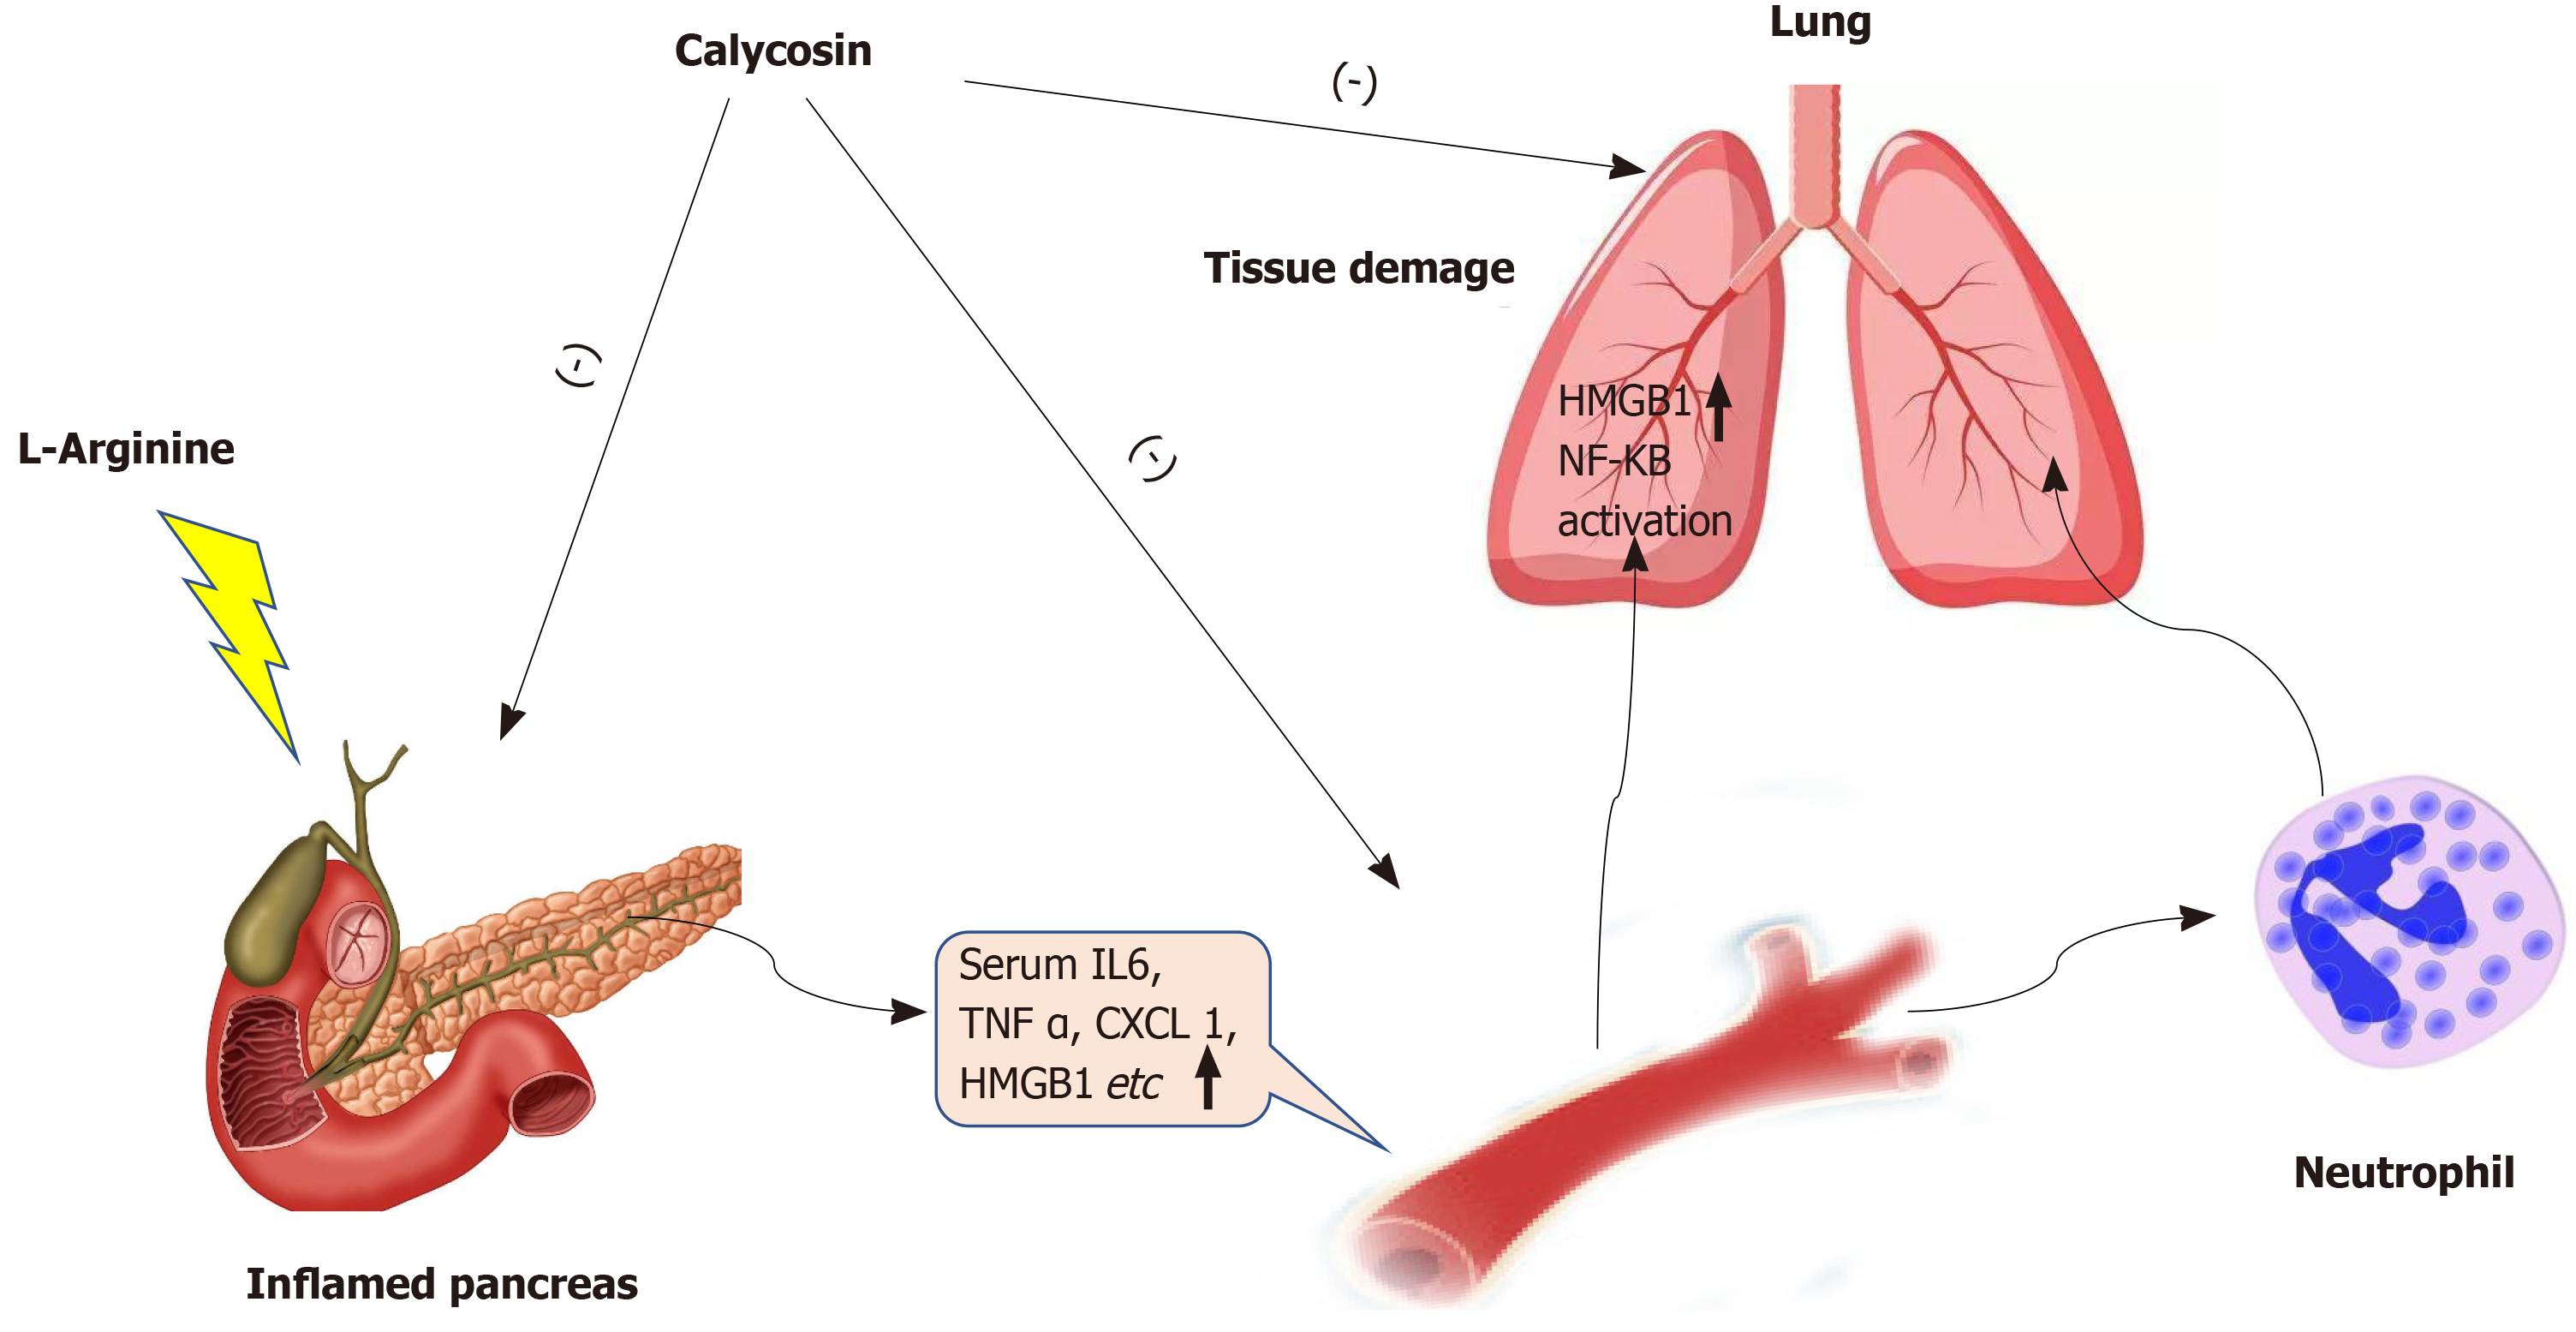
Figure 11 Calycosin attenuates acute lung injury in L-arginine induced severe acute pancreatitis by curtailing high mobility group box 1-induced inflammation.
- Citation: Zhu CJ, Yang WG, Li DJ, Song YD, Chen SY, Wang QF, Liu YN, Zhang Y, Cheng B, Wu ZW, Cui ZC. Calycosin attenuates severe acute pancreatitis-associated acute lung injury by curtailing high mobility group box 1 - induced inflammation. World J Gastroenterol 2021; 27(44): 7669-7686
- URL: https://www.wjgnet.com/1007-9327/full/v27/i44/7669.htm
- DOI: https://dx.doi.org/10.3748/wjg.v27.i44.7669


