Copyright
©The Author(s) 2021.
World J Gastroenterol. Nov 14, 2021; 27(42): 7324-7339
Published online Nov 14, 2021. doi: 10.3748/wjg.v27.i42.7324
Published online Nov 14, 2021. doi: 10.3748/wjg.v27.i42.7324
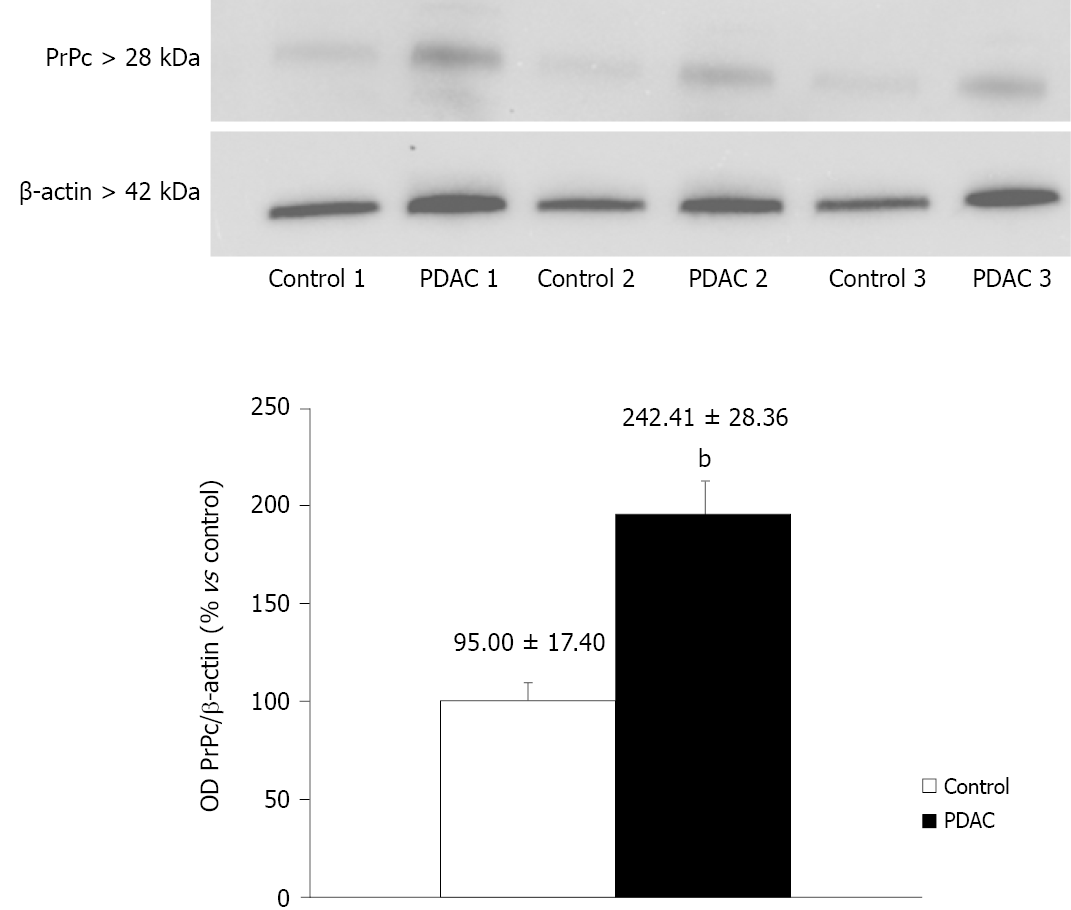
Figure 1 Immuno-blots for prion protein and the house keeping protein b-actin in control tissues and pancreatic ductal adenocarcinoma tissues.
bP < 0.0001. Comparisons between two groups were made by using Student t-test. Values are given as the mean ± SD.
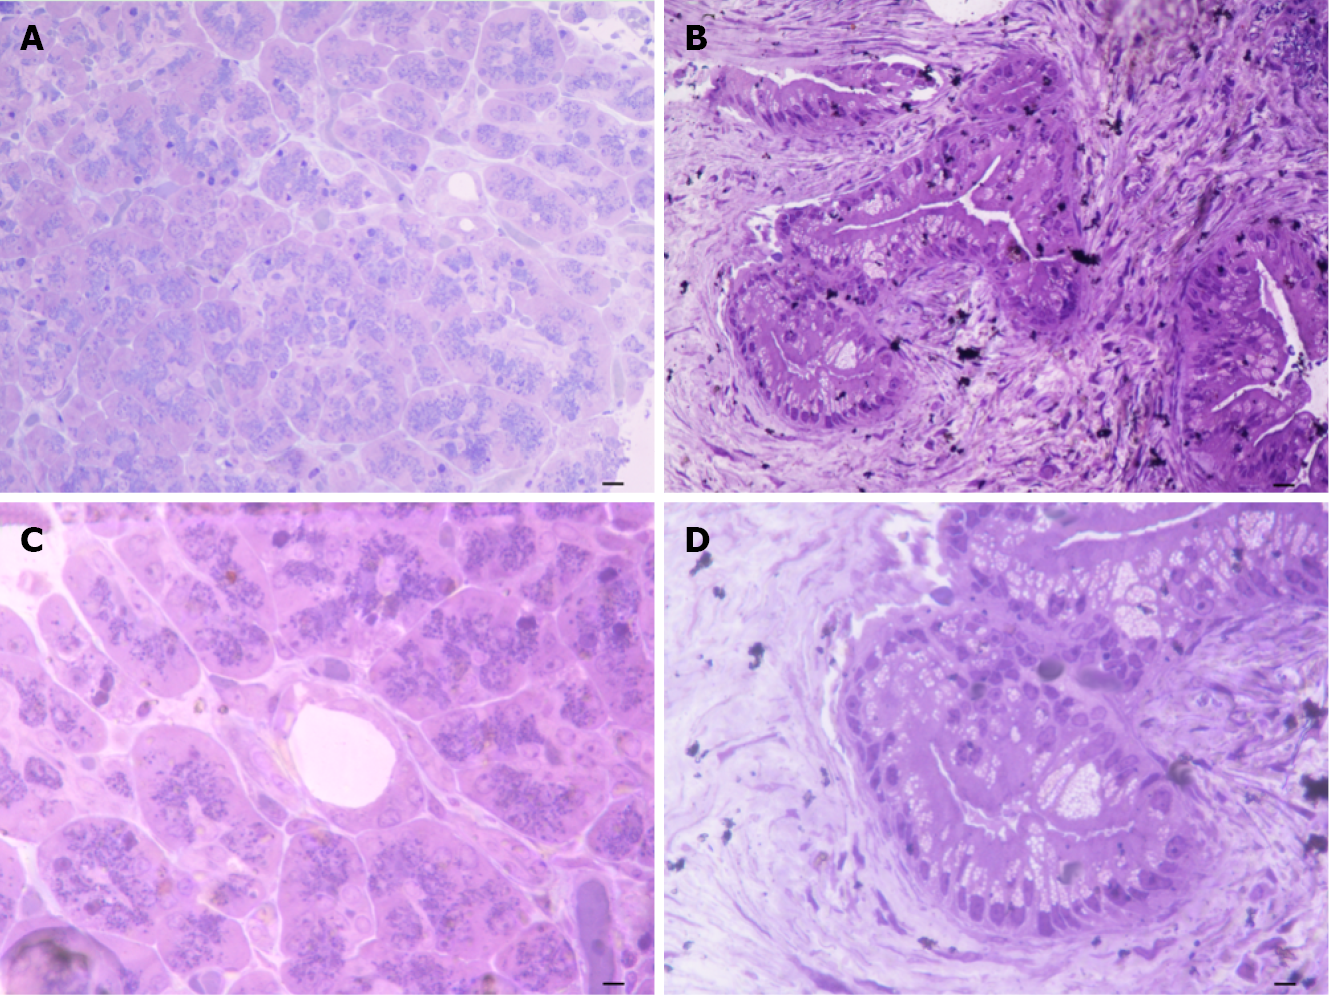
Figure 2 Semi-thin sections of control and pancreatic ductal adenocarcinoma pancreas.
A: Pancreas from control tissue at low magnification (magnification: 20 ×, scale bar: 12.5 μm). The ductal areas are evident as empty roundish areas surrounded by cell staining as much as those in the neighboring parenchyma; B: The normal pancreatic tissue characteristics are more evident at higher magnification, where there is a pale toluidine staining of ductal cells (magnification: 40 ×, scale bar: 6.25 μm); C: In pancreatic ductal adenocarcinoma (PDAC) tissue a highly non-homogeneous tissue is present and ductal regions are markedly stained (magnification: 20 ×, scale bar: 12.5 μm); D: PDAC tissue at higher magnification (magnification: 40 ×, scale bar: 6.25 μm). The ductal cells are overwhelmed and they tend to occlude the ductal lumen.
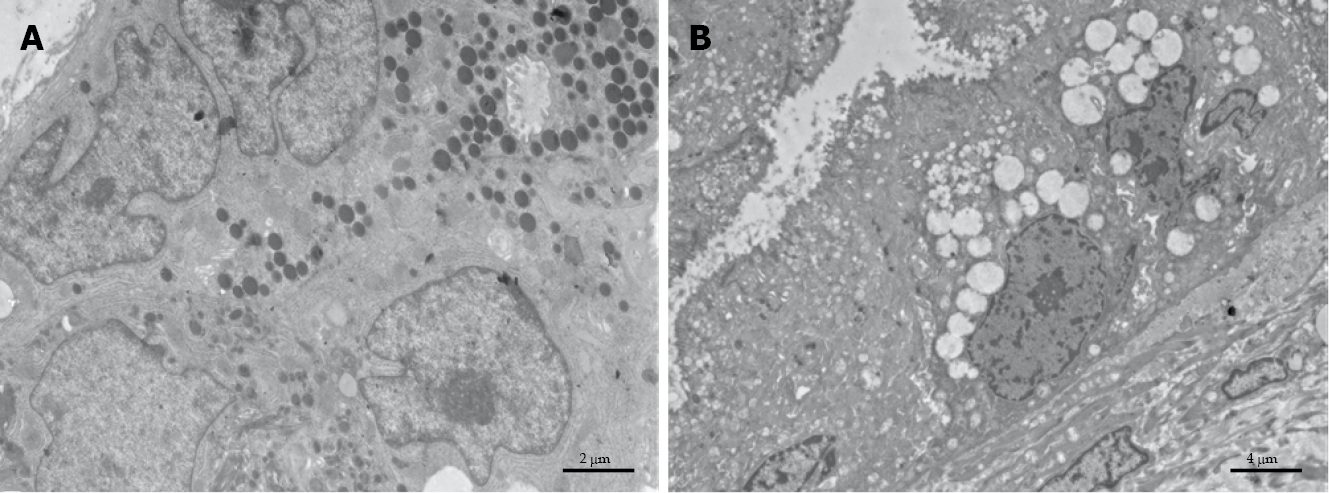
Figure 3 Ultrastructural organization.
A: Pancreatic normal tissue. In pancreatic healthy tissue the cells surrounding ductal systems are well preserved. The cellular organelles, nuclei and secretory zymogen granules have normal architecture (magnification: 2000 ×, scale bar: 2 μm); B: Pancreatic normal tissue. The cells surrounding duct have increasing loss of cellular architecture (magnification: 1000 ×, scale bar: 4 μm).
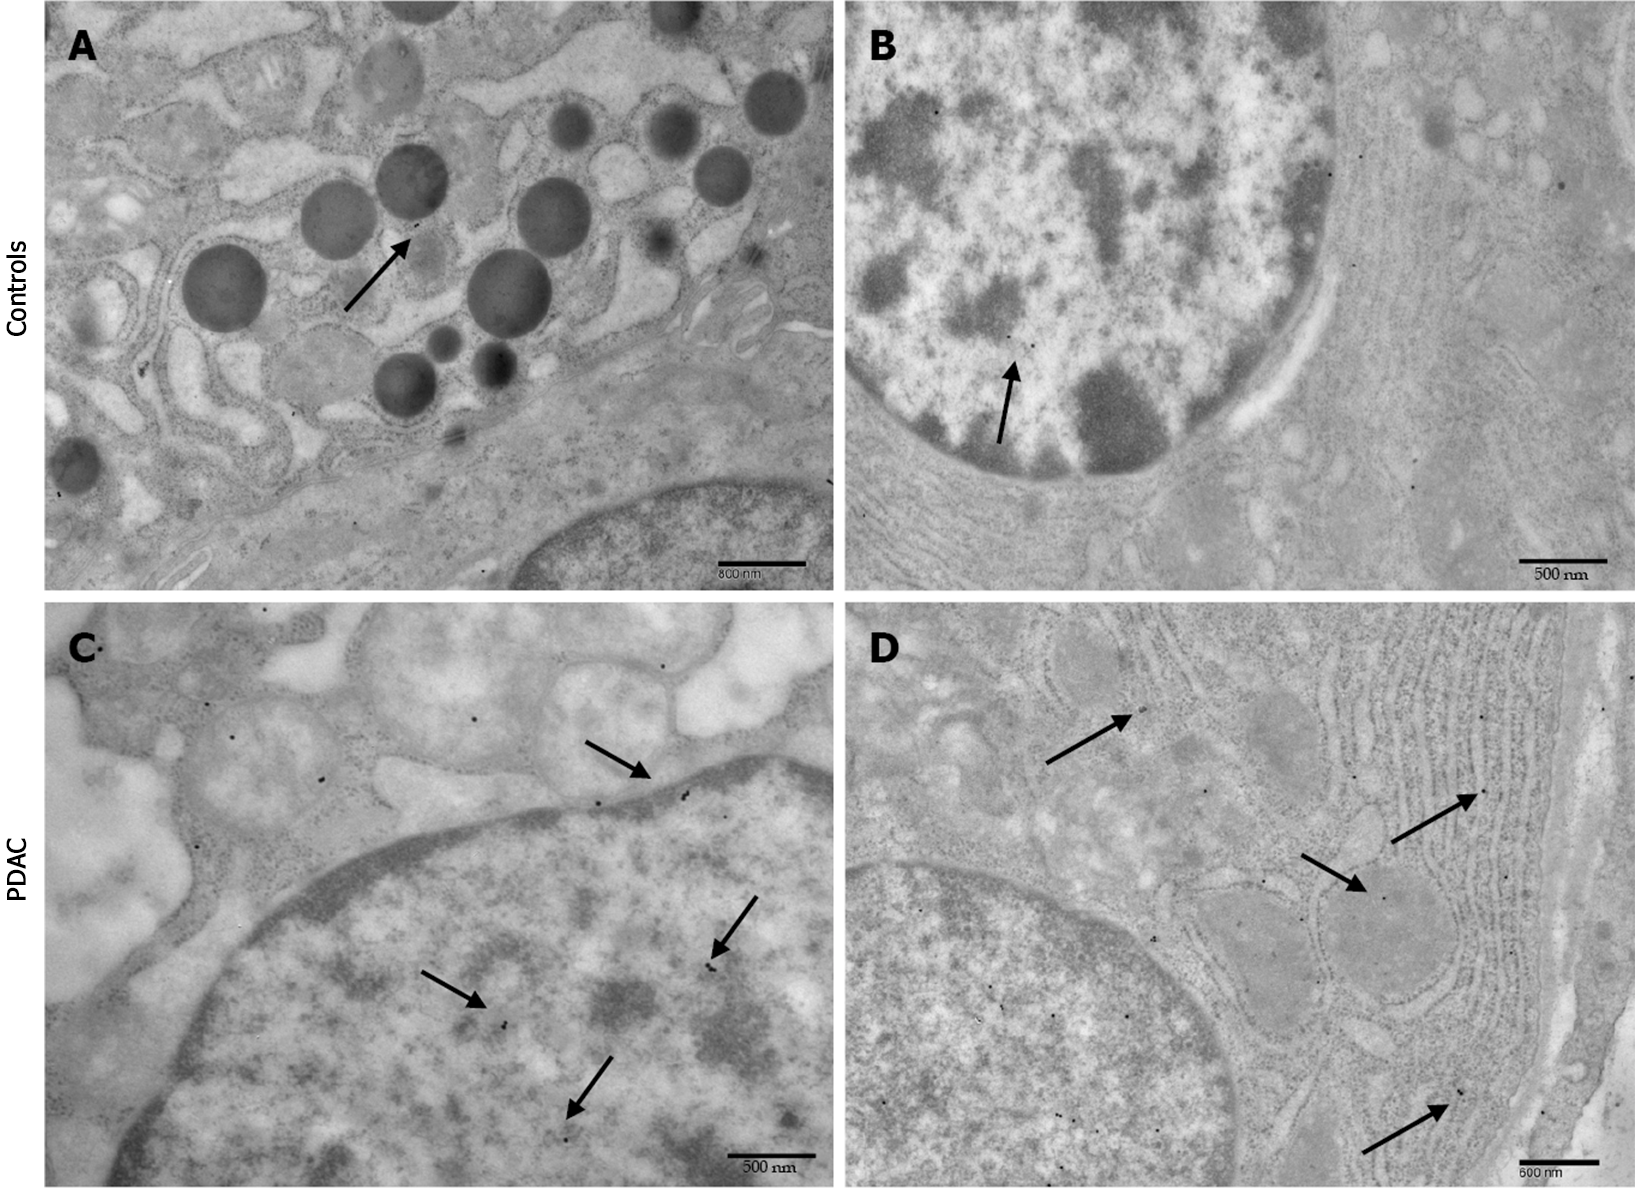
Figure 4 Prion protein immunocytochemistry in controls and pancreatic ductal adenocarcinoma.
A: Prion protein immunocytochemistry in controls. Few particles of gold prion protein (PrPc) are evident (arrows) in the cytosol (magnification: 6000 ×, scale bar: 800 nm); B: Few particles of gold PrPc are evident (arrows) in the nucleus (magnification: 8000 ×, scale bar: 500 nm); C: Prion protein immunocytochemistry in pancreatic ductal adenocarcinoma. The arrows highlight some of the PrPc immuno-gold particles in the nucleus (magnification: 8000 ×, scale bar: 500 nm); D: The arrows highlight some of the PrPc immuno-gold particles in the cytosol (magnification: 7000 ×, scale bar: 600 nm).
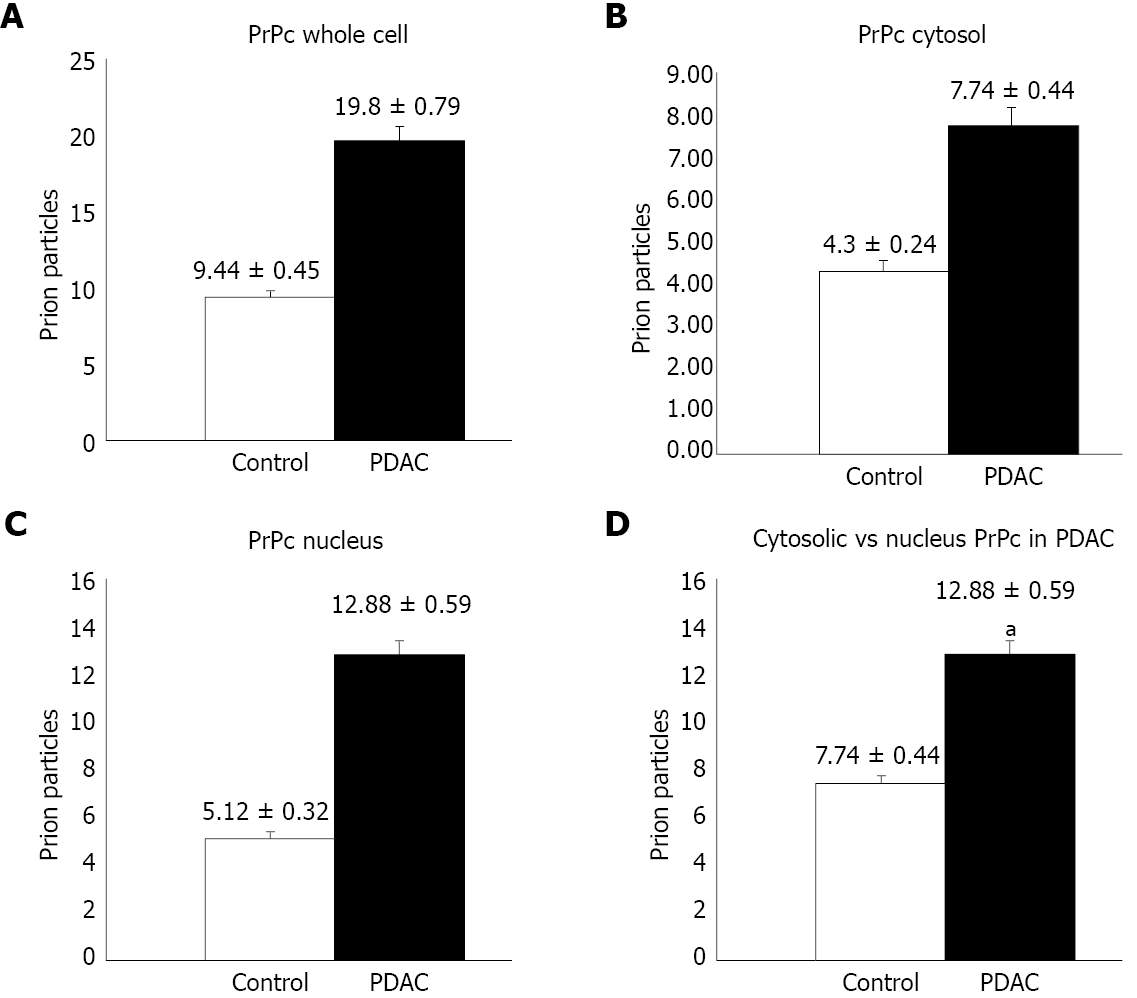
Figure 5 Prion protein immuno-gold particles count.
A: Prion protein immuno-gold particles count in whole cells (controls vs pancreatic ductal adenocarcinoma); B: Prion protein immuno-gold particles count in cytosol (controls vs pancreatic ductal adenocarcinoma); C and D: Prion protein immuno-gold particles count in nuclear compartment. A significative difference in prion protein (PrPc) immunogold particles is observed between pancreatic ductal adenocarcinoma (PDAC) and control tissues (C); Even when analyzing the location only in PDAC cells, the nuclear compartment has a significantly higher PrPc concentration (D). aP < 0.0001. Comparisons between two groups were made by using Student t-test. Values are given as the mean ± SD.
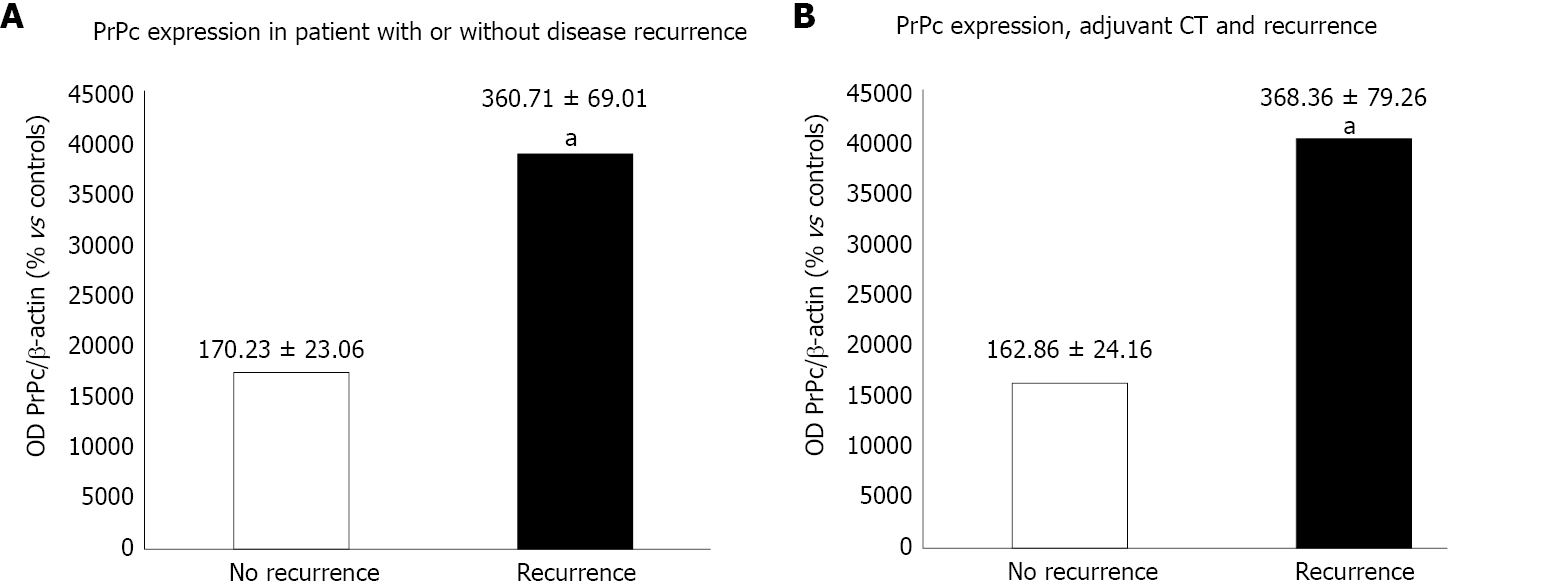
Figure 6 Prion protein expression.
Comparisons between two groups were made by using Student t-test. Values are given as the mean ± SD. A: Prion protein expression according to the presence of disease recurrence after surgery. The histogram compares the expression of prion protein with western blot in specimen from patients surgically resected for pancreatic ductal adenocarcinoma with no evidence of disease at 12-mo follow-up (n = 11) with those from patients with disease recurrence (n = 13). aP = 0.023. B: Prion protein expression according to the presence of disease recurrence after surgery in patients treated with adjuvant chemotherapy. The histogram compares the expression of prion protein with western blot in specimen from patients surgically resected for pancreatic ductal adenocarcinoma with no evidence of disease at 12 mo and treated with adjuvant chemotherapy (CT) (n = 10) with those from patients treated with adjuvant CT with disease recurrence (n = 11). aP = 0.028.
- Citation: Bianchini M, Giambelluca MA, Scavuzzo MC, Di Franco G, Guadagni S, Palmeri M, Furbetta N, Gianardi D, Funel N, Ricci C, Gaeta R, Pollina LE, Falcone A, Vivaldi C, Di Candio G, Biagioni F, Busceti CL, Morelli L, Fornai F. Detailing the ultrastructure’s increase of prion protein in pancreatic adenocarcinoma. World J Gastroenterol 2021; 27(42): 7324-7339
- URL: https://www.wjgnet.com/1007-9327/full/v27/i42/7324.htm
- DOI: https://dx.doi.org/10.3748/wjg.v27.i42.7324


