Copyright
©The Author(s) 2021.
World J Gastroenterol. Jan 28, 2021; 27(4): 305-320
Published online Jan 28, 2021. doi: 10.3748/wjg.v27.i4.305
Published online Jan 28, 2021. doi: 10.3748/wjg.v27.i4.305
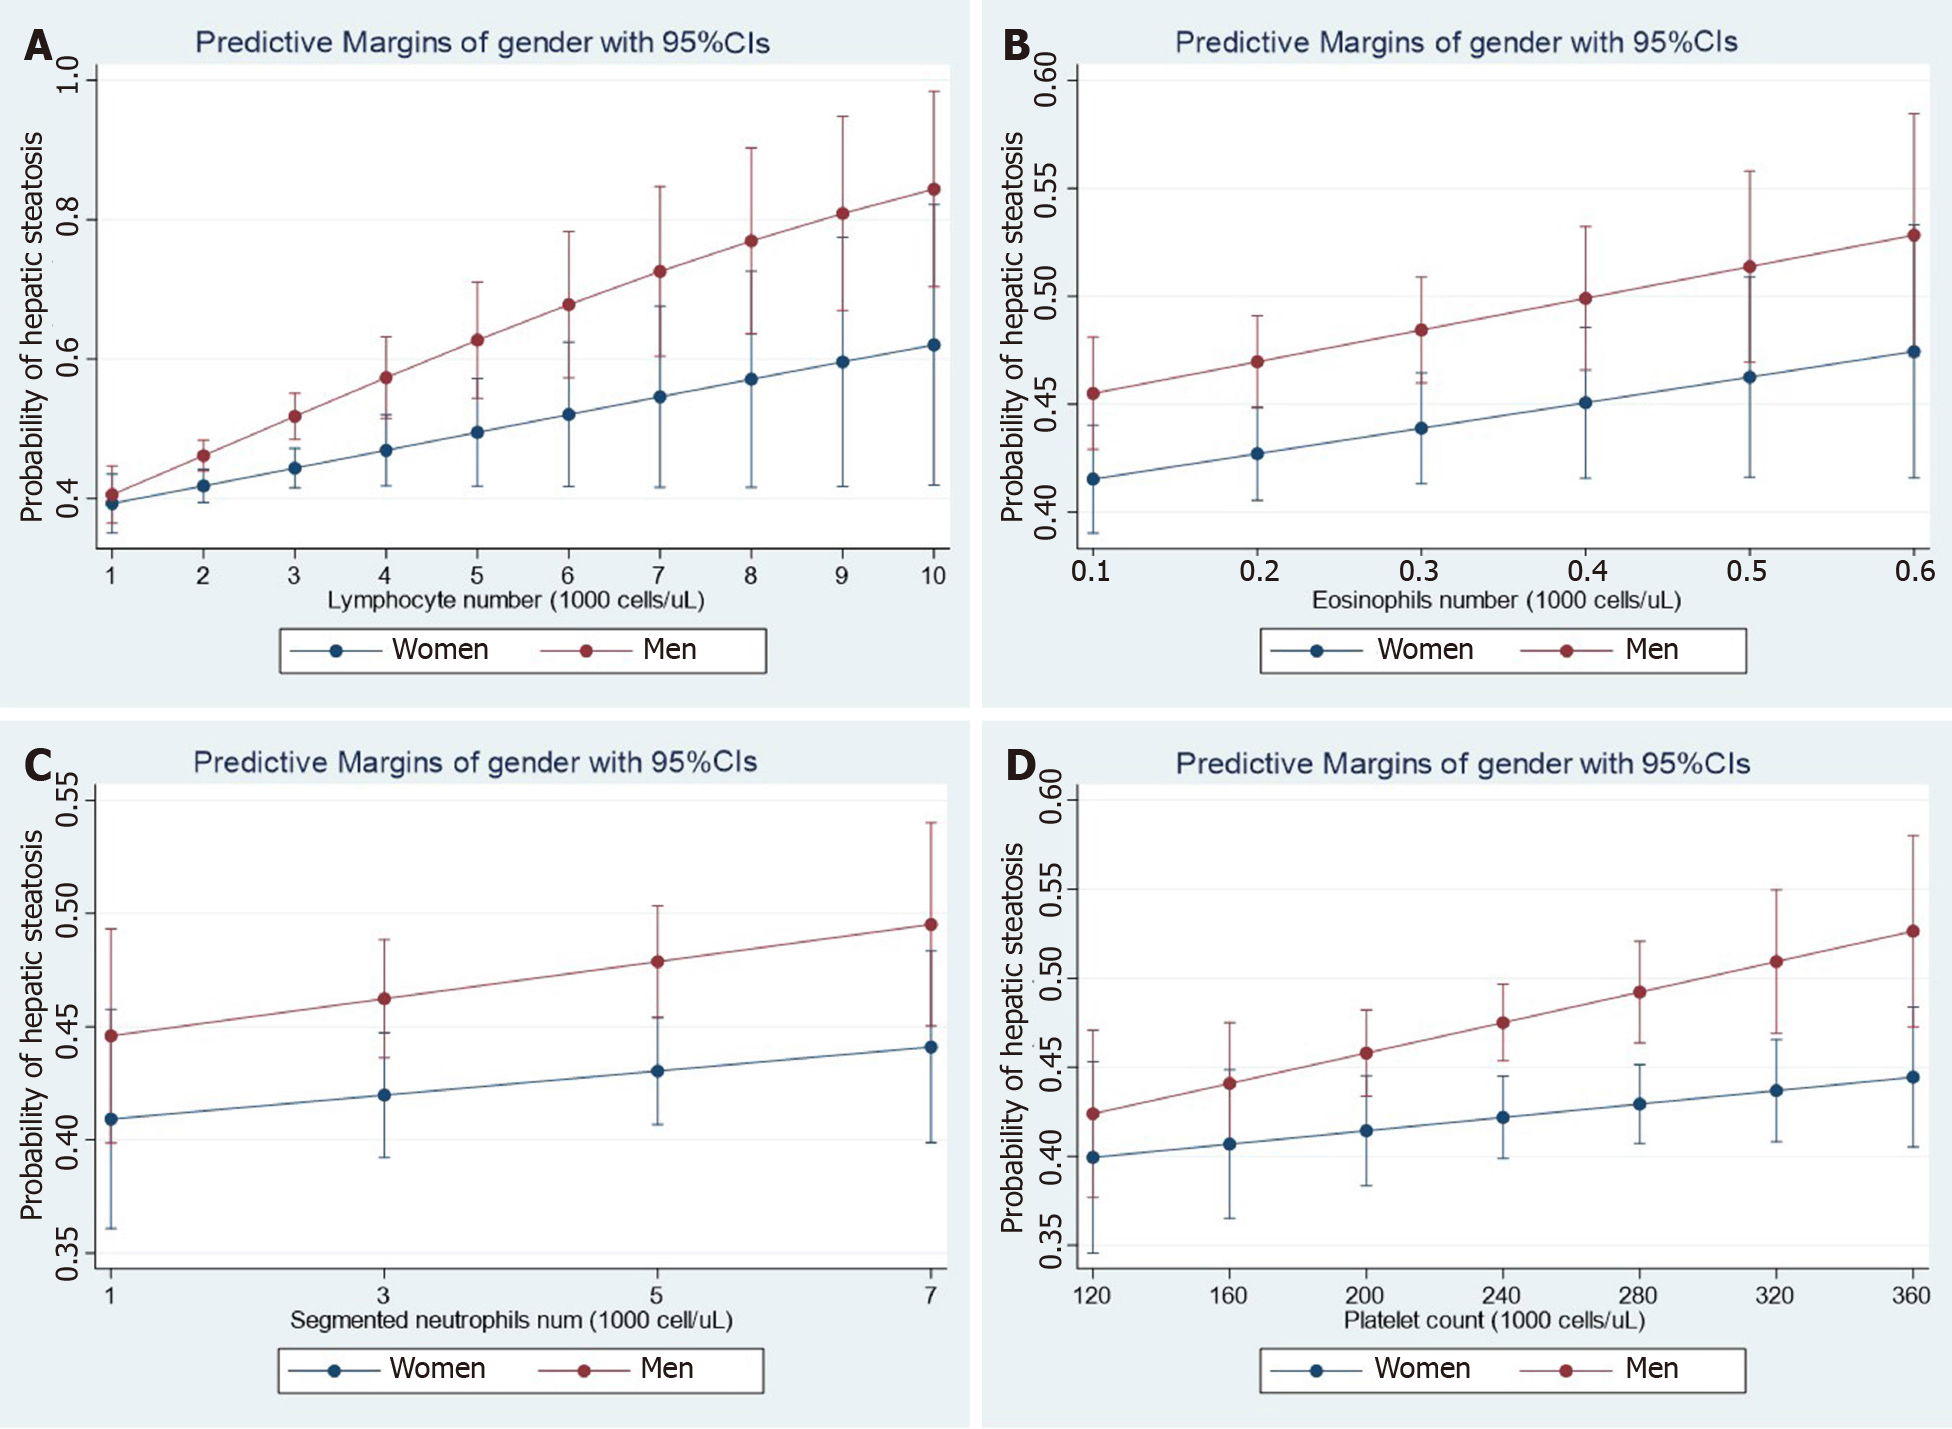
Figure 1 Steatosis and hematological traits.
Panels show the interaction effects between hepatic steatosis and hematological traits (A: Lymphocyte number; B: Eosinophil number; C: Neutrophil number; D: Platelet number) on the probability of having hepatic steatosis according to gender. Interaction analyses were performed by linear logistic regression for the presence of steatosis (no = 0, yes = 1) as the dependent variable adding an interaction term among gender (women = 0, men = 1) and the specific continuous variable. Diabetes and log-transformed age, waist, HgbA1c, total cholesterol, systolic blood pressure, and triglycerides were also included as cofactors. The probability of liver fibrosis was estimated by margins as implemented in the STATA software. Data analysis was based on National Health and Nutrition Examination Surveys 2017-2018; the National Center for Health Statistics Research Ethics Review Board approved the National Health and Nutrition Examination Surveys protocol, and participants gave informed consent. Datasets and further information are available online (https://www.cdc.gov/nchs/nhanes/index.htm). Liver steatosis was defined by the controlled attenuation parameter[12]. Only participants that consumed less than 30 g and 20 g of alcohol for men and women, respectively, were included in the present analysis. Those participants with positive tests for viral hepatitis were excluded.
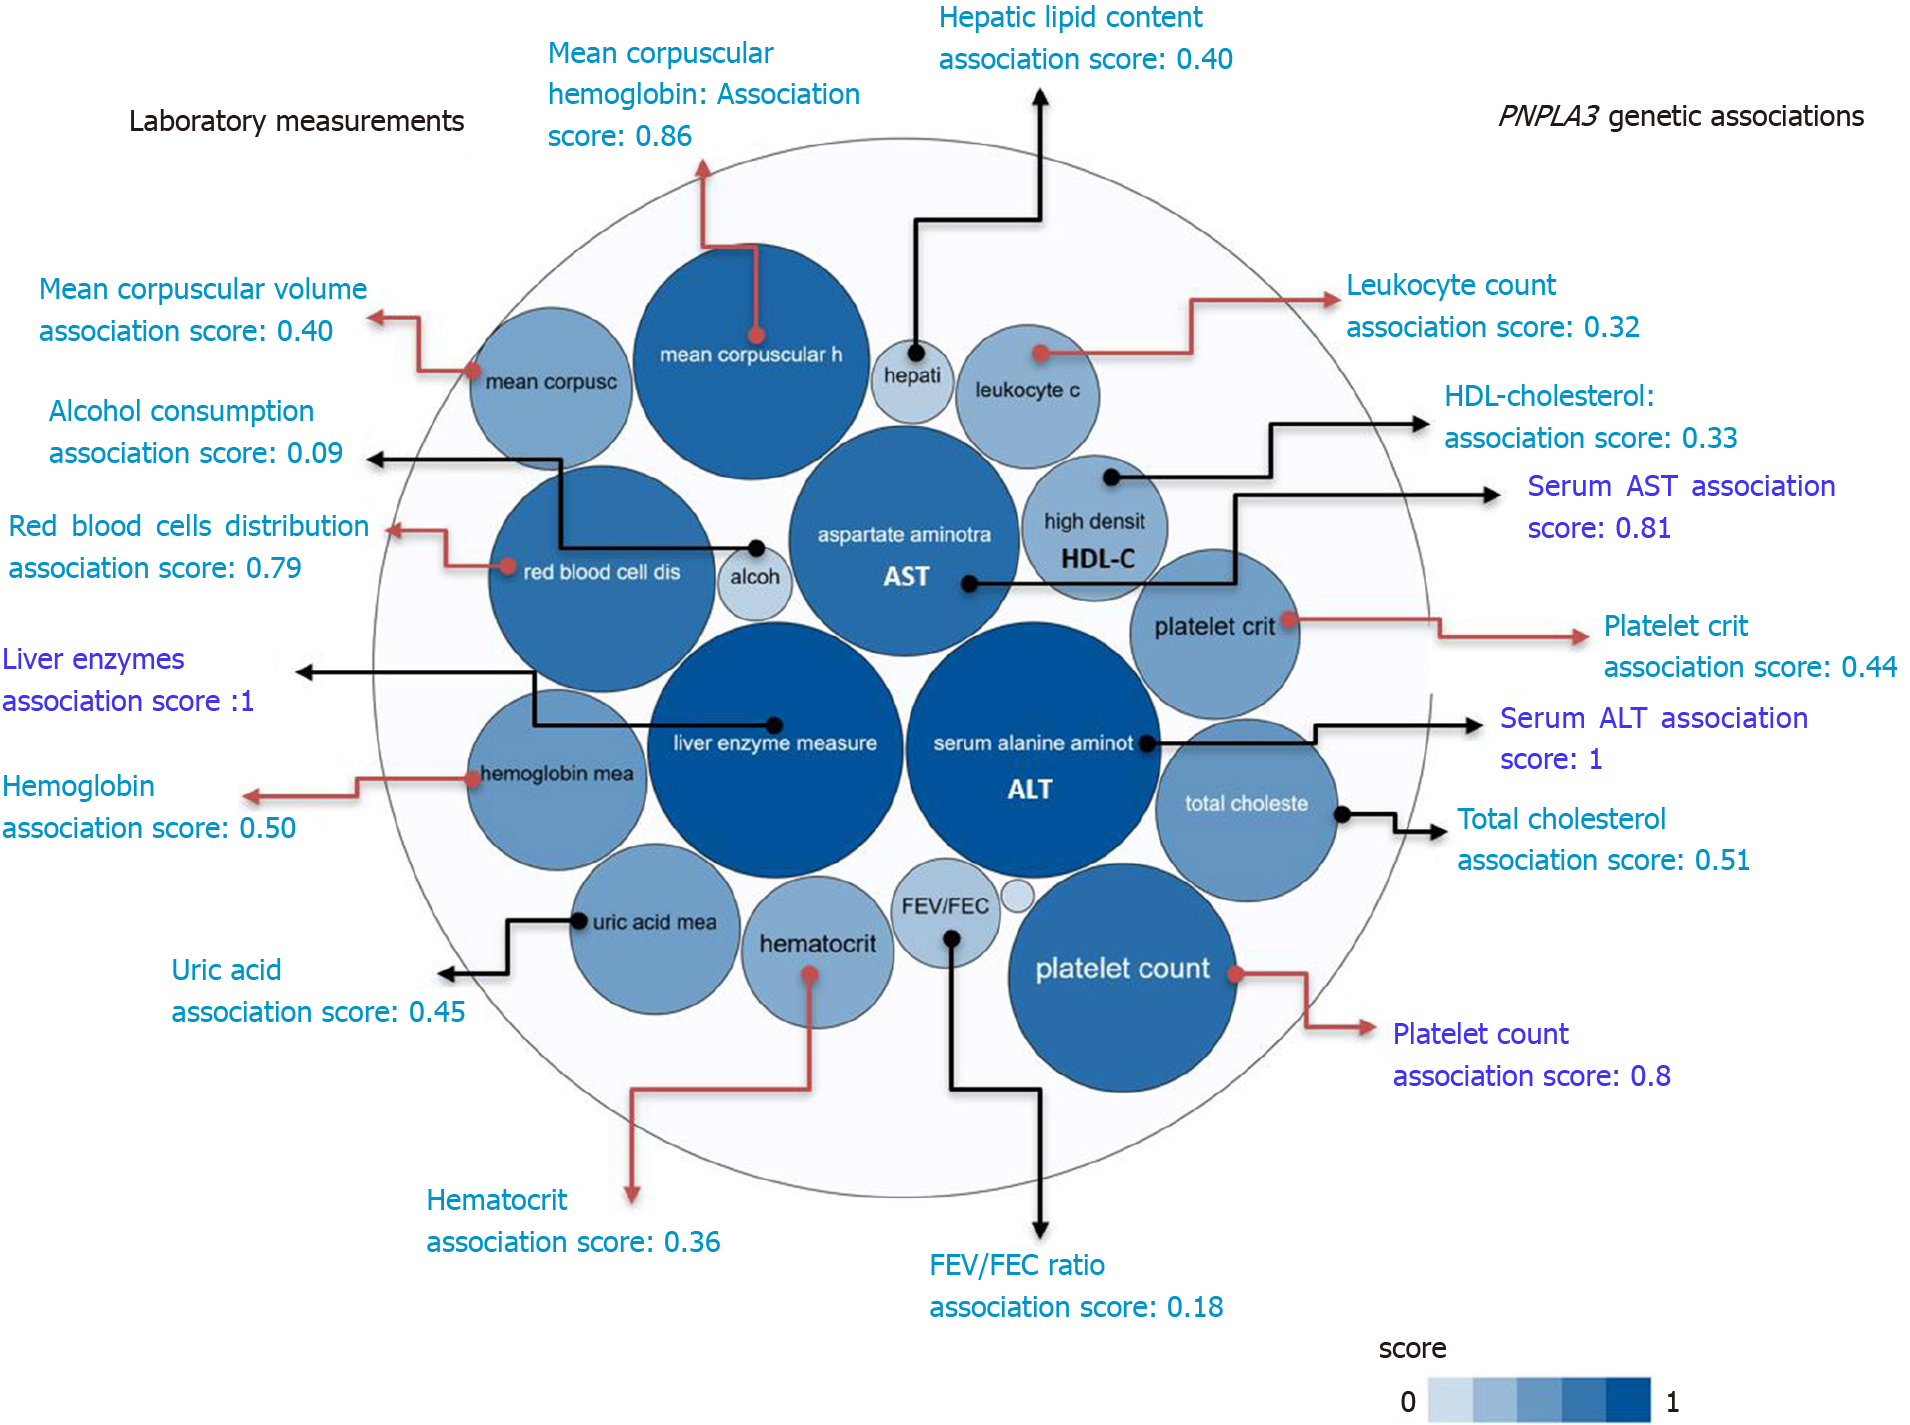
Figure 2 PNPLA3 and genetic associations with laboratory measurements in genome-wide association studies and phenome-wide association studies.
The score for the associations ranges from 0 to 1, with higher scores indicating stronger evidence for an association. Bubbles in the figure represent the different scores with varying shades of blue: the darker the blue, the stronger the association. Red arrows highlight the association of the rs738409 variant in PNPLA3 and laboratory measurements related with hematological traits. HDL: High density lipoprotein cholesterol; FEV: The ratio of forced expiratory volume to forced vital capacity, used as a measure of pulmonary function; uric: Uric acid; AST: Aspartate aminotransferase level; ALT: Alanine aminotransferase level; total chol: Total cholesterol. Source: Open Target Database (https://genetics.opentargets.org/gene/ENSG00000100344). Score summaries: Data sources and factors that affect the relative strength of the evidence scores can be found at: https://docs.targetvalidation.org/getting-started/scoring.
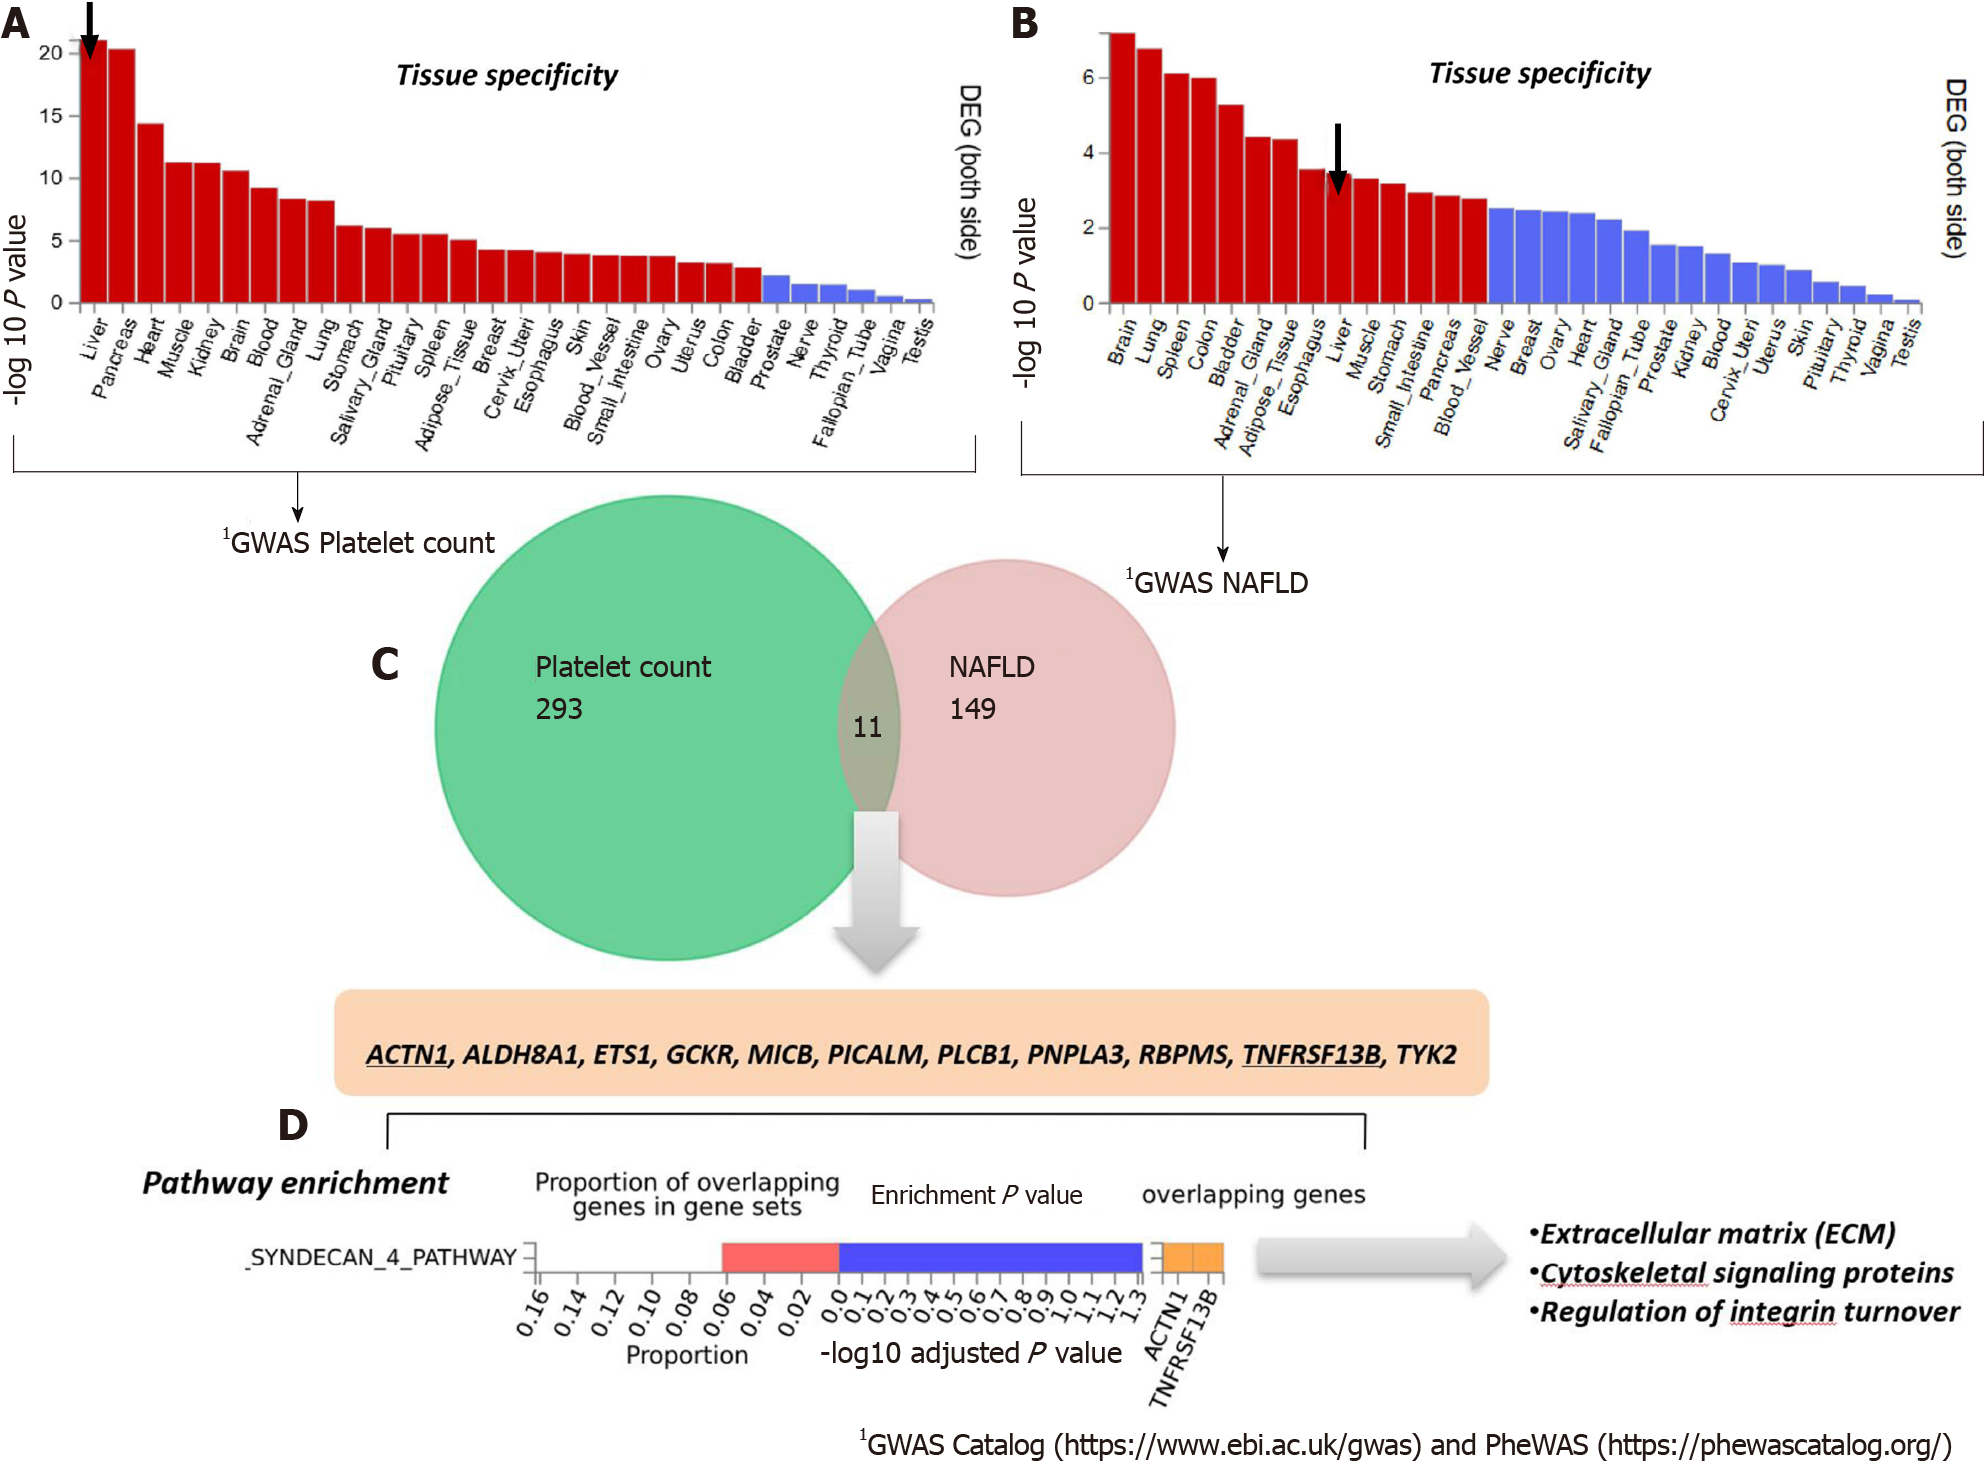
Figure 3 Genes that are shared between nonalcoholic fatty liver disease and platelet count.
A and B: Significantly enriched Differentially Expressed Gene (DEG) Sets (Pbon < 0.05) are highlighted in red (FUMA). DEG sets were pre-calculated by performing two-sided t-test for any one of the labels against all others. For this purpose, expression values were normalized (zero-mean) to obtain a log2 transformation of expression value (EPKM or TPM). Genes with P ≤ 0.05 after Bonferroni correction and absolute log fold change ≥ 0.58 were defined as differentially expressed genes in a given label compared to others. In addition to DEG, up-regulated DEG and down-regulated DEG were also pre-calculated by taking the sign of t-statistics into account. Input genes were tested against each of the DEG sets using the hypergeometric test. The background genes are genes that have average expression value > 1 in at least one of the labels and exist in the user-selected background genes. Significant enrichment at Bonferroni-corrected P ≤ 0.05 is colored in red. C: Venn diagram showing the number of genes that are common (overlapping areas) and dissimilar (non-overlapping areas) in nonalcoholic fatty liver disease (NAFLD) and platelet count gene lists. D: Pathway analysis using all Canonical Pathways (MsigDB c2) in the web-based FUMA platform available at http://fuma.ctglab.nl. Overlapping genes (underlined): ACTN1: Actinin Alpha 1; TNFRSF13B: TNF Receptor Superfamily Member 13B. The input lists of platelet count- and NAFLD-associated variants were generated by searching the Open Target platform, which contains data retrieved from GWAS Catalog (https://www.ebi.ac.uk/gwas) and phenome-wide association studies (https://phewascatalog.org/). The list of genes associated with platelet count contains 305 loci and that associated with NAFLD contains 149 loci, as shown in Supplementary Figures 1 and 2, respectively.
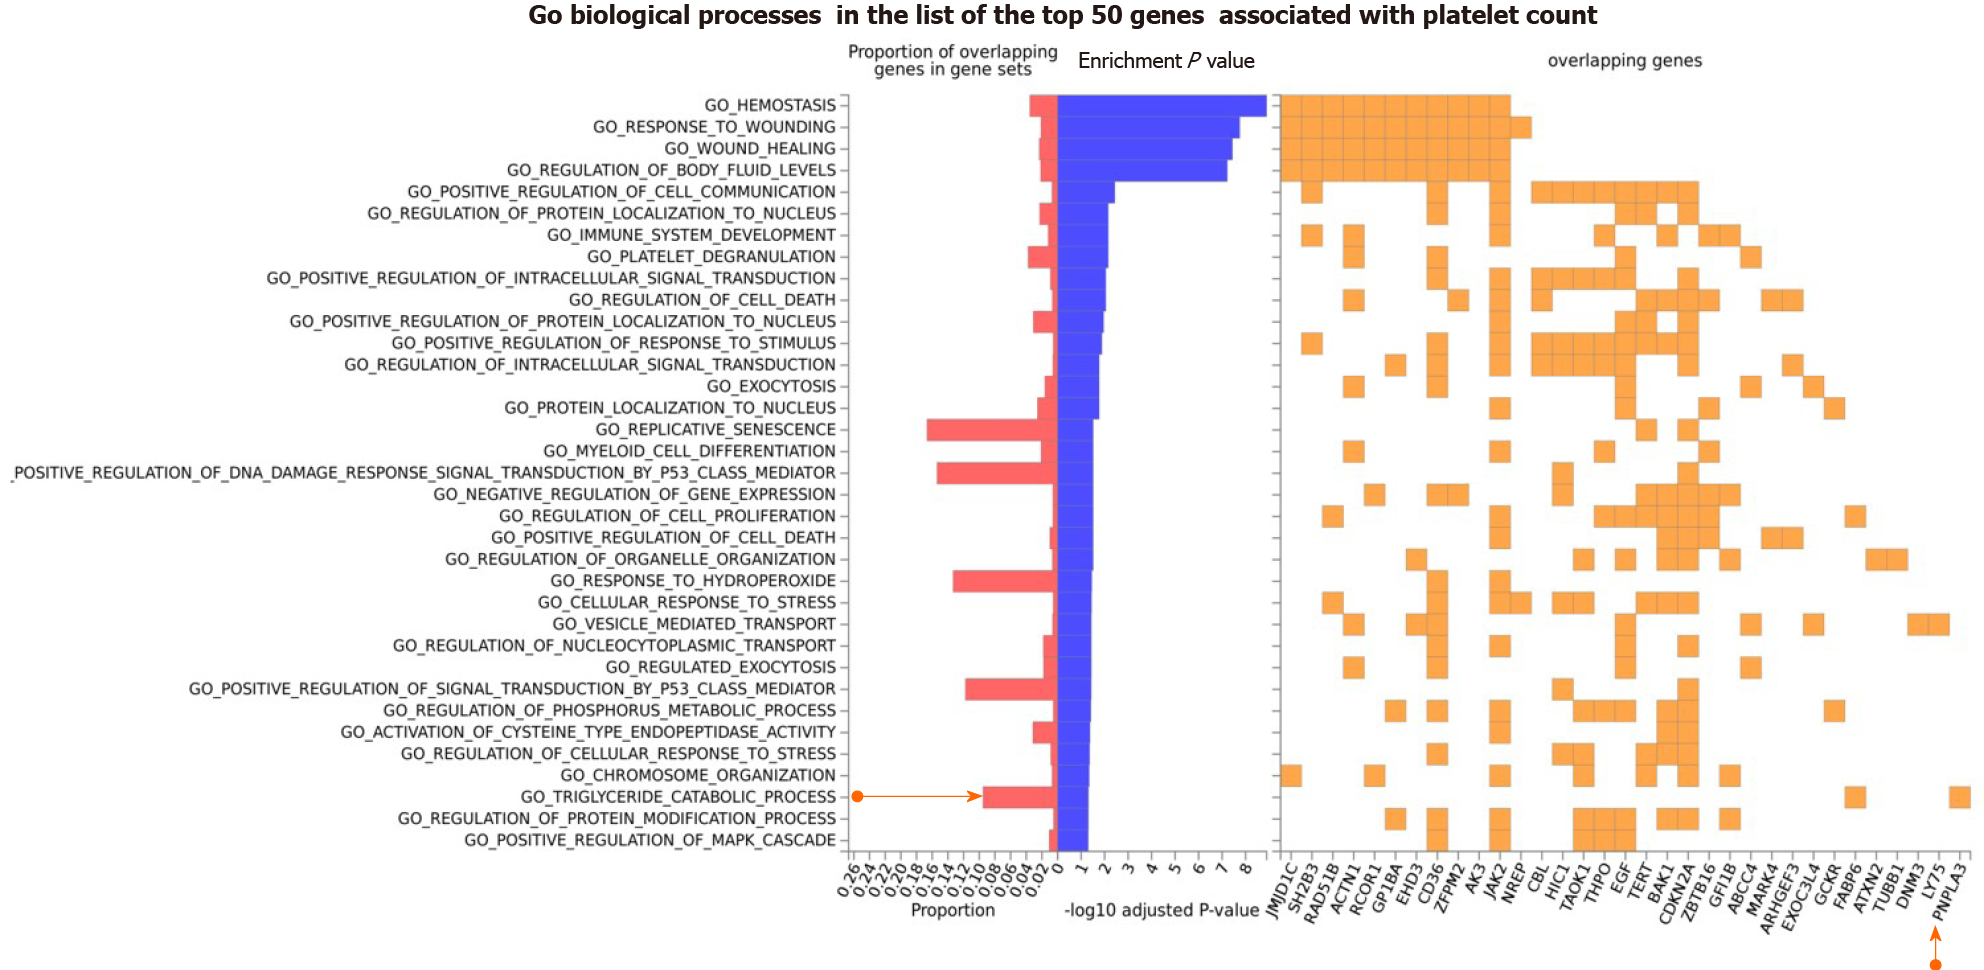
Figure 4 Gene Ontology biological processes of the top 50 genes associated with platelet count.
The chart shows fold enrichment in biological processes of genes associated with platelet count with respect to those present in the whole genome. The input list of platelet count-associated variants was generated by conducting a search via the Open Target platform, which contains data retrieved from genome-wide association studies Catalog (https://www.ebi.ac.uk/gwas) and phenome-wide association studies (https://phewascatalog.org/). The whole list of genes associated with platelet count contains 305 loci, as shown in Supplementary Figure 2. Gene mapping and analysis was conducted using the FUMA genome-wide association studies tool (https://fuma.ctglab.nl/). Genes belonging to the pathways as overlapping genes are shown as a heatplot to the right.
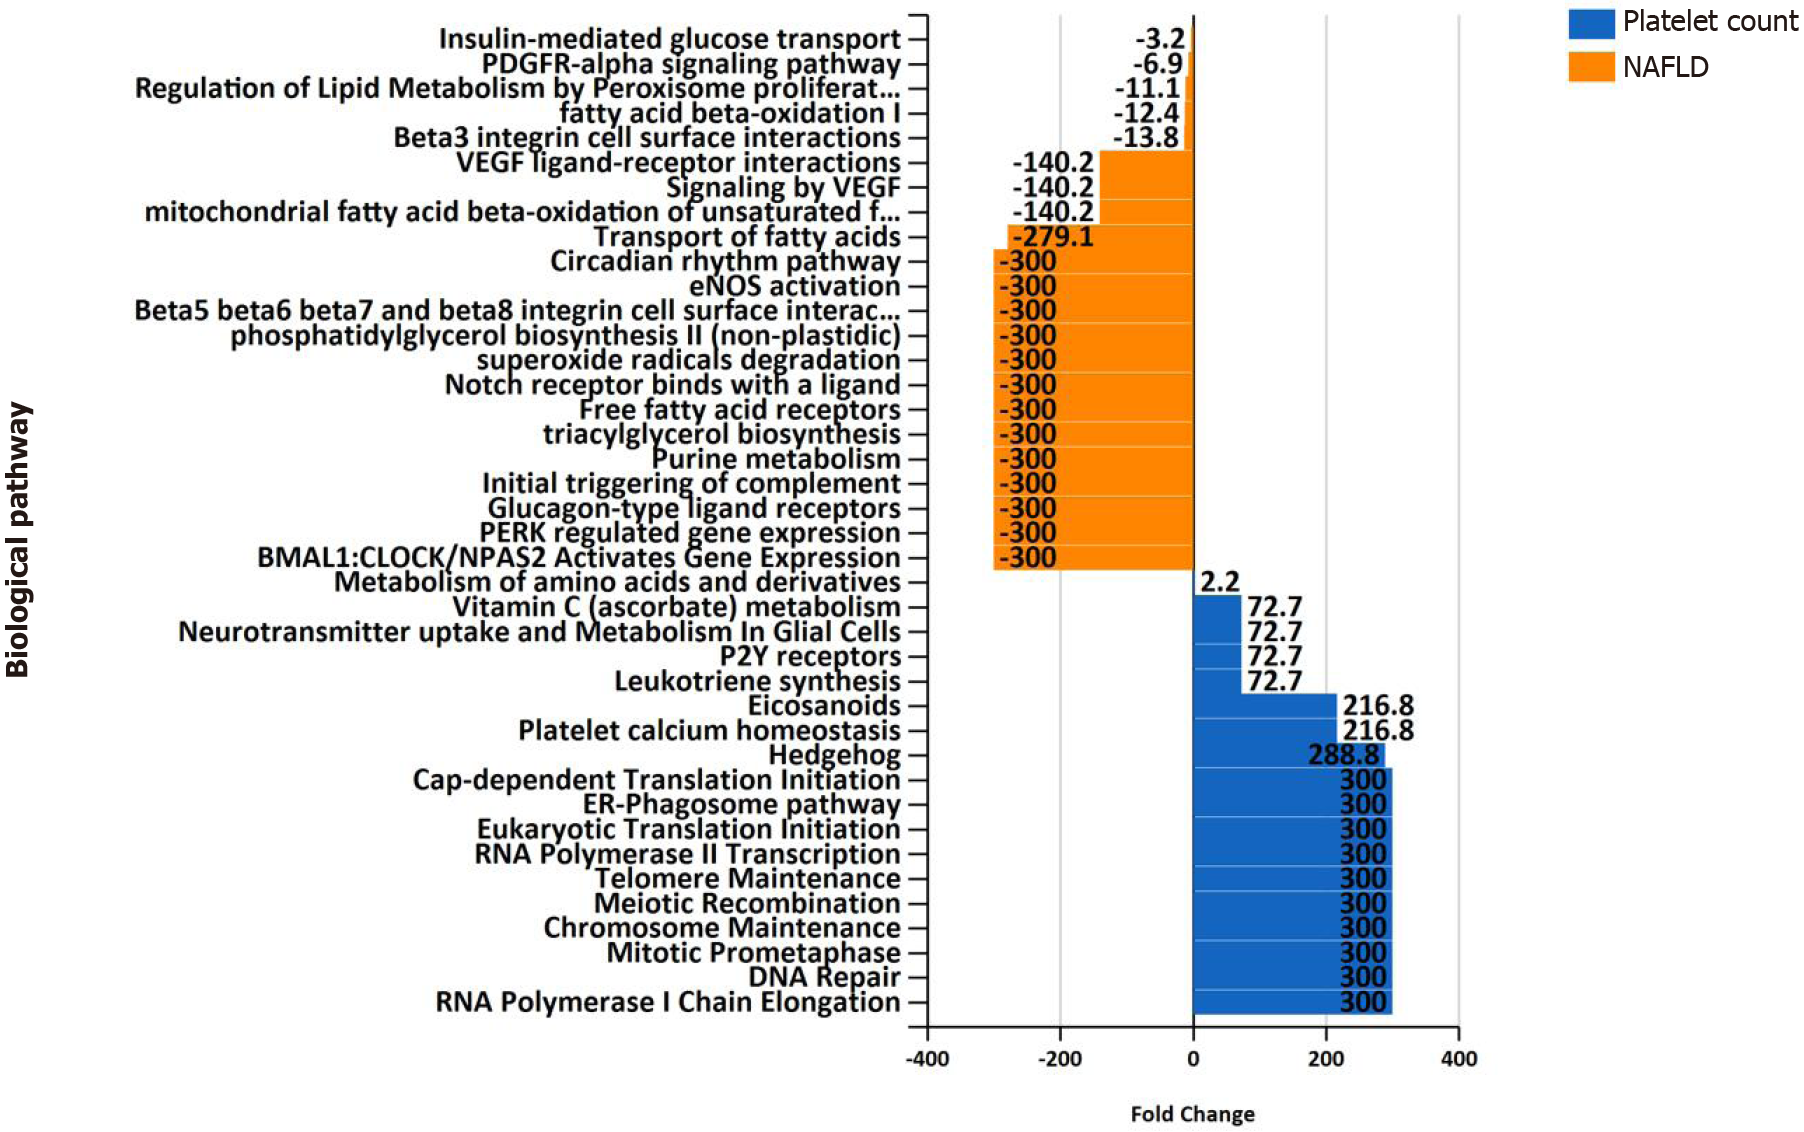
Figure 5 Overrepresentation analysis of biological pathways of genes associated with platelet count vs.
genes associated with nonalcoholic fatty liver disease. Overrepresentation analysis of biological pathways of platelet count-associated genes in comparison with that pertaining to nonalcoholic fatty liver disease-associated genes. The input list of platelet count-associated variants (P < 1 × 10⁻⁶) was generated by searching the United Kingdom Biobank genome-wide association studies database as provided by Neale’s lab resource (http://www.nealelab.is/uk-biobank/). The input list associated with nonalcoholic fatty liver disease includes 928 genes/proteins obtained by data mining[5]. The analysis was performed by applying the functional enrichment and interaction network analysis (FunRich) tool[46].
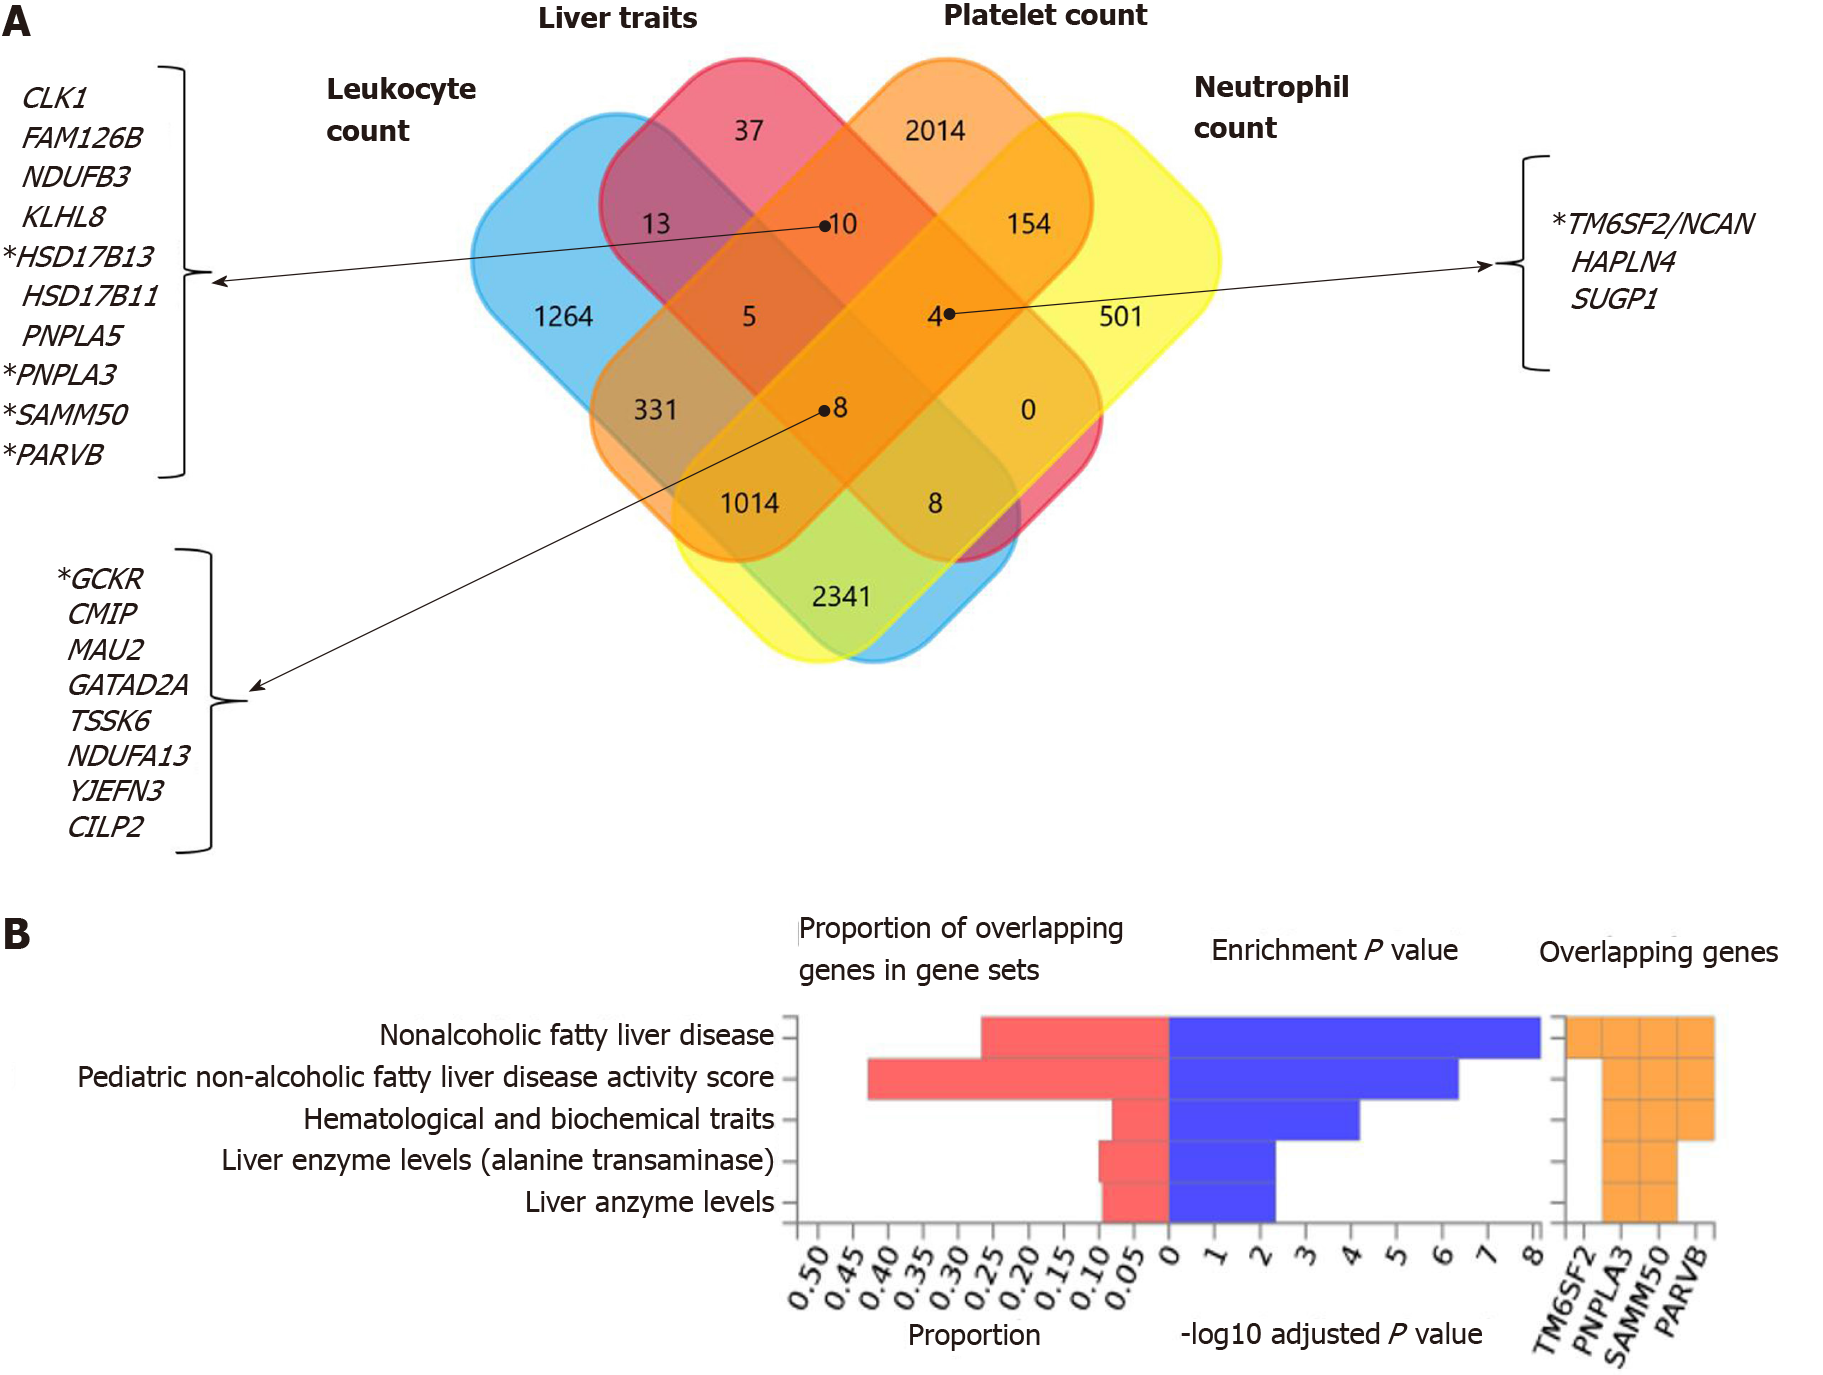
Figure 6 Nonalcoholic fatty liver disease and hematological traits associated genes.
A: Venn diagram showing the set of genes associated with liver traits (ICD10 codes: K70, K76, K74 and K75), platelet count, leukocyte count, and neutrophil count, as well as their overlapping genes in the United Kingdom Biobank. Approximately 30 million variants in the United Kingdom Biobank dataset sourced from the Neale's database (http://www.nealelab.is/uk-biobank/) were comprehensively tested for association with liver and blood cell traits, including platelet, leukocyte and neutrophil counts. B: Overlap between nonalcoholic fatty liver disease-associated genes and those associated with hematological traits. The chart shows information on previously known single nucleotide polymorphisms-trait associations reported in the genome-wide association studies (GWAS) catalog for all single nucleotide polymorphisms associated with nonalcoholic fatty liver disease in the United Kingdom Biobank GWAS database; the analysis was conducted using the FUMA GWAS tool (https://fuma.ctglab.nl/).
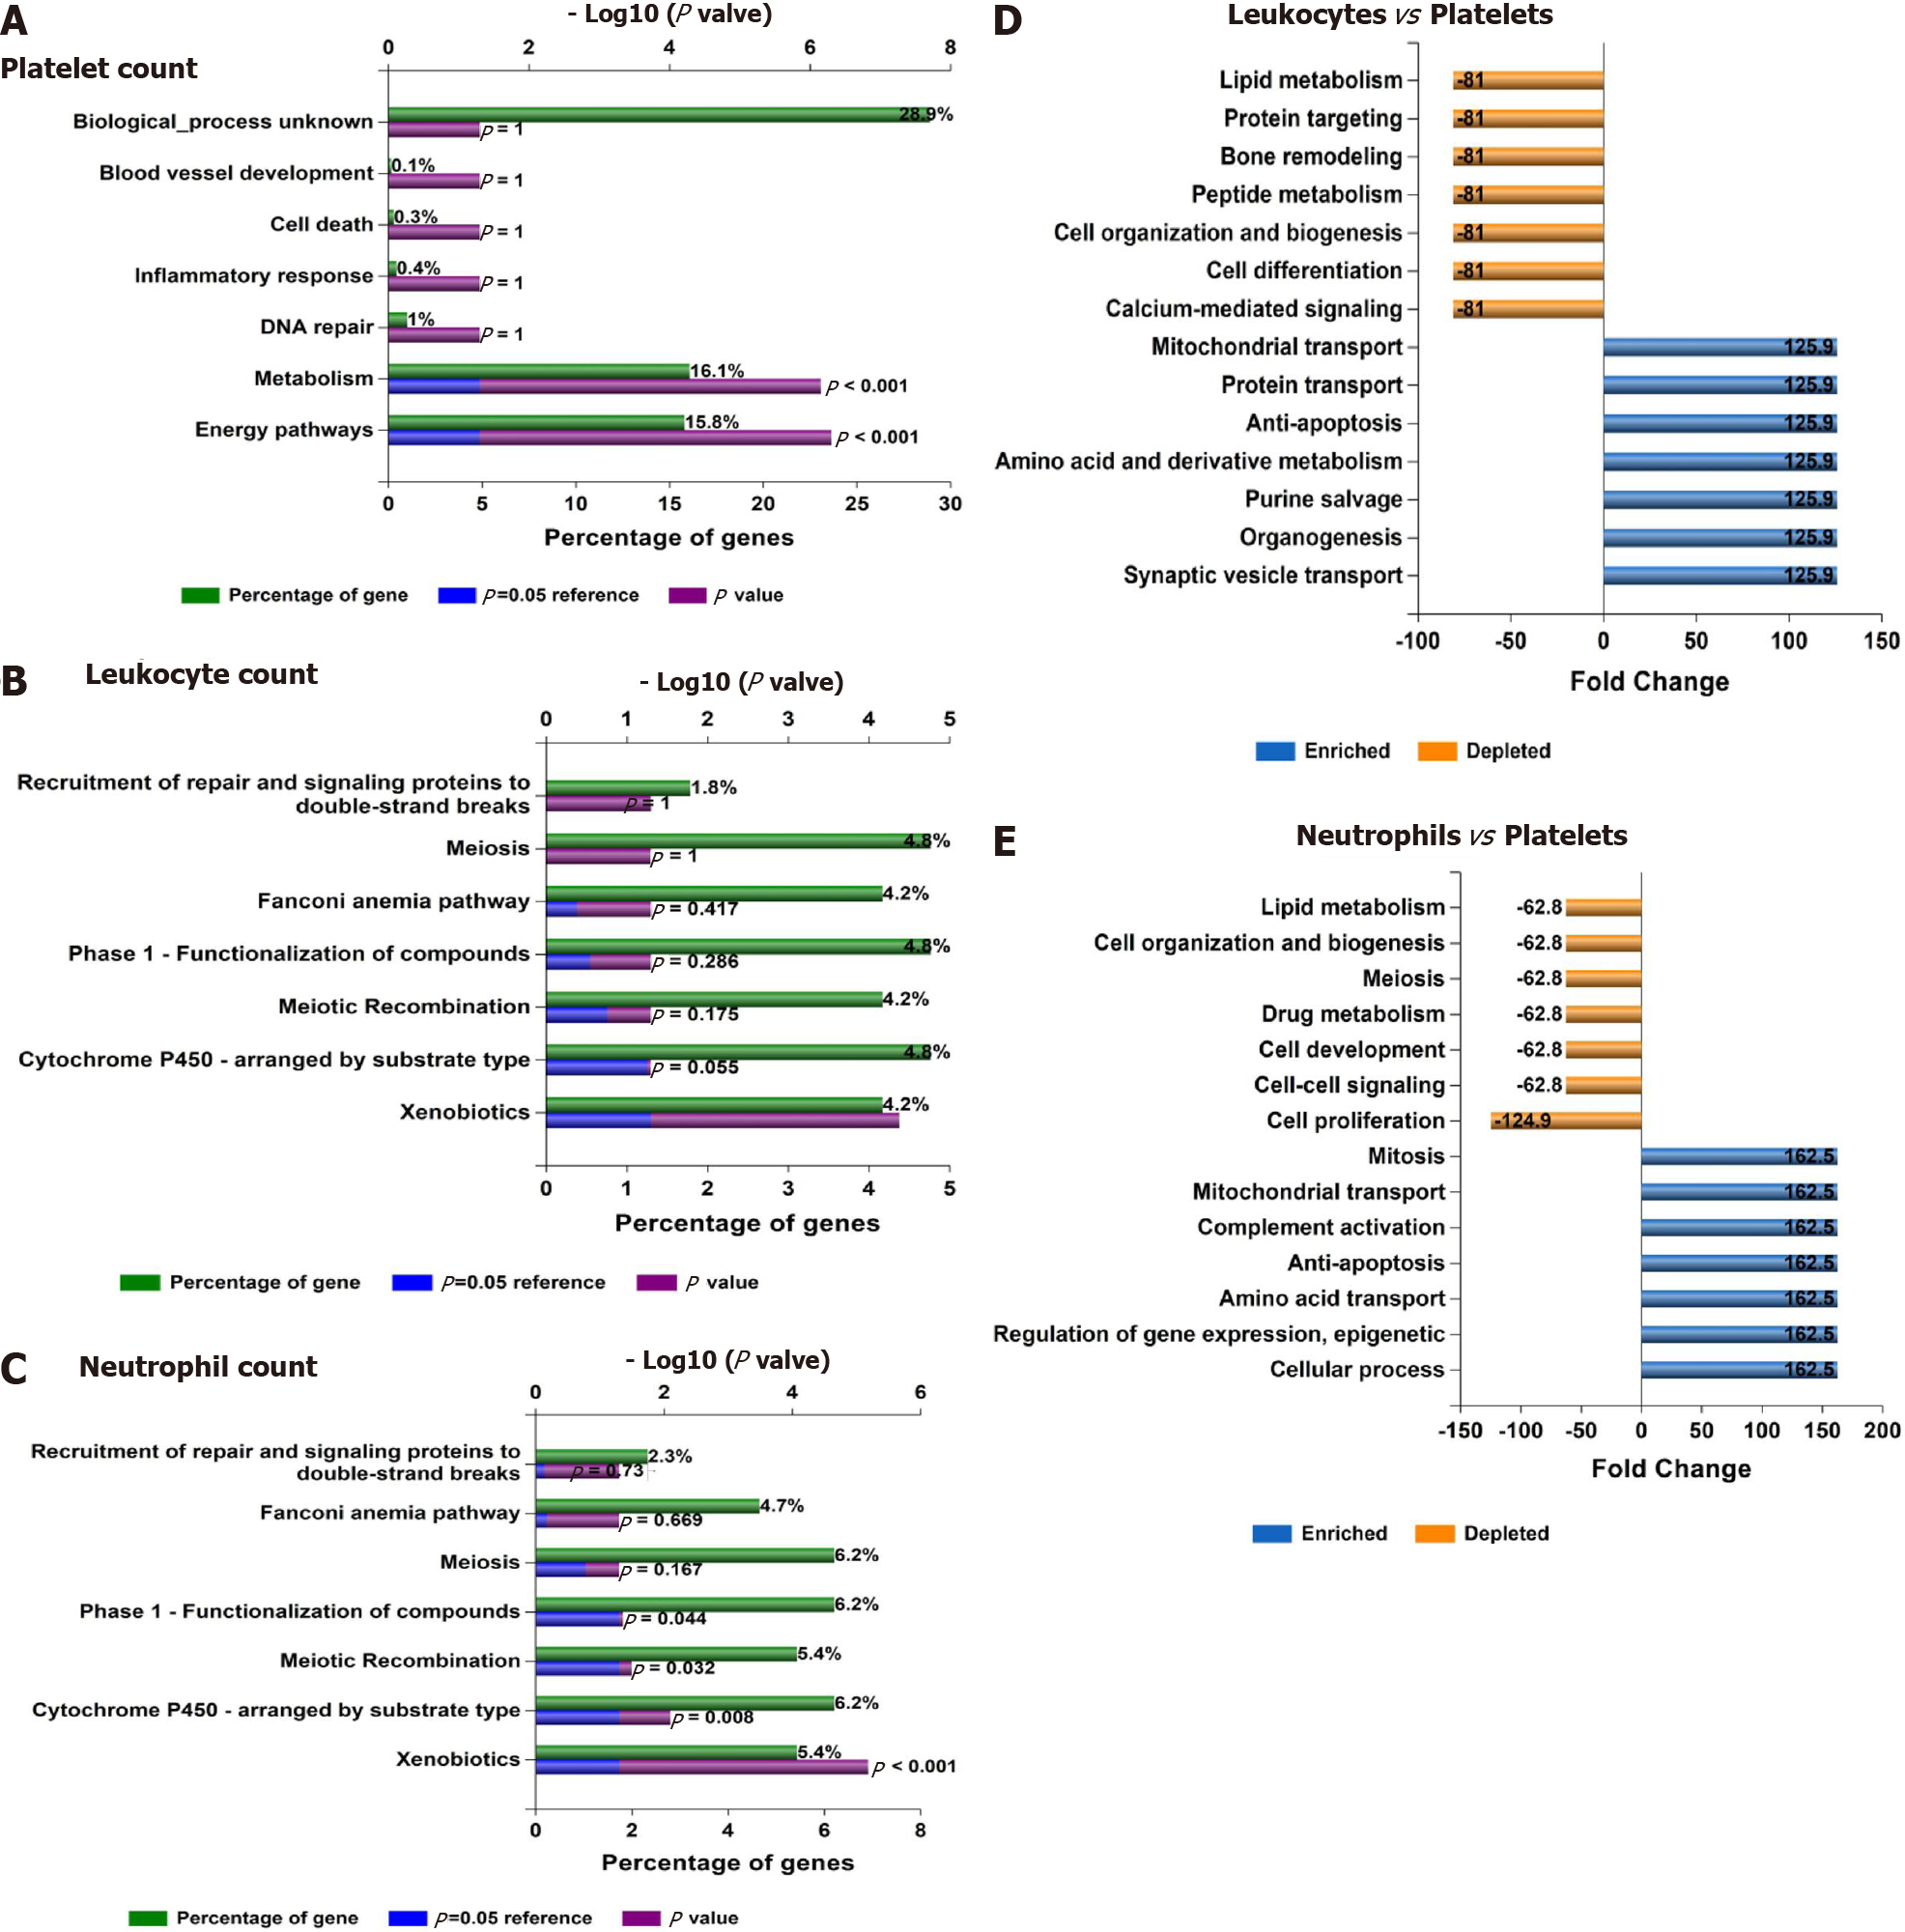
Figure 7 Functional assessment of variants associated with laboratory hematological-related traits.
A-C: Functional analysis of genes significantly associated with platelet, leukocyte, and neutrophil count in the whole genome-wide association studies dataset (452264 individuals whose data are included in the United Kingdom Biobank). Functional enrichment analysis was performed using the FunRich tool, while Bonferroni and Benjamini-Hochberg methods were used to correct for multiple testing. D-E: Charts show fold changes in biological processes of genes associated with leukocyte or neutrophil counts vs biological processes of genes associated with platelet count. The input list of genes associated with platelet count, leukocyte count, and neutrophil count (P < 1 × 10⁻⁸) was generated by searching the United Kingdom Biobank genome-wide association studies database.
- Citation: Pirola CJ, Salatino A, Sookoian S. Pleiotropy within gene variants associated with nonalcoholic fatty liver disease and traits of the hematopoietic system. World J Gastroenterol 2021; 27(4): 305-320
- URL: https://www.wjgnet.com/1007-9327/full/v27/i4/305.htm
- DOI: https://dx.doi.org/10.3748/wjg.v27.i4.305


