Copyright
©The Author(s) 2021.
World J Gastroenterol. Oct 14, 2021; 27(38): 6476-6488
Published online Oct 14, 2021. doi: 10.3748/wjg.v27.i38.6476
Published online Oct 14, 2021. doi: 10.3748/wjg.v27.i38.6476
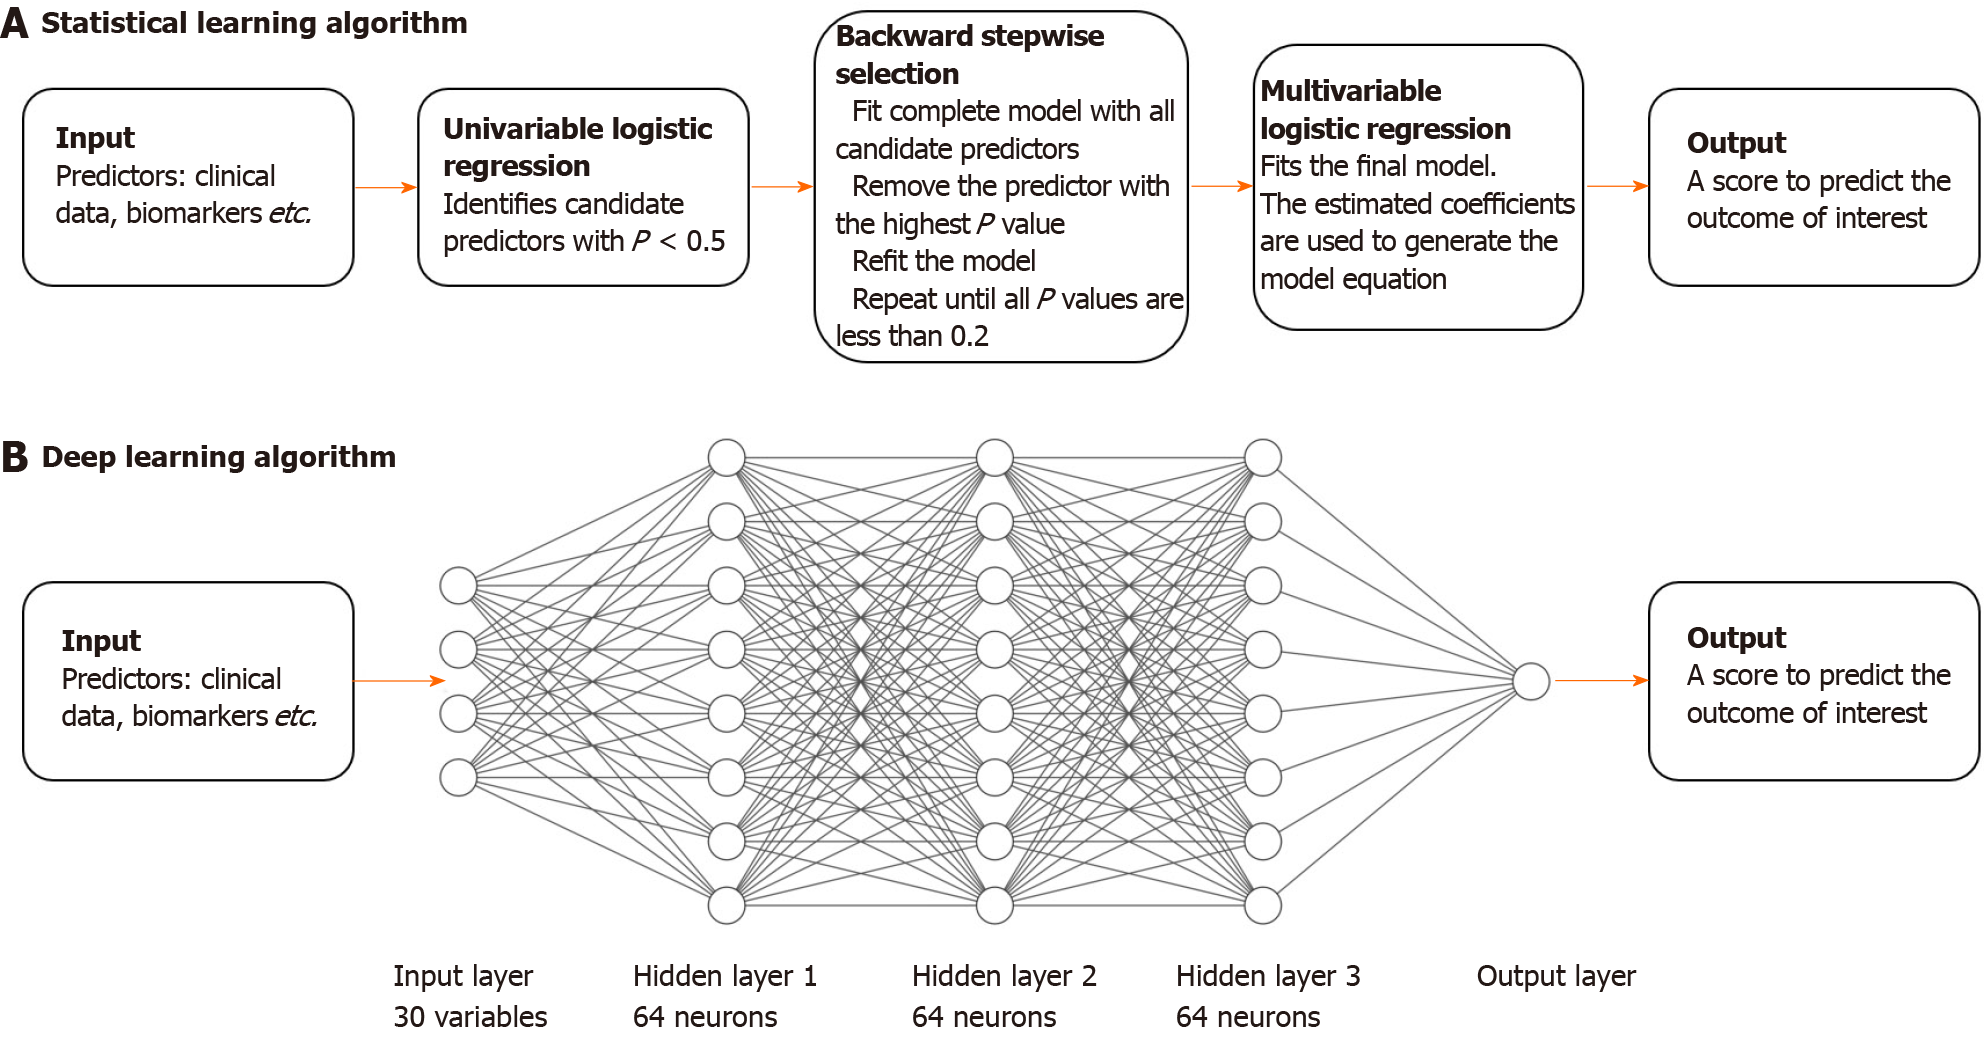
Figure 1 Comparison of the predictive modelling process using two supervised learning algorithms.
A: Conventional statistical learning; B: Deep learning.
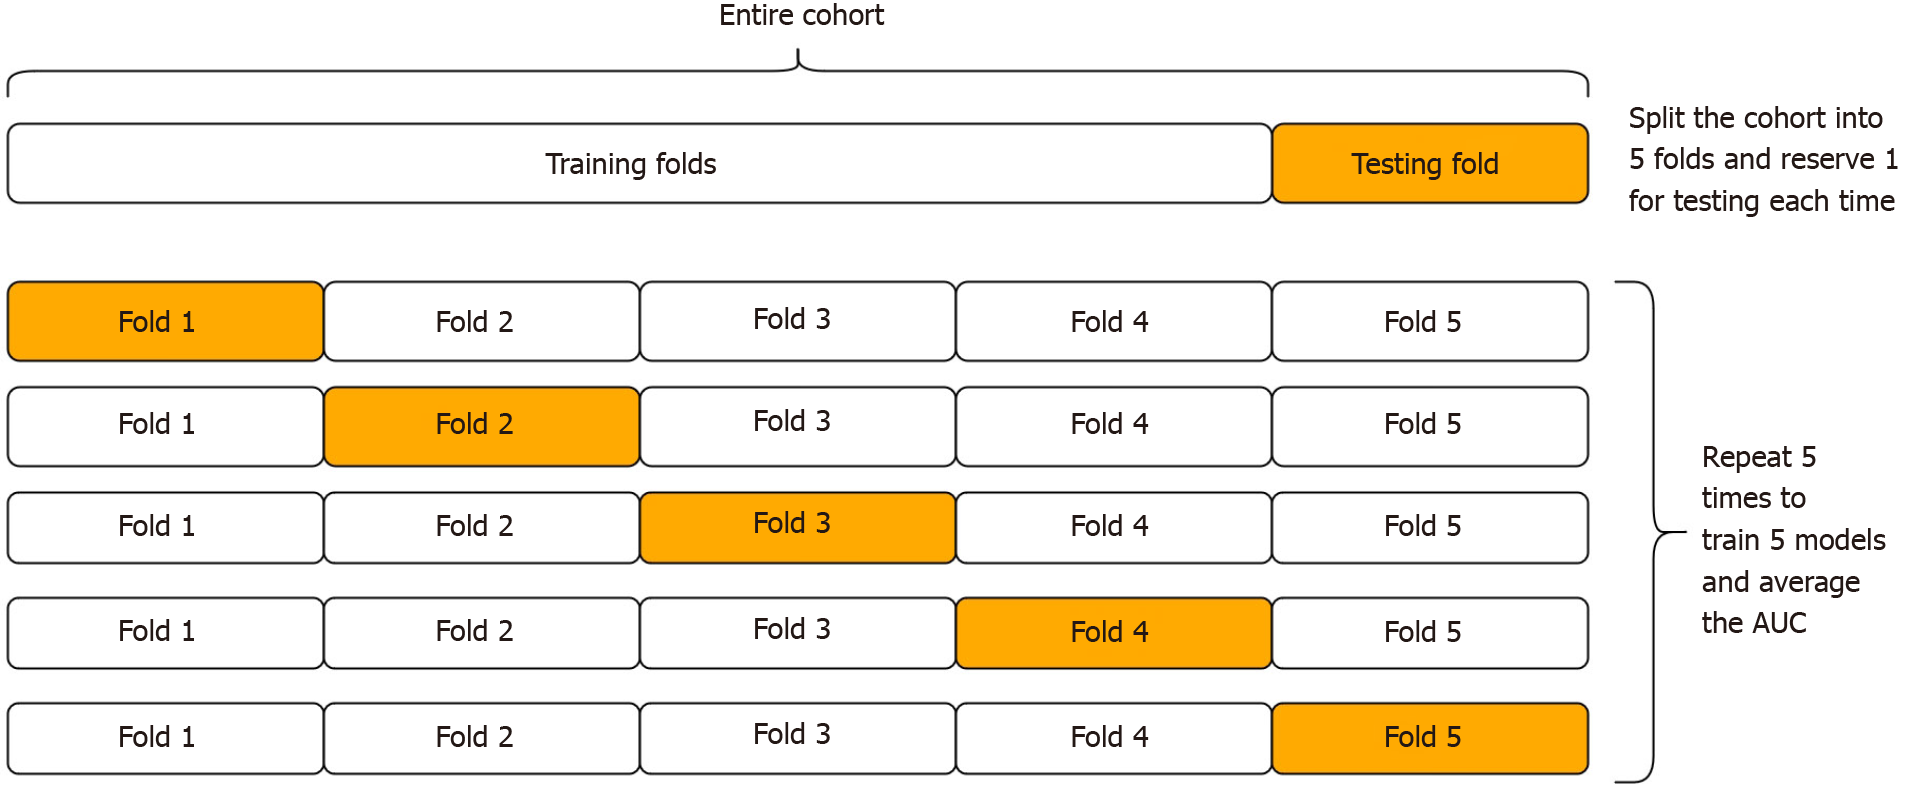
Figure 2 Schematic diagram of k-fold cross validation procedure for k = 5.
This method is considered more reliable than a random train-test split, which would be analogous to training only one model, instead of the average of k models. AUC: Area under the receiver operator characteristic curve.
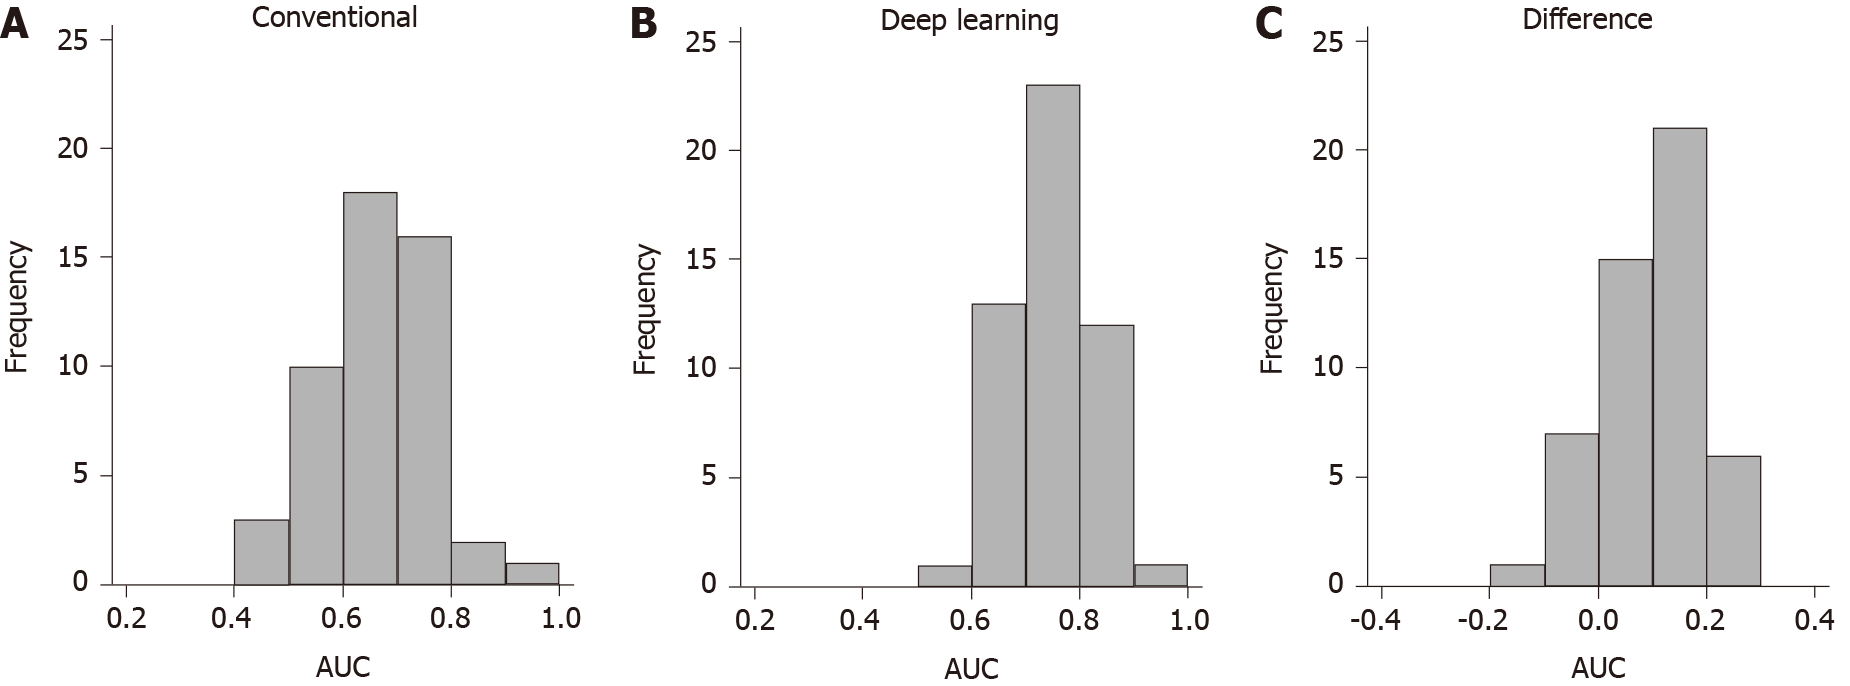
Figure 3 Distribution of area under the receiver operator characteristic curve after 10 × 5 fold cross validation.
A: Conventional statistical learning algorithm (mean 0.659, SD 0.095); B: Recurrent neural network (mean 0.754, SD 0.078); C: Head-to-head comparison, matched at each fold and repetition (mean difference, + 0.095, P = 0.036). AUC: Area under the receiver operator characteristic curve.
- Citation: Con D, van Langenberg DR, Vasudevan A. Deep learning vs conventional learning algorithms for clinical prediction in Crohn's disease: A proof-of-concept study. World J Gastroenterol 2021; 27(38): 6476-6488
- URL: https://www.wjgnet.com/1007-9327/full/v27/i38/6476.htm
- DOI: https://dx.doi.org/10.3748/wjg.v27.i38.6476


