Copyright
©The Author(s) 2021.
World J Gastroenterol. Oct 14, 2021; 27(38): 6465-6475
Published online Oct 14, 2021. doi: 10.3748/wjg.v27.i38.6465
Published online Oct 14, 2021. doi: 10.3748/wjg.v27.i38.6465
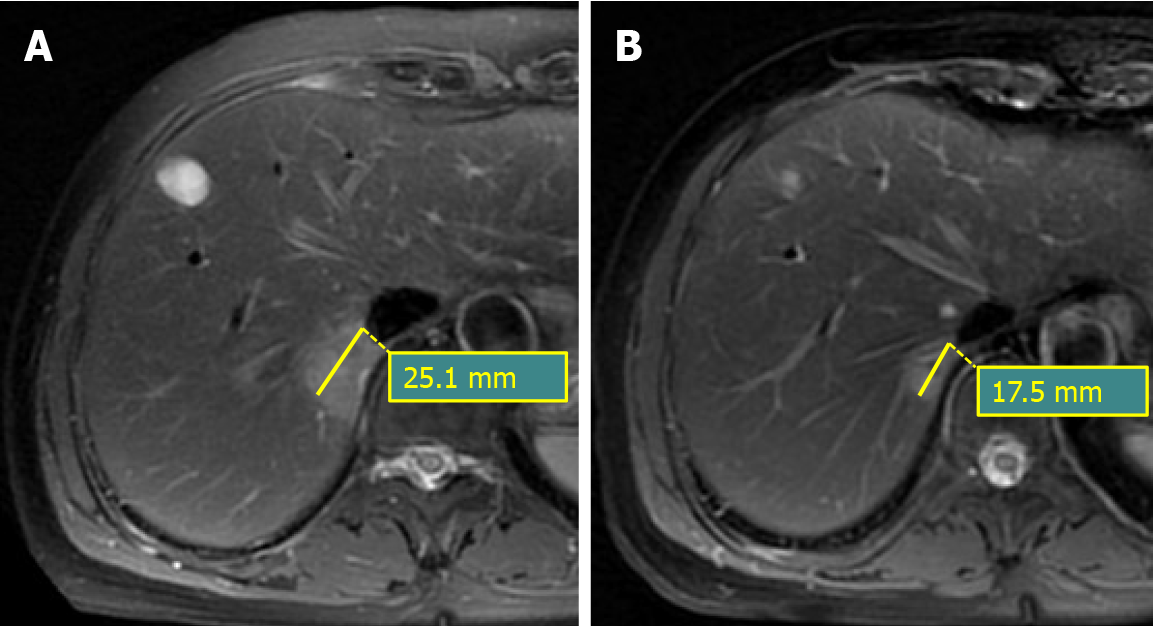
Figure 1 Magnetic resonance imaging examinations.
A: A 48-year-old female had a synchronous liver metastasis with baseline long diameter of 25.1 mm; B: After chemotherapy, the lesion a had 30.3% decrease in long diameter of 17.5 mm, which belonged to the disease response group for analysis.
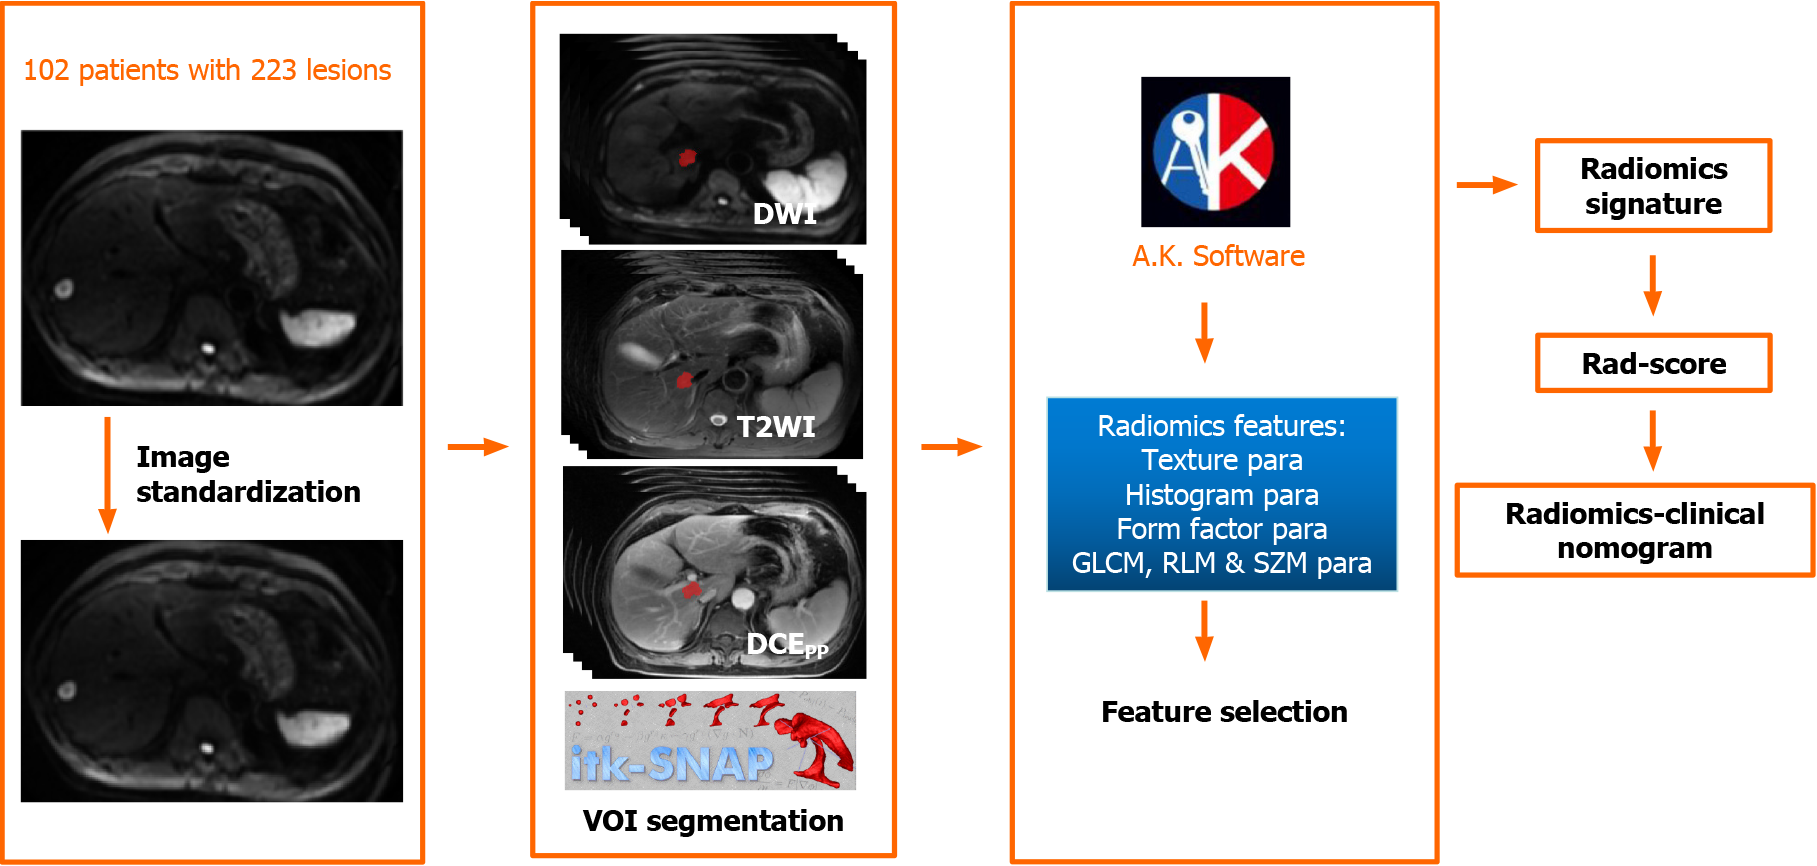
Figure 2 The workflow of radiomics signature in differentiating the responses of synchronous liver metastasis patients to chemotherapy.
VOI: Volume of interest; GLCM: Gray-level co-occurrence matrices; RLM: Run-length matrices; SZM: Size zone matrices; Rad-score: Radiomics score.
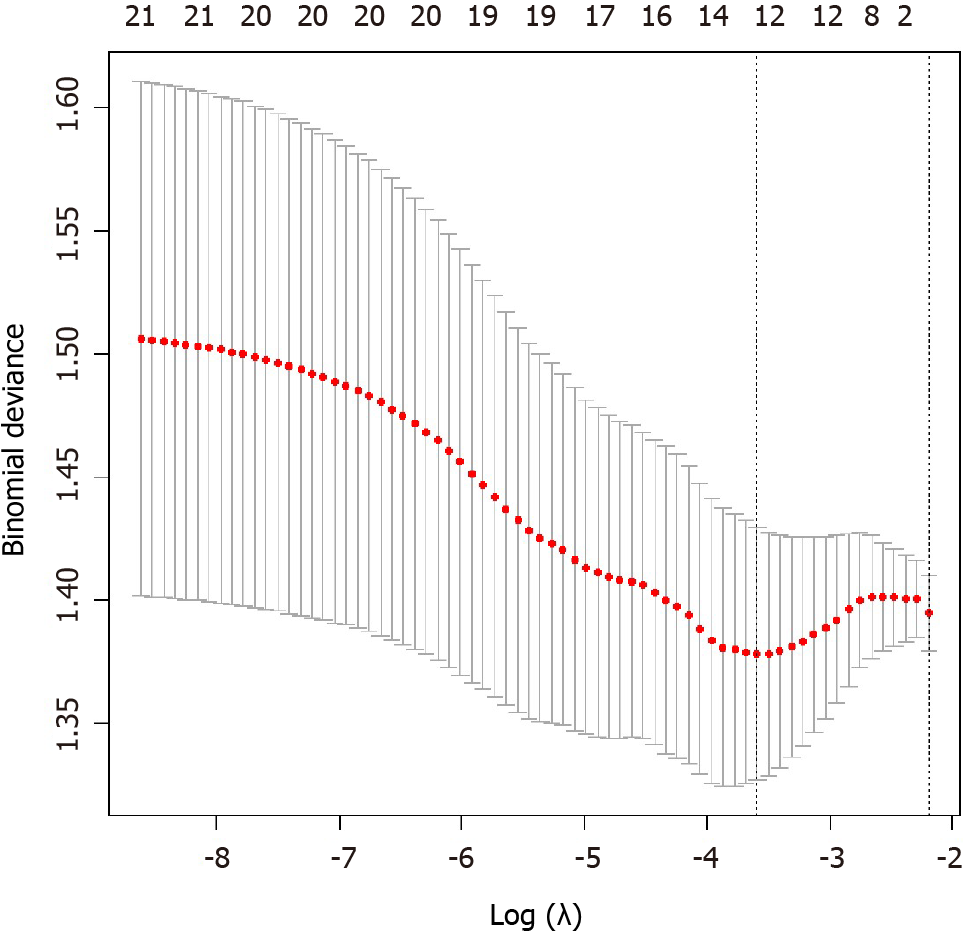
Figure 3 The feature selection method of least absolute shrinkage and selection operator.
A total of 12 optimal features were selected.
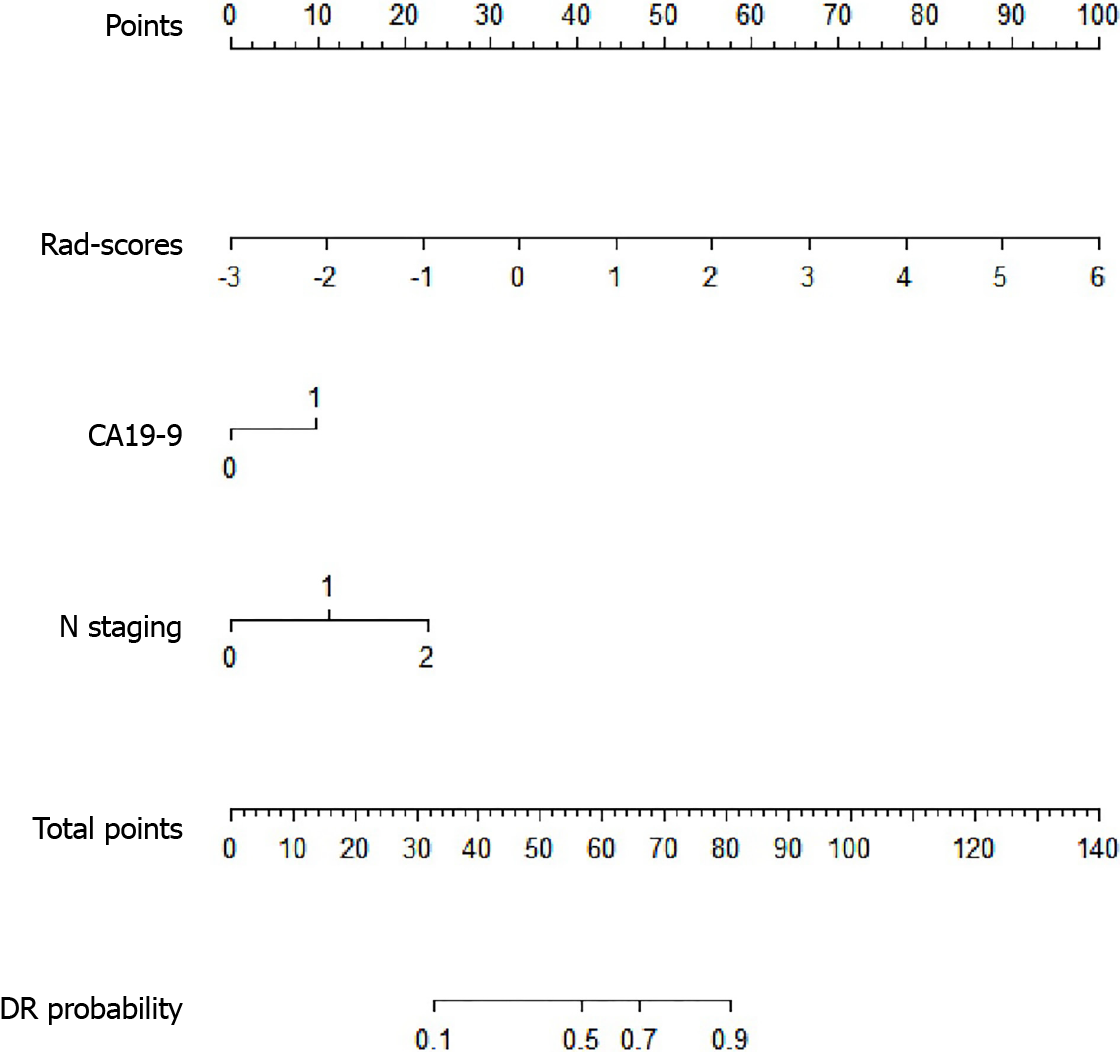
Figure 4 The nomogram of radiomics-clinical analysis to differentiate patients with disease non-response group from disease response group.
The zero in CA19-9 represented normal and one referred to abnormal. DR: Disease response group; Rad-score: Radiomics score.
- Citation: Ma YQ, Wen Y, Liang H, Zhong JG, Pang PP. Magnetic resonance imaging-radiomics evaluation of response to chemotherapy for synchronous liver metastasis of colorectal cancer. World J Gastroenterol 2021; 27(38): 6465-6475
- URL: https://www.wjgnet.com/1007-9327/full/v27/i38/6465.htm
- DOI: https://dx.doi.org/10.3748/wjg.v27.i38.6465


