Copyright
©The Author(s) 2021.
World J Gastroenterol. Sep 7, 2021; 27(33): 5610-5621
Published online Sep 7, 2021. doi: 10.3748/wjg.v27.i33.5610
Published online Sep 7, 2021. doi: 10.3748/wjg.v27.i33.5610
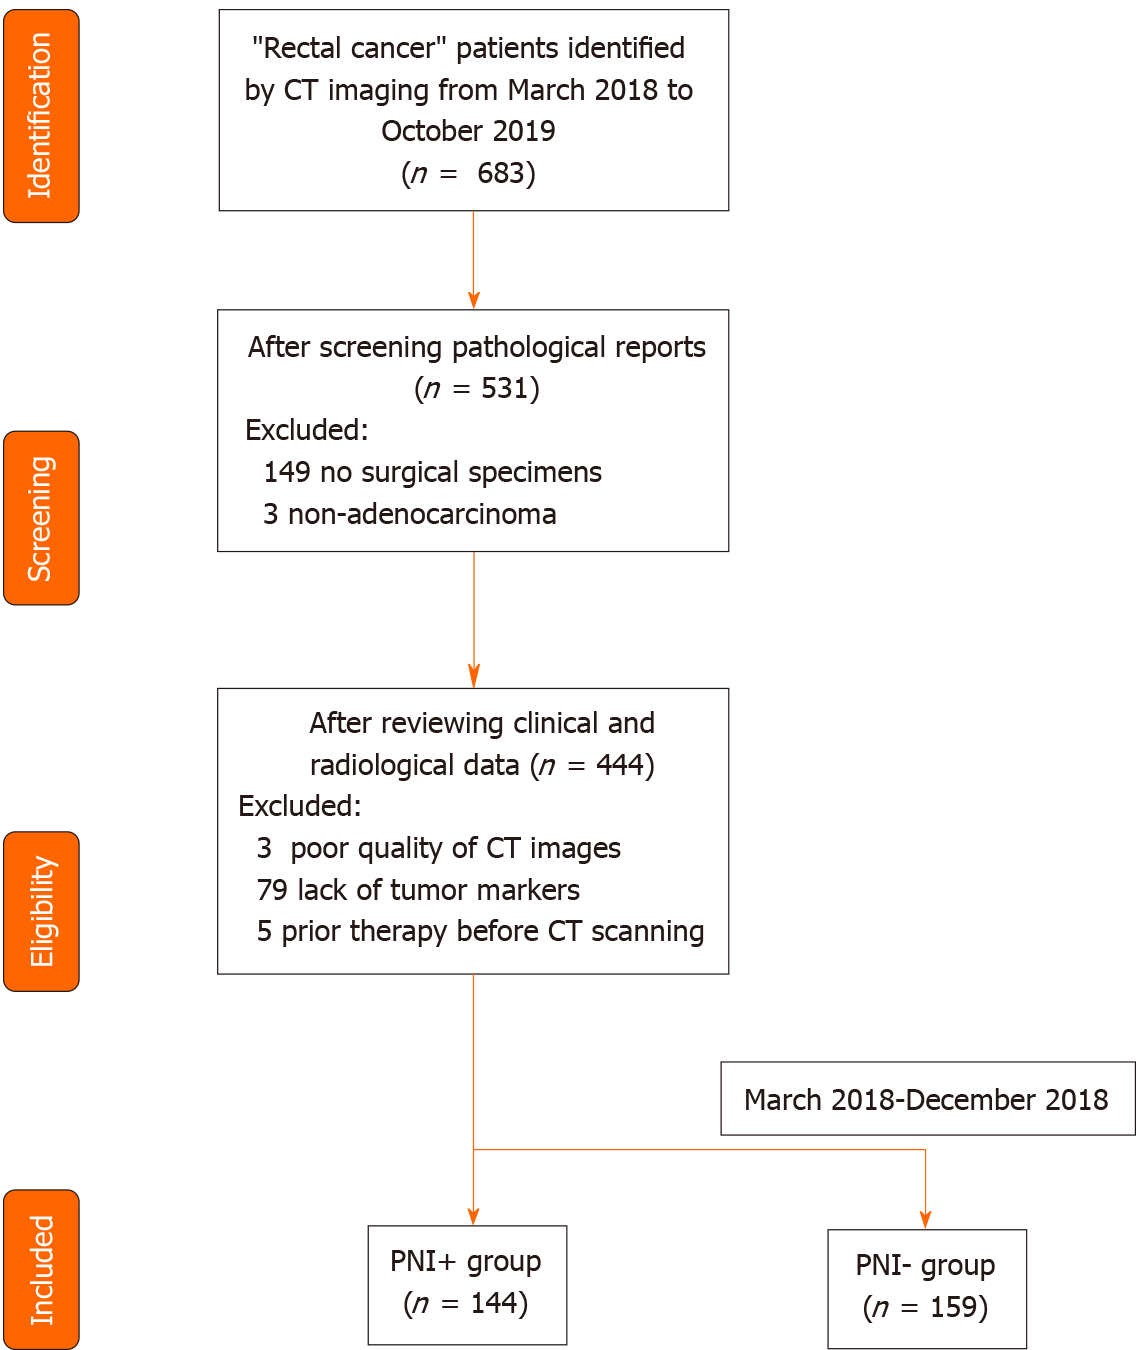
Figure 1 Flowchart of patients’ recruitment pathway.
CT: Computed tomography; PNI: Perineural invasion.
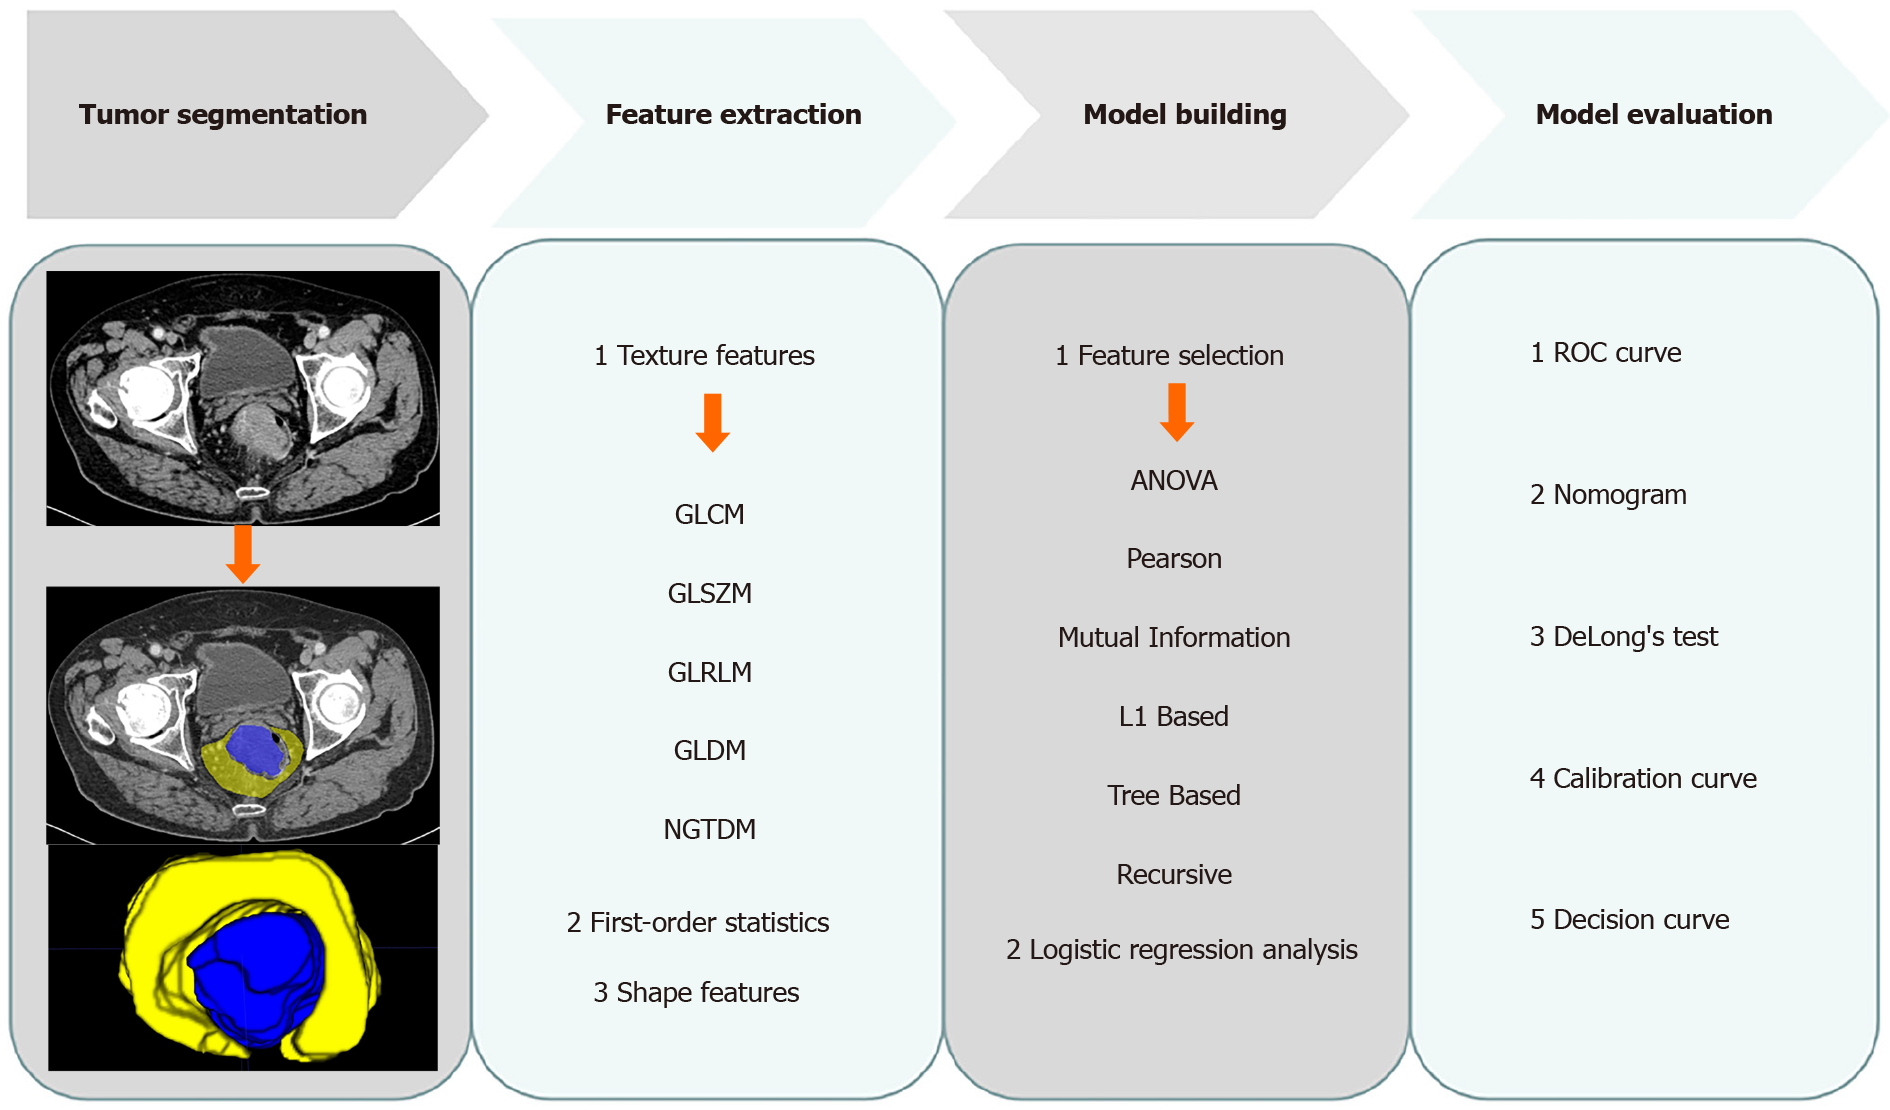
Figure 2 Radiomics workflow.
GLCM: Gray level co-occurrence matrix; GLSZM: Gray level size zone matrix; GLRLM: Gray level run length matrix; GLDM: Gray level dependence matrix; NGTDM: Neighbouring gray tone difference matrix; ANOVA: Analysis of variance; ROC: Receiver operating characteristic curve.
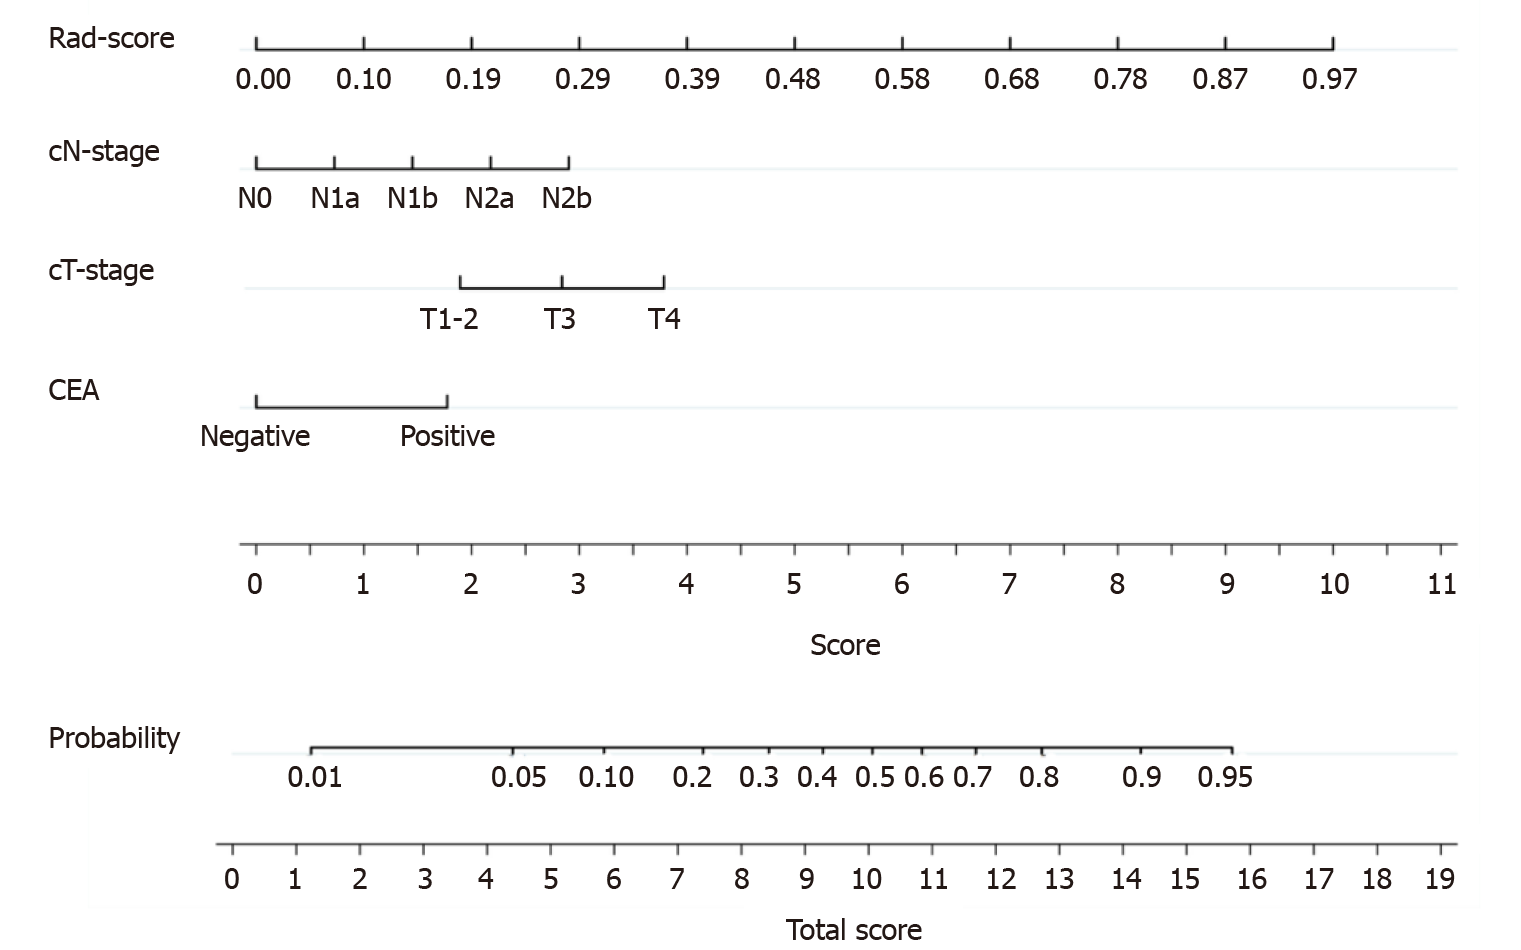
Figure 3 The nomogram was developed in the training cohort.
Sum the points of variables in the “score” axis to get the total points. The risk of perineural invasion is the corresponding value on the “probability” axis. CEA: Carcinoembryonic antigen; cT: Computed tomography-reported T stage; cN: Computed tomography-reported N stage.
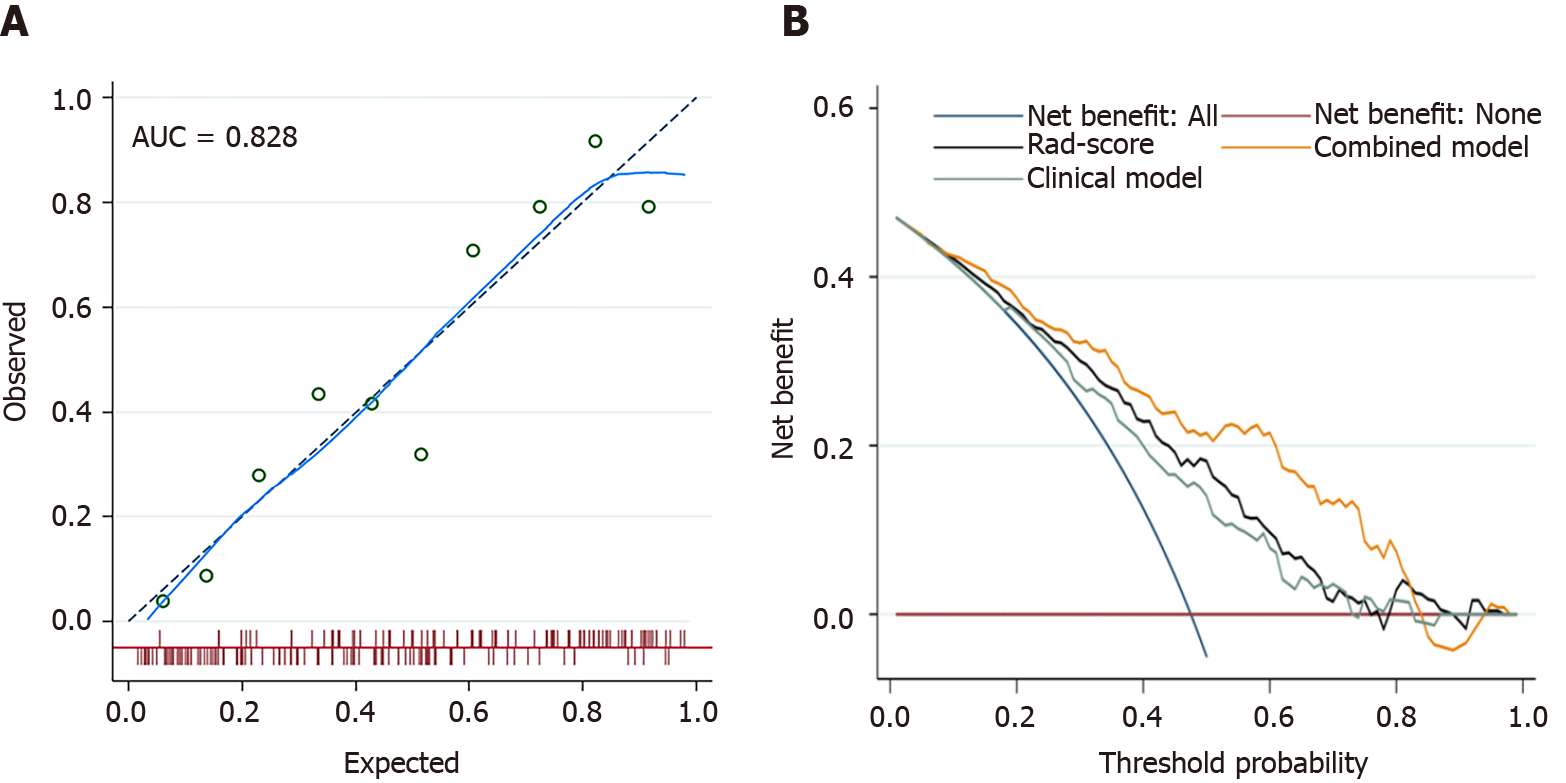
Figure 4 The fit and usefulness evaluation of the nomogram.
A: The calibration curve of the nomogram shows a good agreement between the predicted and observed risks in the training cohort; B: The decision curve demonstrates that the nomogram (combined model) obtains more benefit than “treat all”, “treat none”, Rad-score, and the clinical model, when the threshold probability is in the range of 10% to 83%. AUC: Area under the receiver operating characteristic curve.
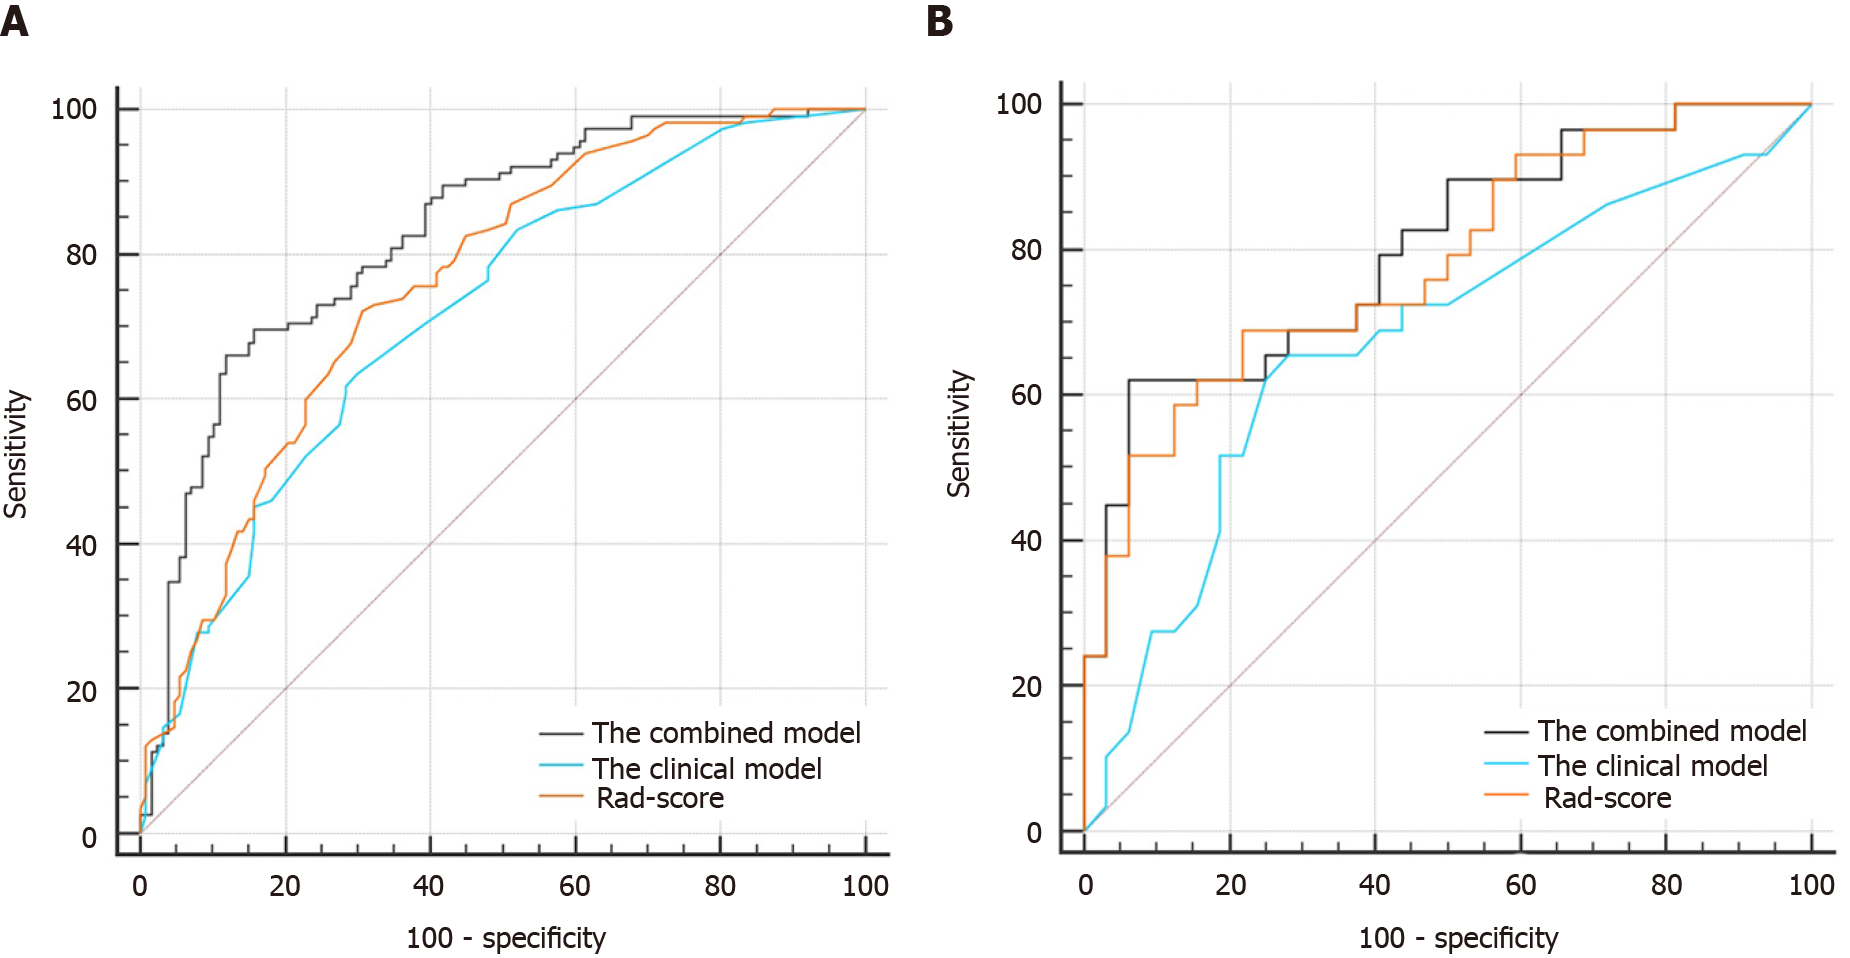
Figure 5 The comparisons of receiver operating characteristic curves in this study.
A: In the training cohort: Area under the receiver operating characteristic curve (AUC) = 0.828 for the combined model, 0.718 for the clinical model, and 0.760 for Rad-score; B: In the validation cohort: AUC = 0.801 for the combined model, 0.674 for the clinical model, and 0.782 for Rad-score.
- Citation: Li M, Jin YM, Zhang YC, Zhao YL, Huang CC, Liu SM, Song B. Radiomics for predicting perineural invasion status in rectal cancer. World J Gastroenterol 2021; 27(33): 5610-5621
- URL: https://www.wjgnet.com/1007-9327/full/v27/i33/5610.htm
- DOI: https://dx.doi.org/10.3748/wjg.v27.i33.5610


