Copyright
©The Author(s) 2021.
World J Gastroenterol. Sep 7, 2021; 27(33): 5575-5594
Published online Sep 7, 2021. doi: 10.3748/wjg.v27.i33.5575
Published online Sep 7, 2021. doi: 10.3748/wjg.v27.i33.5575
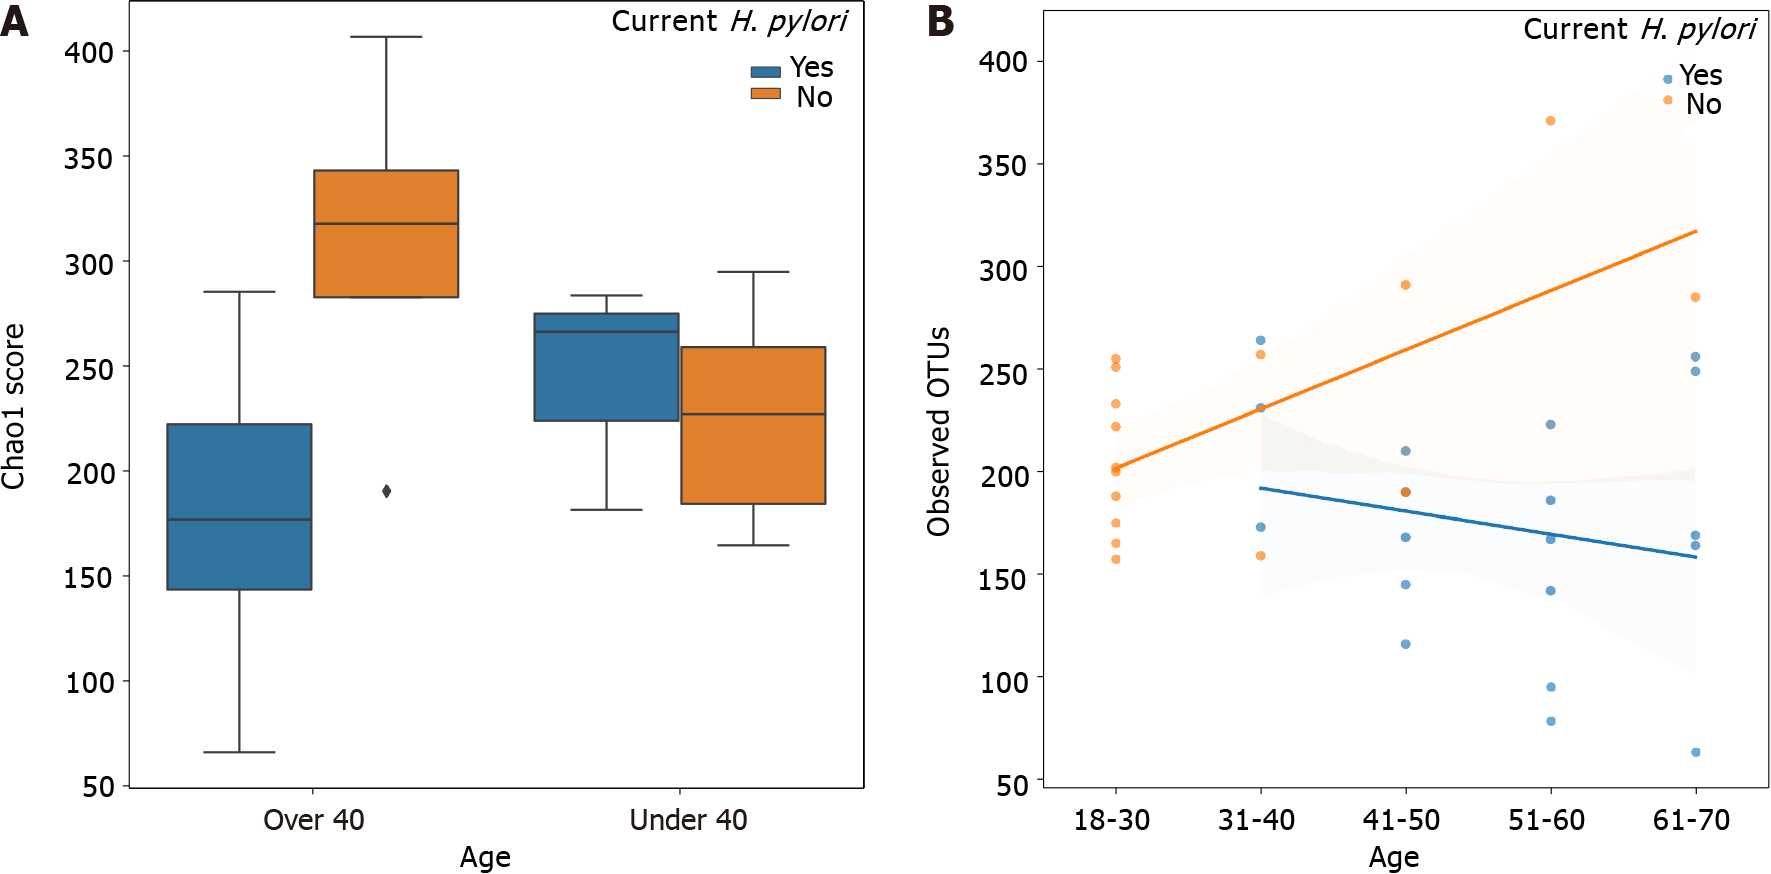
Figure 1 Chao1 index alpha diversity and observed operational taxonomic units by Helicobacter pylori status stratified by age.
A: Chao1 index alpha diversity is compared between Helicobacter pylori (H. pylori) patients (blue) and control subjects (orange), subgrouped by age. H. pylori patients over 40 years old (n = 16) had significantly lower Chao1 scores compared to control subjects over 40 (n = 4) (Kruskal-Wallis H = 6.036, P = 0.014). Boxes represent 1st and 3rd quartiles, and central lines represent median values. Whiskers represent non-outlier high and low values. Points show outliers, which were determined by having a distance from the 1st or 3rd quartile greater than 1.5 times the interquartile range; B: Observed operational taxonomic units (operational taxonomic units) are compared between H. pylori patients (blue, n = 19) and control subjects (orange, n = 16), as a function of age. Shading around the regression lines indicates 95% confidence intervals. OTU: Operational taxonomic units; H. pylori: Helicobacter pylori.
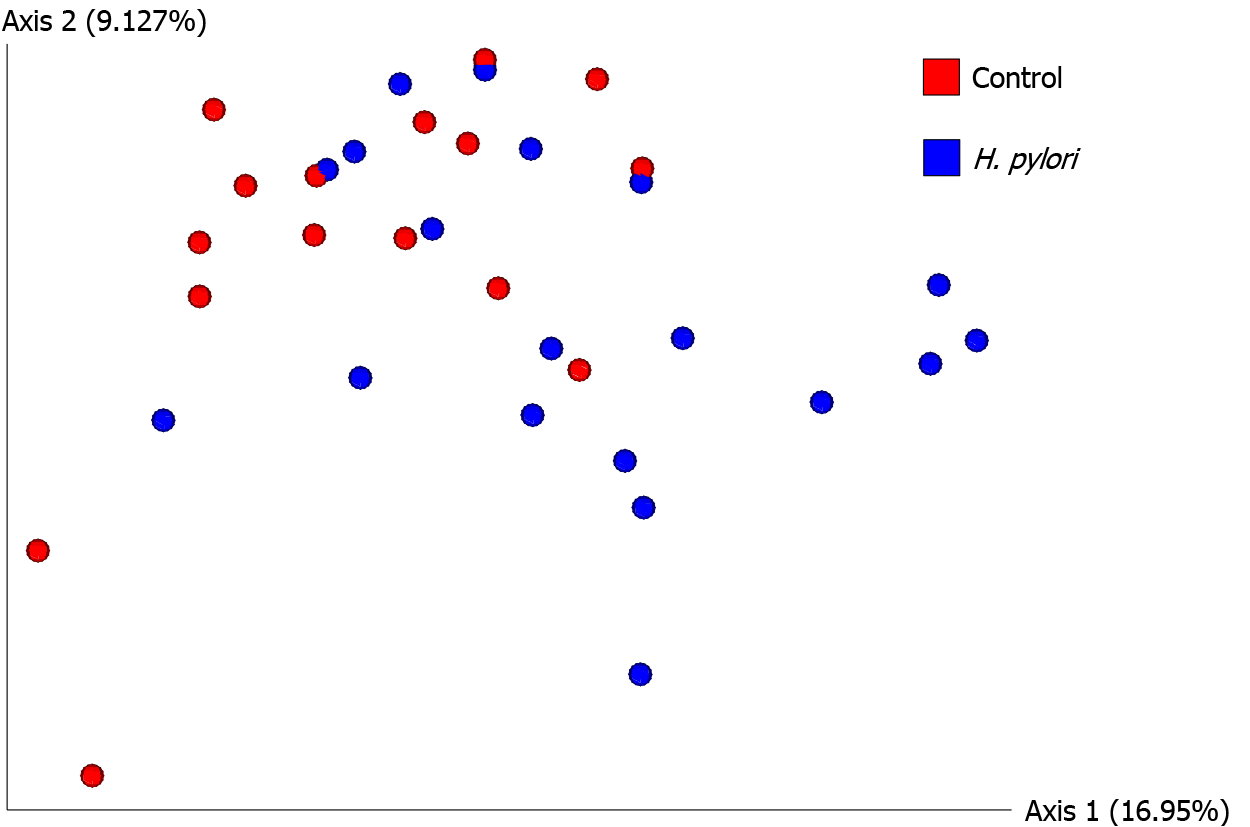
Figure 2 Beta diversity analysis by unweighted UniFrac principal coordinate analysis.
Unweighted principal coordinate analysis (PCoA) plot is shown comparing Helicobacter pylori (H. pylori) patients (blue, n = 19) to control subjects (red, n = 16). Significant differences between H. pylori patients and control subjects were identified by unweighted UniFrac PERMANOVA (F = 2.523, P = 0.001). The proportion of variance explained by each principal coordinate axis is denoted in the corresponding axis label; PCo1 explains 16.95% of the variability and PCo2 explains 9.13% of the variability. H. pylori: Helicobacter pylori.
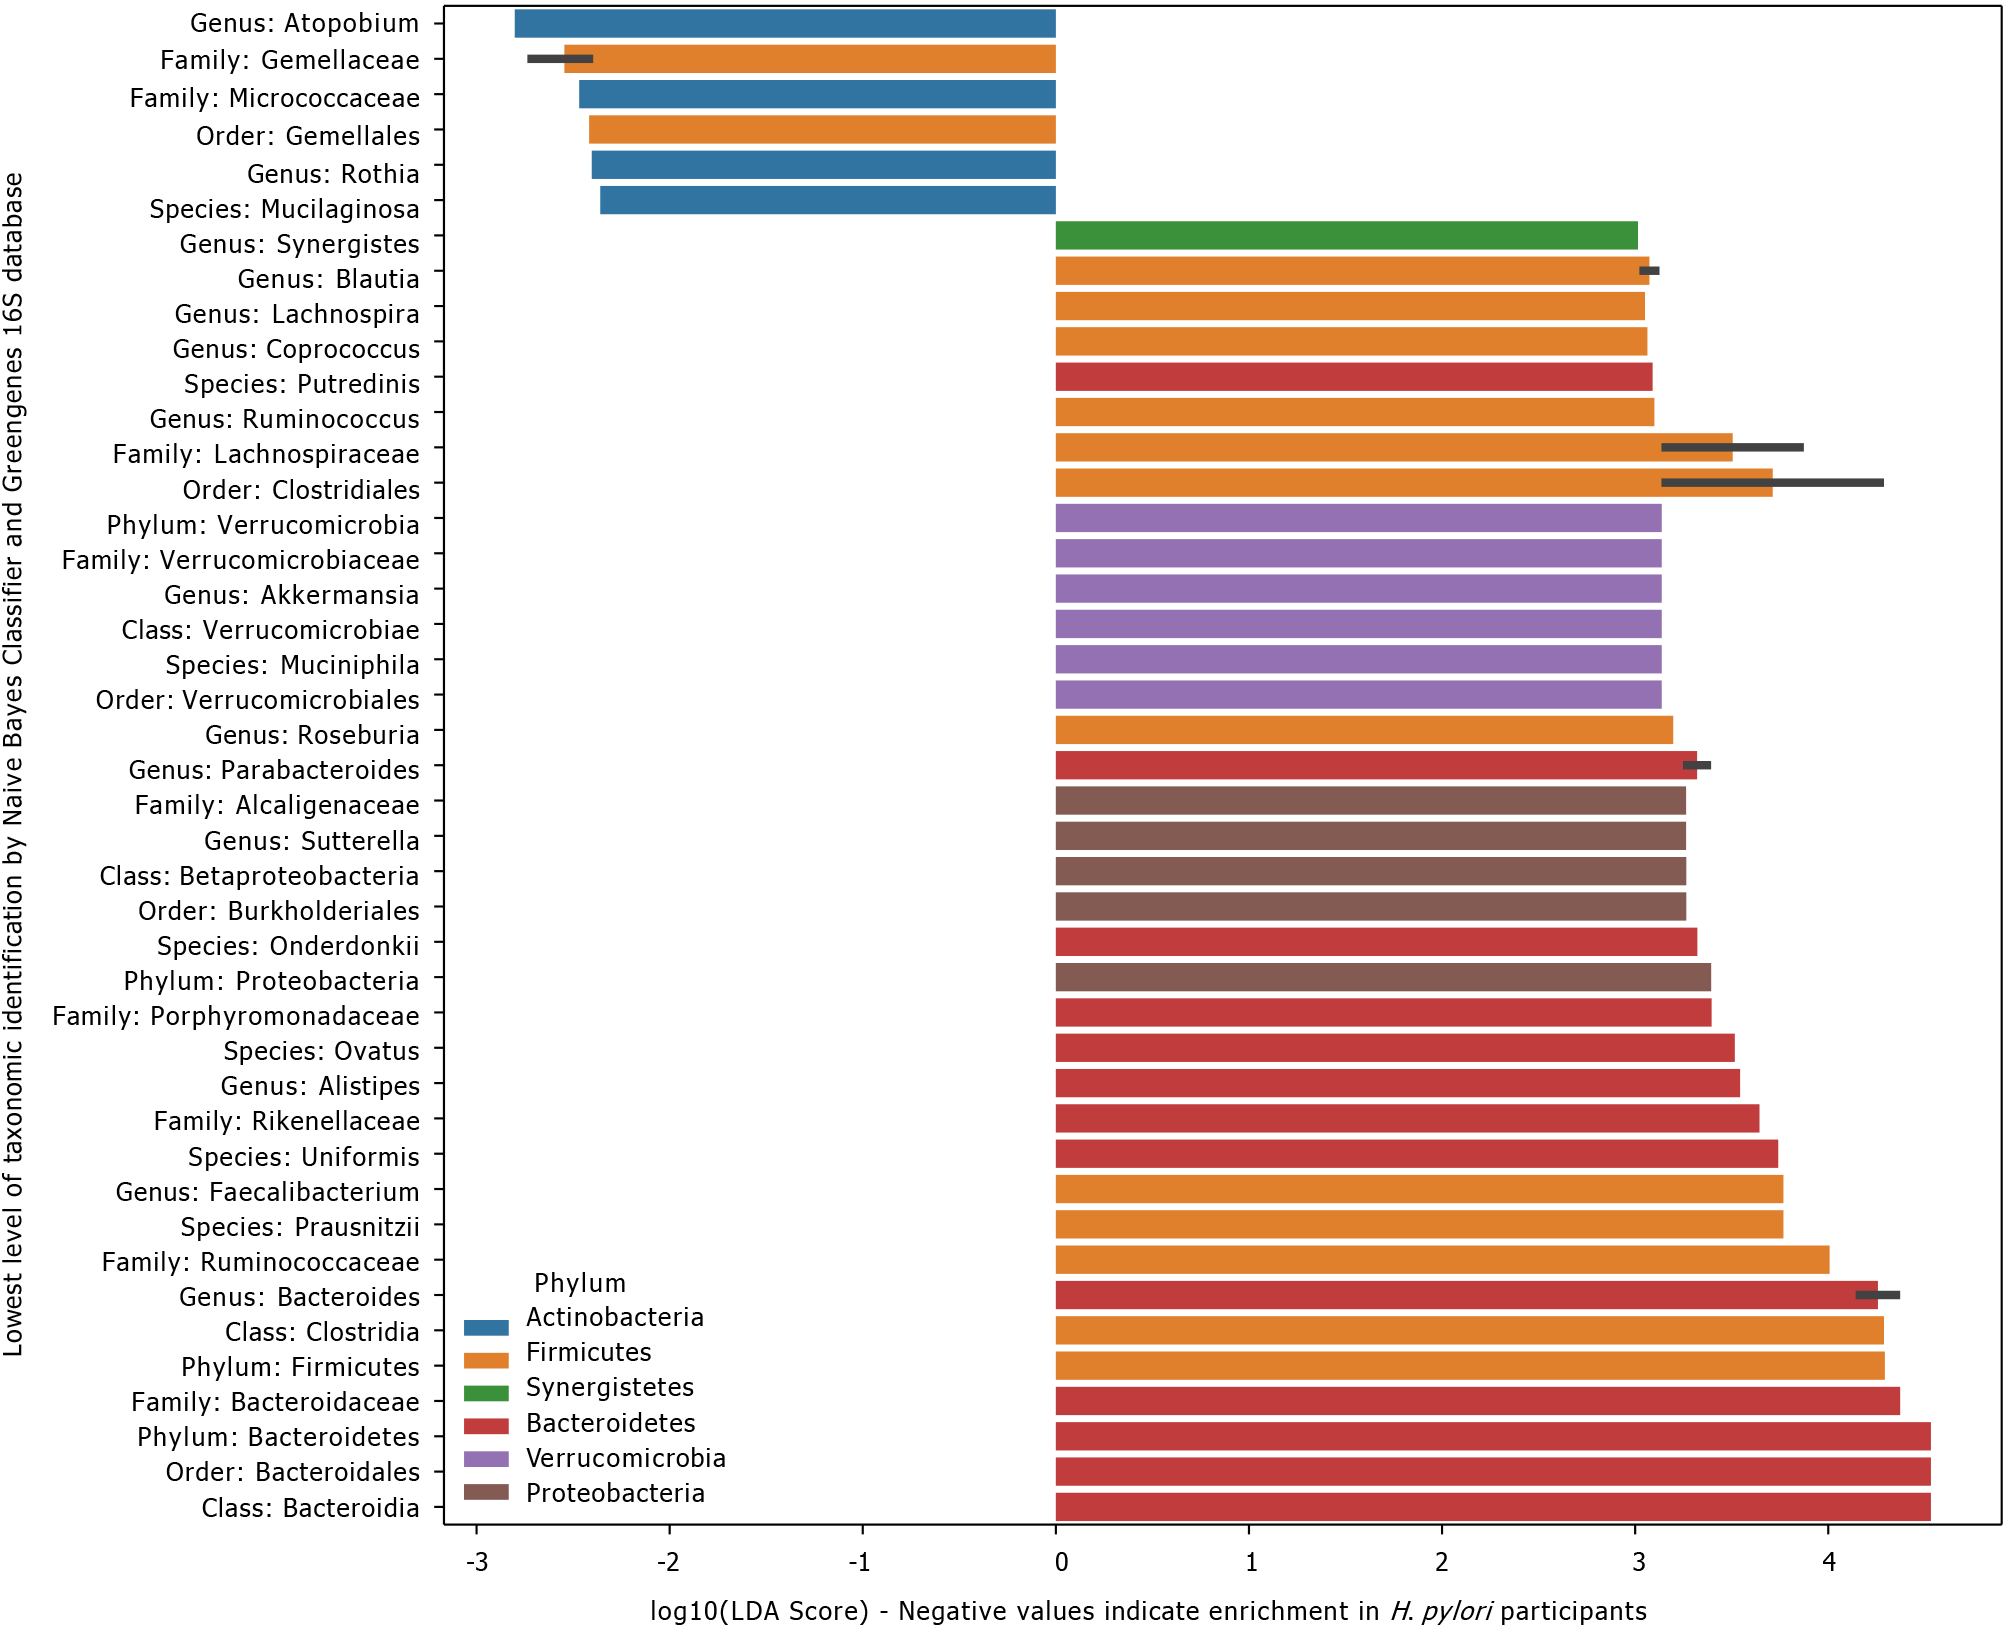
Figure 3 Linear discriminant analysis effect size scores for taxa enriched in Helicobacter pylori or control participants.
Linear discriminant analysis effect size (LEfSe) scores for taxa that were differentially distributed across Helicobacter pylori (H. pylori) patients (n = 19) vs control subjects (n = 16) via Kruskal-Wallis and Wilcoxon tests with two-tailed α = 0.05. Negative values represent taxa that were enriched in H. pylori patients, whereas positive values represent taxa that were enriched in control subjects. Error bars represent a 95% confidence interval and are only present if the listed taxonomic identity was the lowest level classified for multiple operational taxonomic units highlighted by LEfSe. Color represents the phylum. H. pylori: Helicobacter pylori.
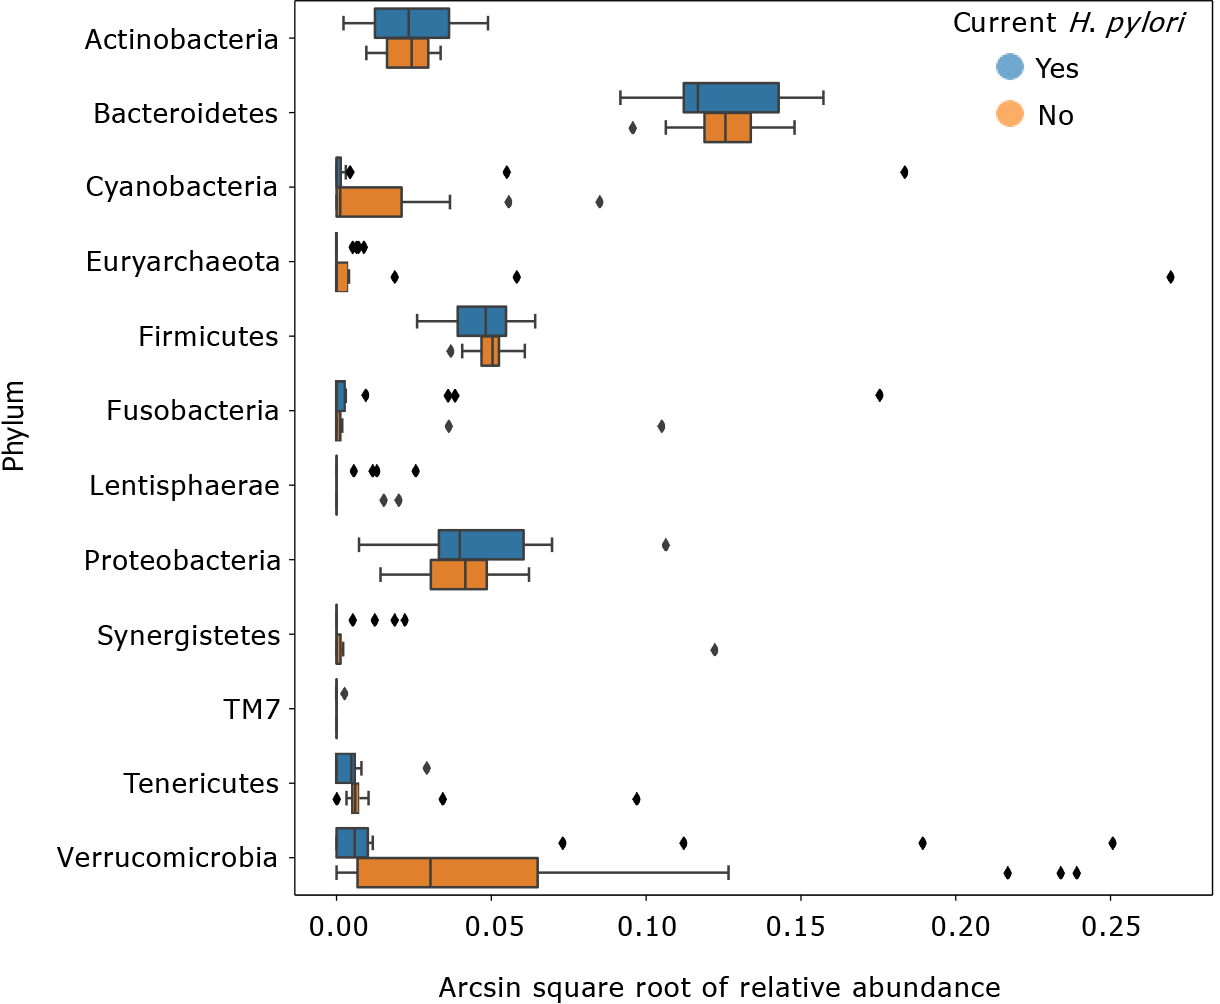
Figure 4 Transformed relative abundances of phyla grouped by Helicobacter pylori infection.
Arcsin square root transformed relative abundances of each phylum, grouped by Helicobacter pylori (H. pylori) status. Bacterial relative abundances of H. pylori patients (n = 19) are shown in blue, whereas healthy controls (n = 16) are shown in orange. Boxes represent the 1st and 3rd quartiles, and vertical lines in the middle of the boxes represent median values. Whiskers represent the lowest and highest non-outlier values. Points show outliers, which were determined by having a distance from the 1st or 3rd quartile greater than 1.5 times the interquartile range. Of note, relative abundances of Verrucomicrobia were significantly lower in H. pylori patients compared to healthy controls (Kruskal-Wallis H = 4.455, P = 0.034). H. pylori: Helicobacter pylori.
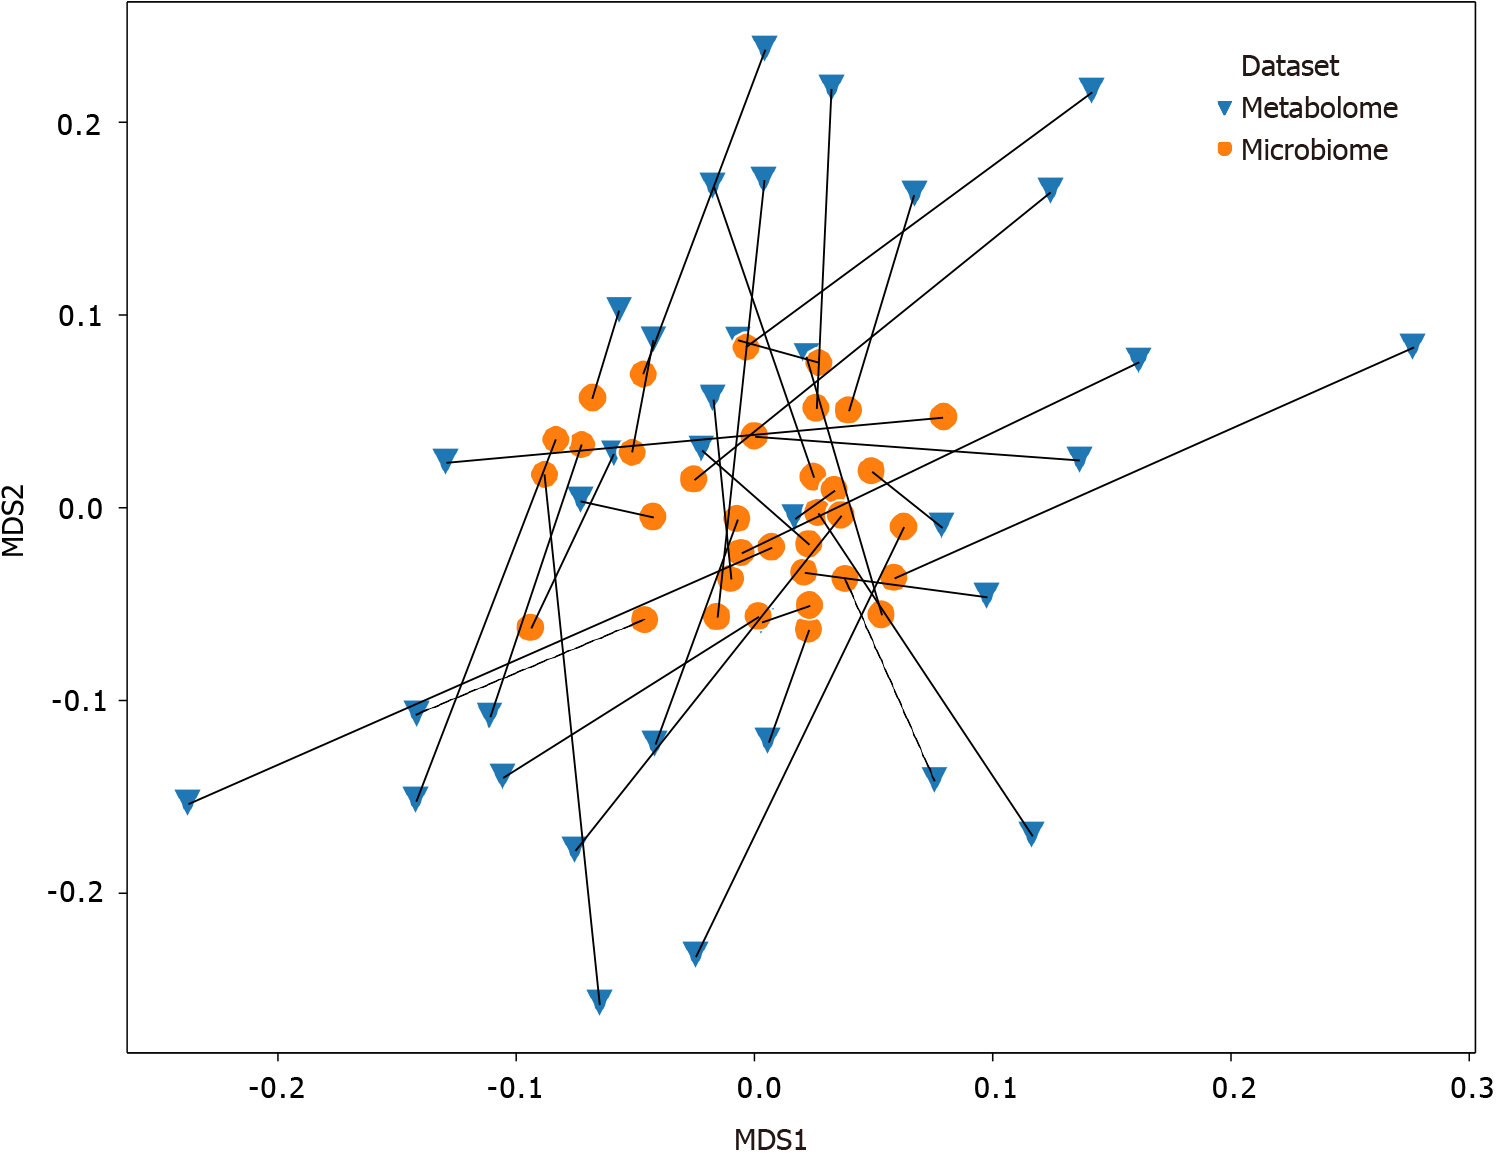
Figure 5 Procrustes-transformed Bray-Curtis multi-dimensional scaling of microbiome and metabolome.
Connections between the fecal microbiome and fecal metabolome Bray-Curtis multi-dimensional scaling plots. The microbiome data shown here have been transformed by the Procrustes analysis to minimize disparity between the two datasets, and lines have been drawn to indicate microbiome and metabolome from the same participants. Orange dots represent the microbiomes, whereas blue triangles represent the metabolomes. The Procrustes randomization test showed a significant relationship between the datasets (m2 = 0.86, P = 0.017). MDS: Multi-dimensional scaling.
Figure 6 Volcano plots of composition of evaluated fatty acids.
A: Control vs entire Helicobacter pylori (H. pylori) patient group; B: Control vs sub-group of H. pylori patients identified as having high ratio of Bacteroidetes to Firmicutes (n = 7 of 19 patients); C: Control vs sub-group of H. pylori patients identified as having high ratio of Firmicutes to Bacteroidetes (n = 4 of 19 patients). Selected long-chain fatty acids (green), monounsaturated fatty acids (blue) and polyunsaturated fatty acids (red) are highlighted. H. pylori: Helicobacter pylori.
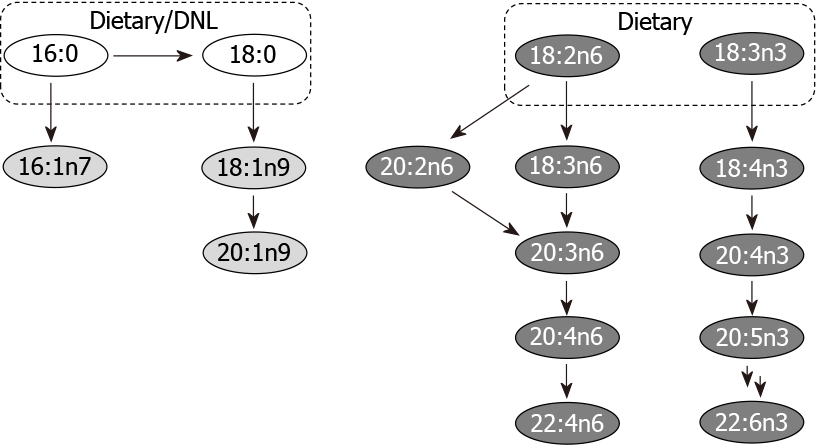
Figure 7 Major metabolic pathways.
Selected long-chain fatty acids (no fill), monounsaturated fatty acids (light grey fill) and polyunsaturated fatty acids (dark grey fill) are highlighted. Although many of the fatty acids shown may be supplemented by diet, key parent members of these pathways acquired from de novo lipogenesis and/or diet are indicated. DNL: De novo lipogenesis.
- Citation: White B, Sterrett JD, Grigoryan Z, Lally L, Heinze JD, Alikhan H, Lowry CA, Perez LJ, DeSipio J, Phadtare S. Characterization of gut microbiome and metabolome in Helicobacter pylori patients in an underprivileged community in the United States. World J Gastroenterol 2021; 27(33): 5575-5594
- URL: https://www.wjgnet.com/1007-9327/full/v27/i33/5575.htm
- DOI: https://dx.doi.org/10.3748/wjg.v27.i33.5575


