Copyright
©The Author(s) 2021.
World J Gastroenterol. Aug 21, 2021; 27(31): 5259-5271
Published online Aug 21, 2021. doi: 10.3748/wjg.v27.i31.5259
Published online Aug 21, 2021. doi: 10.3748/wjg.v27.i31.5259
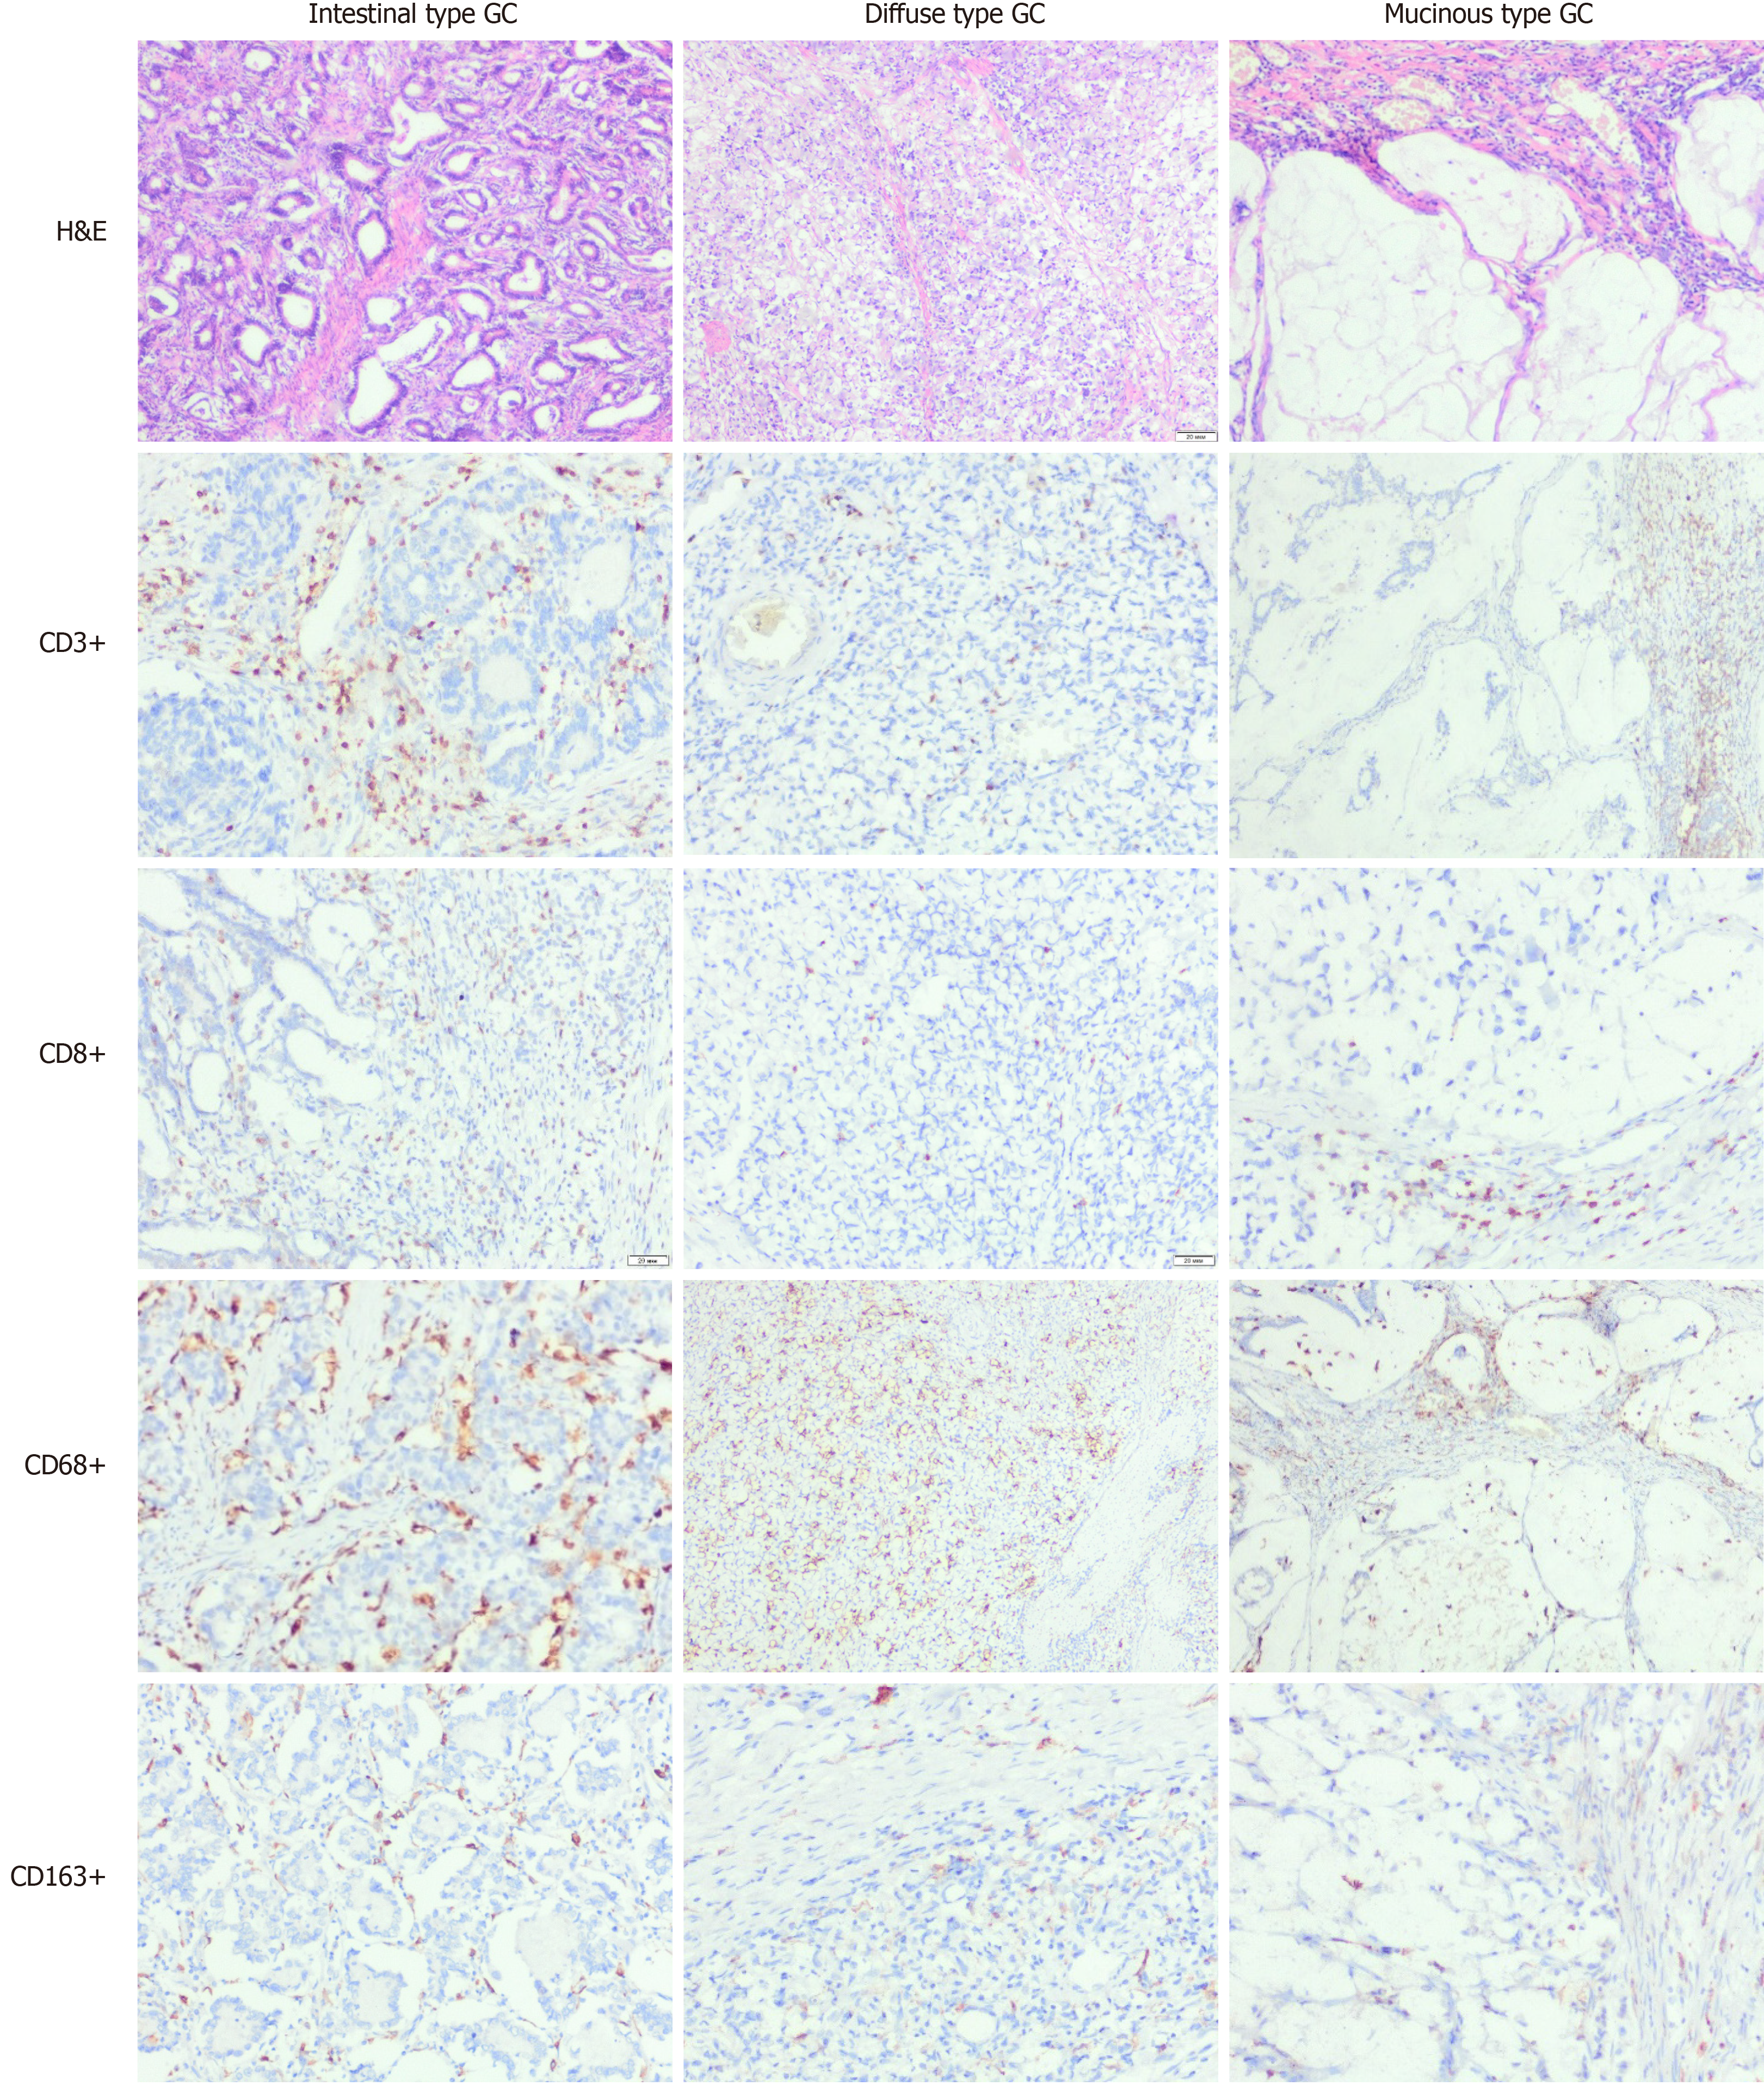
Figure 1 Density of immune cells in gastric carcinoma of different histological types.
H&E and immunohistochemistry (× 100). Figures demonstrate differences in infiltration of various histological type gastric carcinoma by immune cells, including entire population of T-lymphocytes (CD3), T-cytotoxic cells (CD8), M1 and M2 macrophages (CD68 and CD163 respectively). GC: Gastric carcinoma.
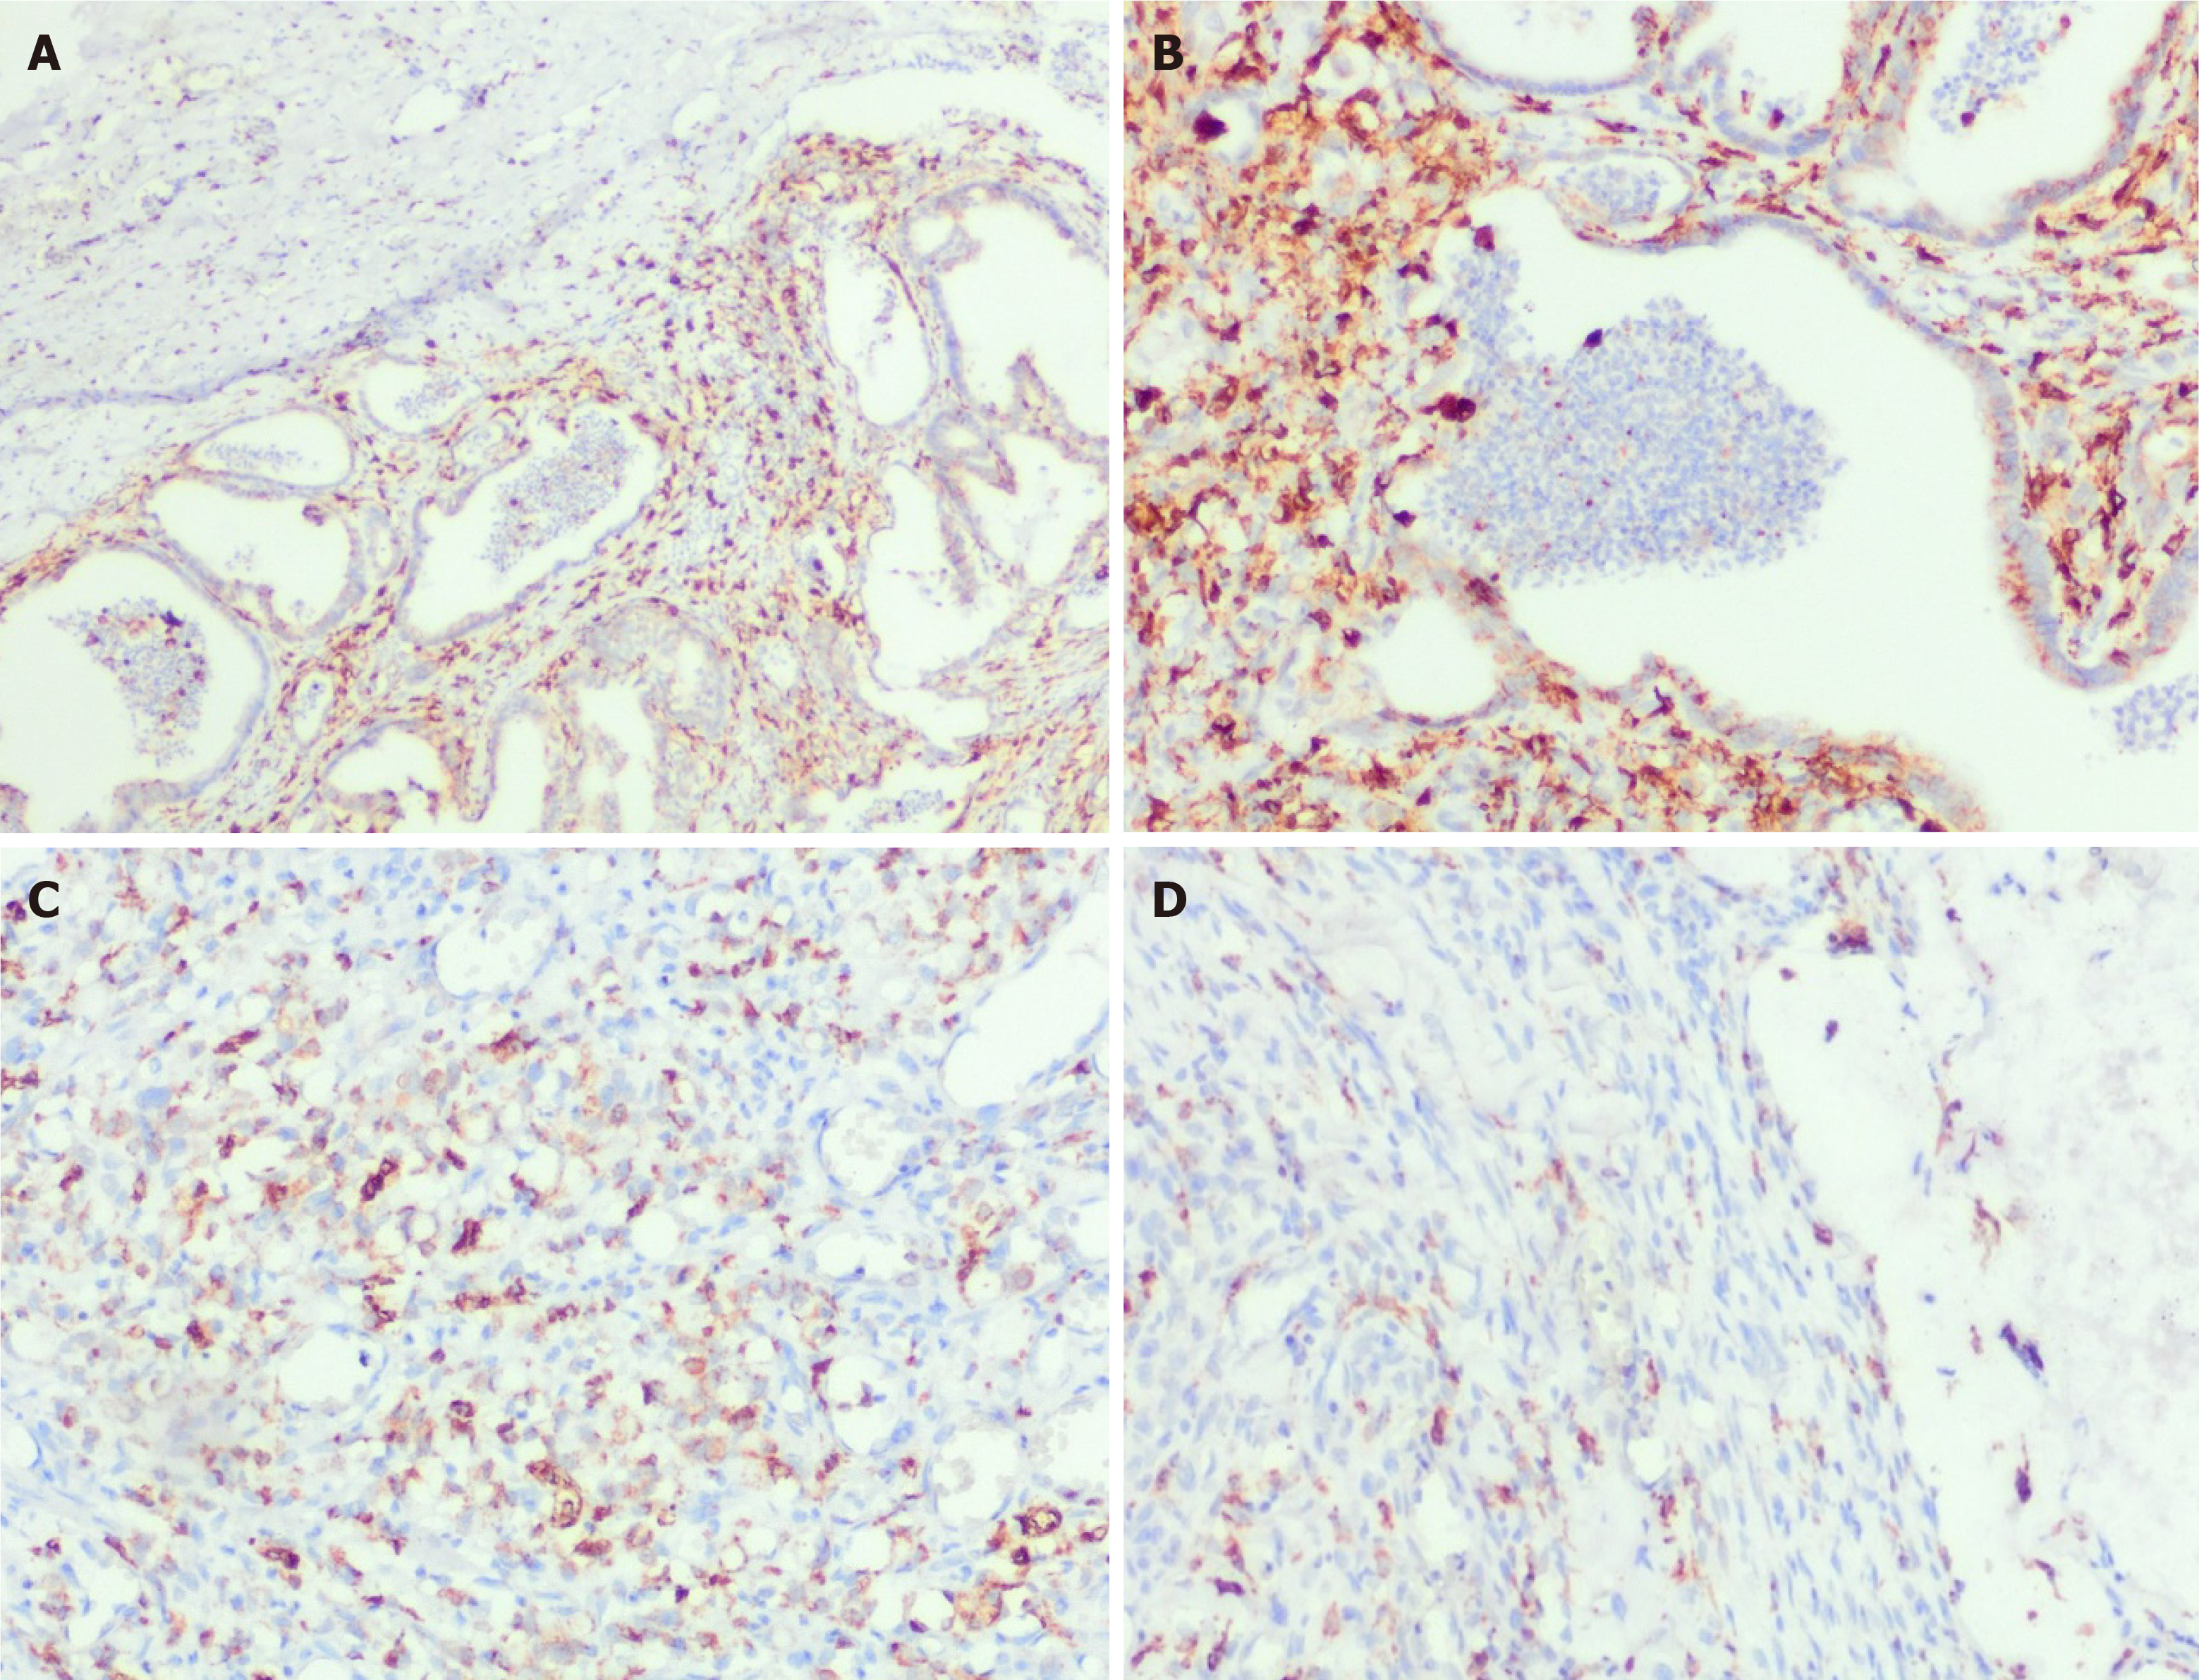
Figure 2 Density and spatial distribution of macrophages in gastric carcinoma of different histological types.
Immunohistochemistry for CD68. A and B: Intestinal type gastric carcinoma (GC) of inflamed tumor immune microenvironment (TIME) (A) with high count of CD68+ cells forming dense meshwork (B) inside the tumor. (A: × 100, B: × 200); C: High number of intratumor CD68+ cells of diffuse type GC of ID TIME, × 200; D: Prevalence of CD68+ cells in peritumor stroma of mucinous GC of IE TIME, × 200.
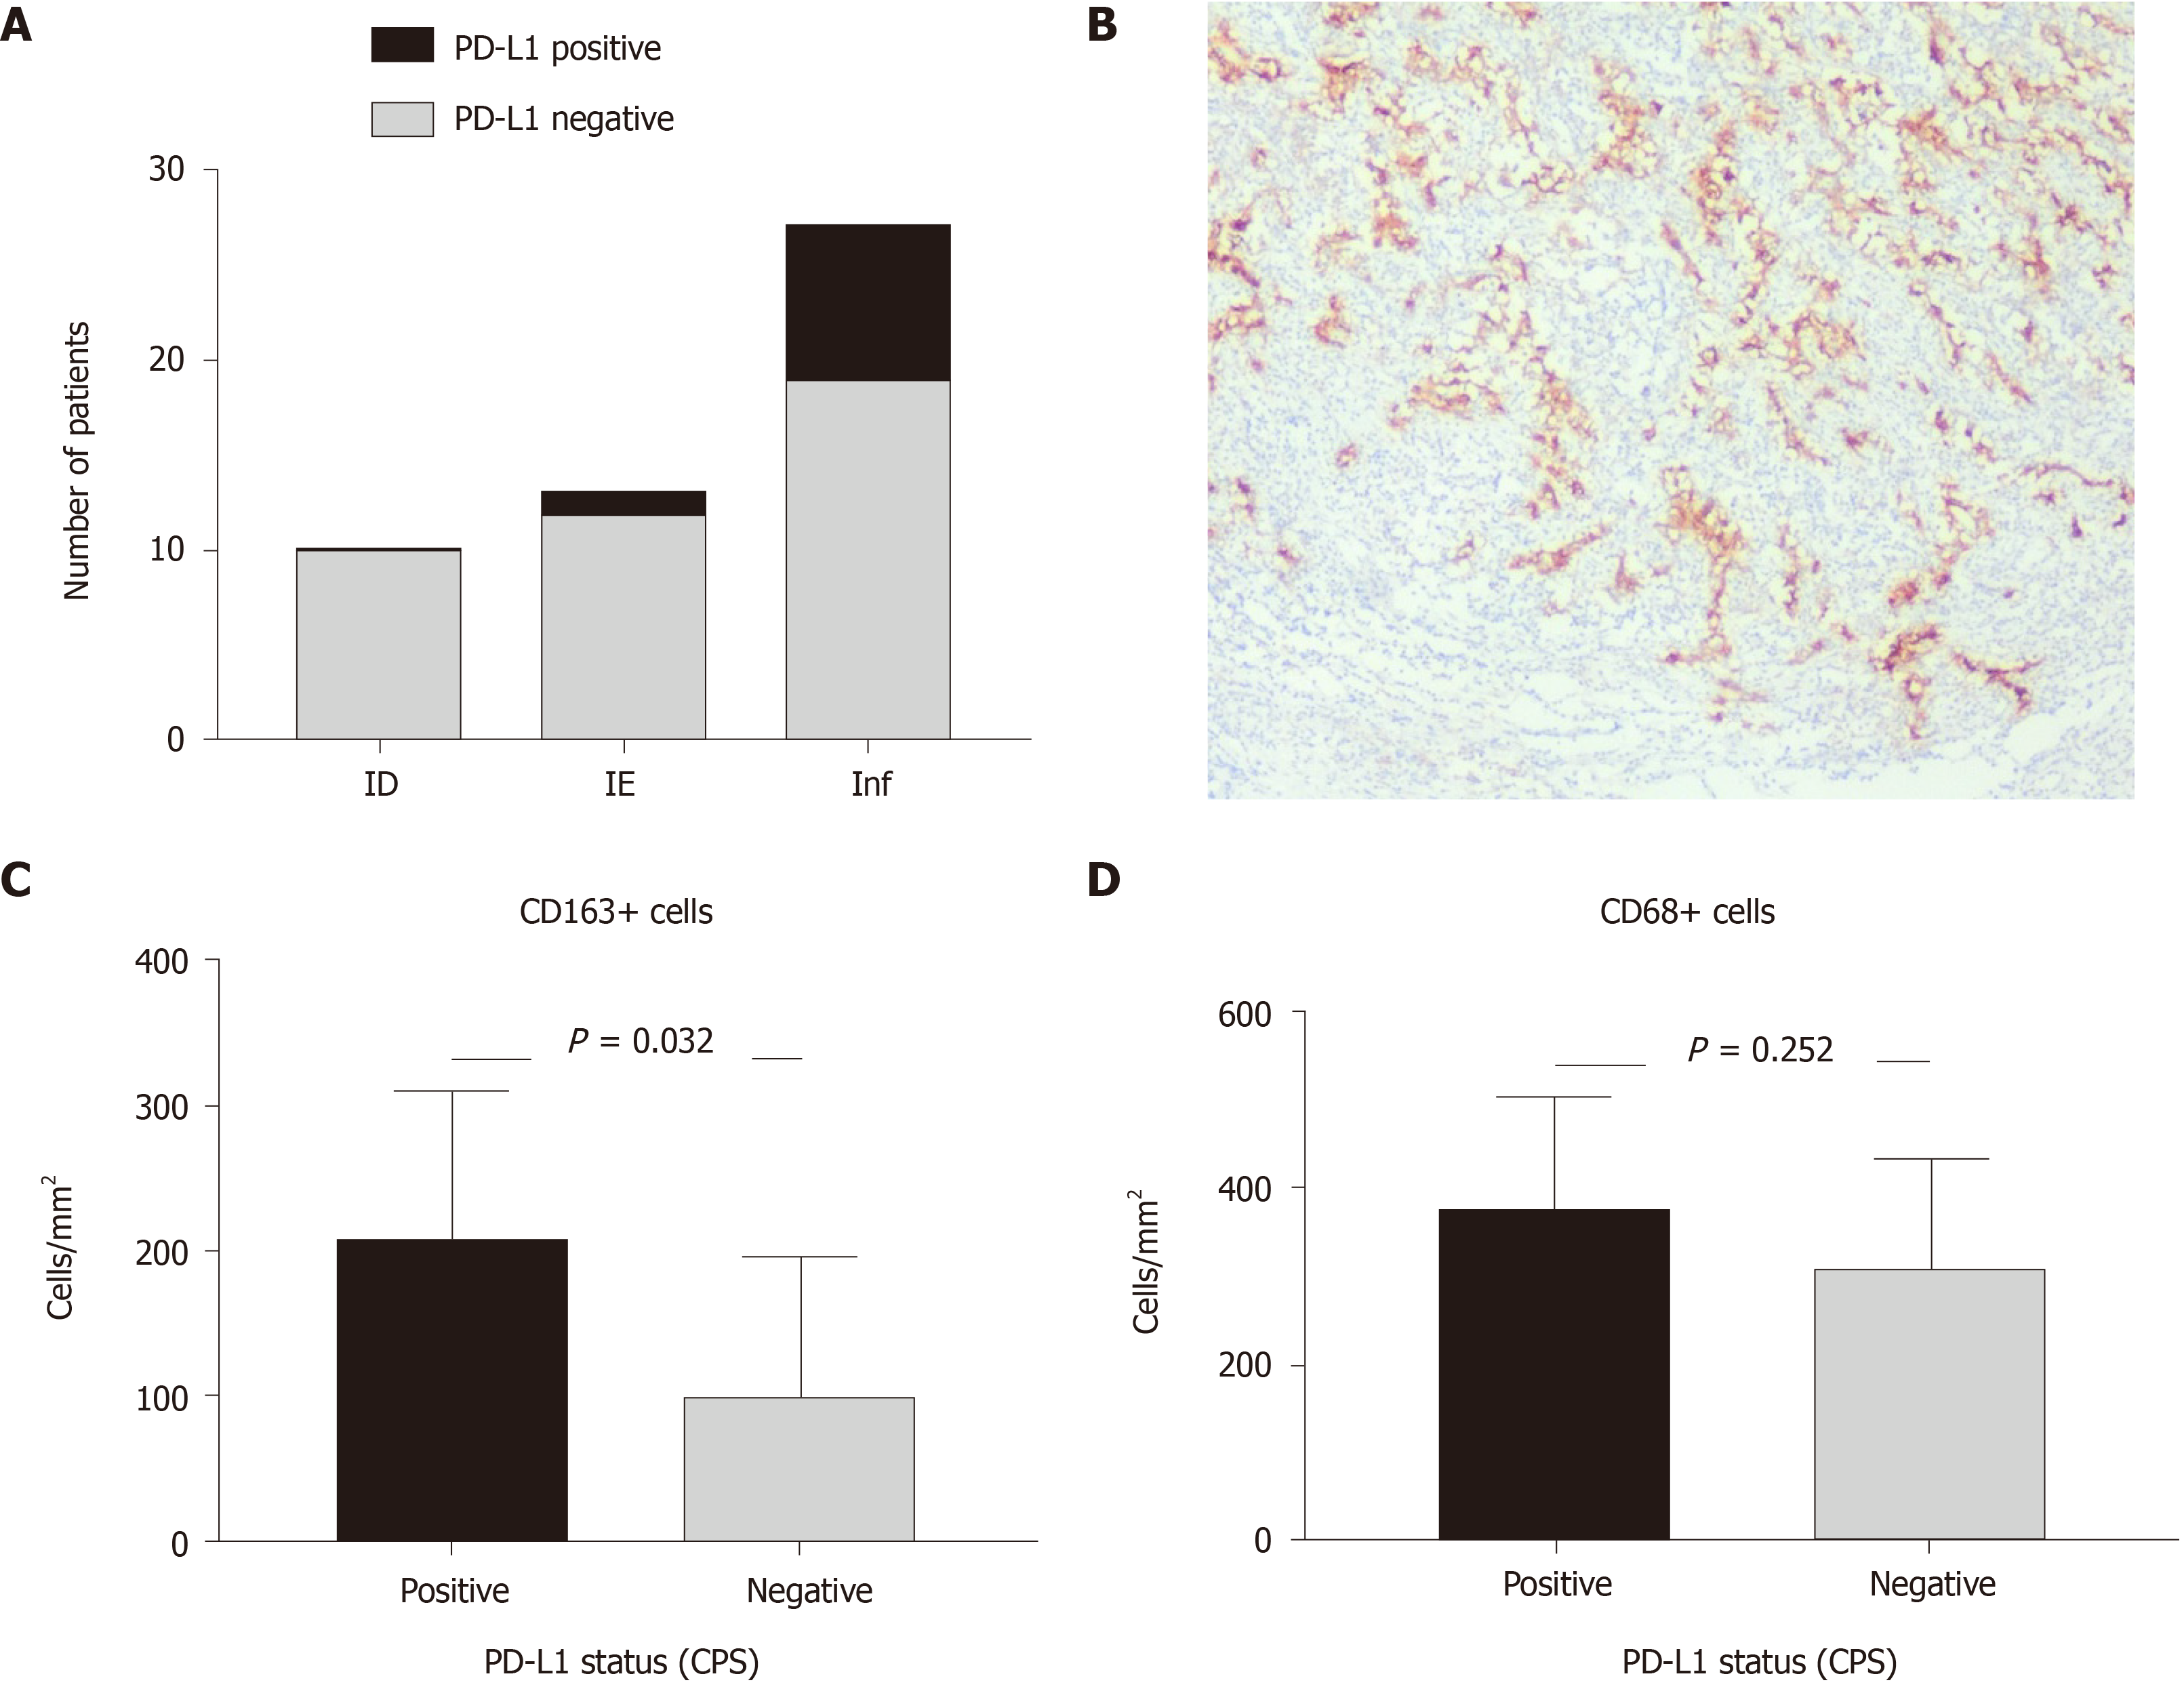
Figure 3 Relationship between programmed death-ligand 1 expression, gastric carcinoma immunophenotype and number of M1 and M2 macrophages.
A: Frequency of programmed death-ligand 1 (PD-L1) expression in gastric carcinoma (GC) of different tumor immune microenvironment (TIME); B: PD-L1 expression in tumor cells of Inflamed TIME GC, immunohistochemistry for PD-L1, × 50; C and D: number of M1 (C) and M2 (D)-macrophages in GC regarding PD-L1 expression. PD-L1: Programmed death-ligand 1; CPS: Combined positive score.
- Citation: Mashukov A, Shapochka D, Seleznov O, Kobyliak N, Falalyeyeva T, Kirkilevsky S, Yarema R, Sulaieva O. Histological differentiation impacts the tumor immune microenvironment in gastric carcinoma: Relation to the immune cycle. World J Gastroenterol 2021; 27(31): 5259-5271
- URL: https://www.wjgnet.com/1007-9327/full/v27/i31/5259.htm
- DOI: https://dx.doi.org/10.3748/wjg.v27.i31.5259


