Copyright
©The Author(s) 2021.
World J Gastroenterol. Aug 14, 2021; 27(30): 5076-5087
Published online Aug 14, 2021. doi: 10.3748/wjg.v27.i30.5076
Published online Aug 14, 2021. doi: 10.3748/wjg.v27.i30.5076
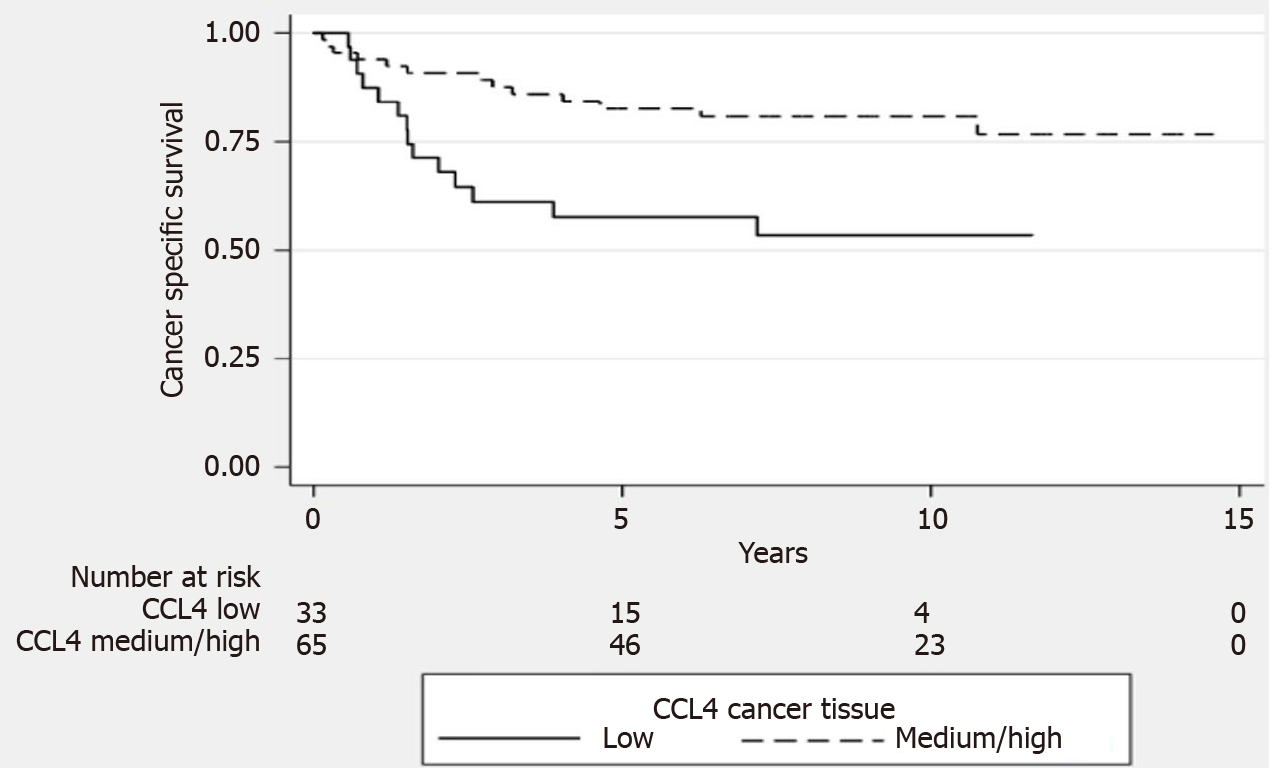
Figure 1 Kaplan-Meier curves between expression levels of CC chemokine ligand 4 protein grouped into tertiles (low and medium/high) and cancer-specific survival rates in colorectal cancer patients.
CCL4: CC chemokine ligand 4.
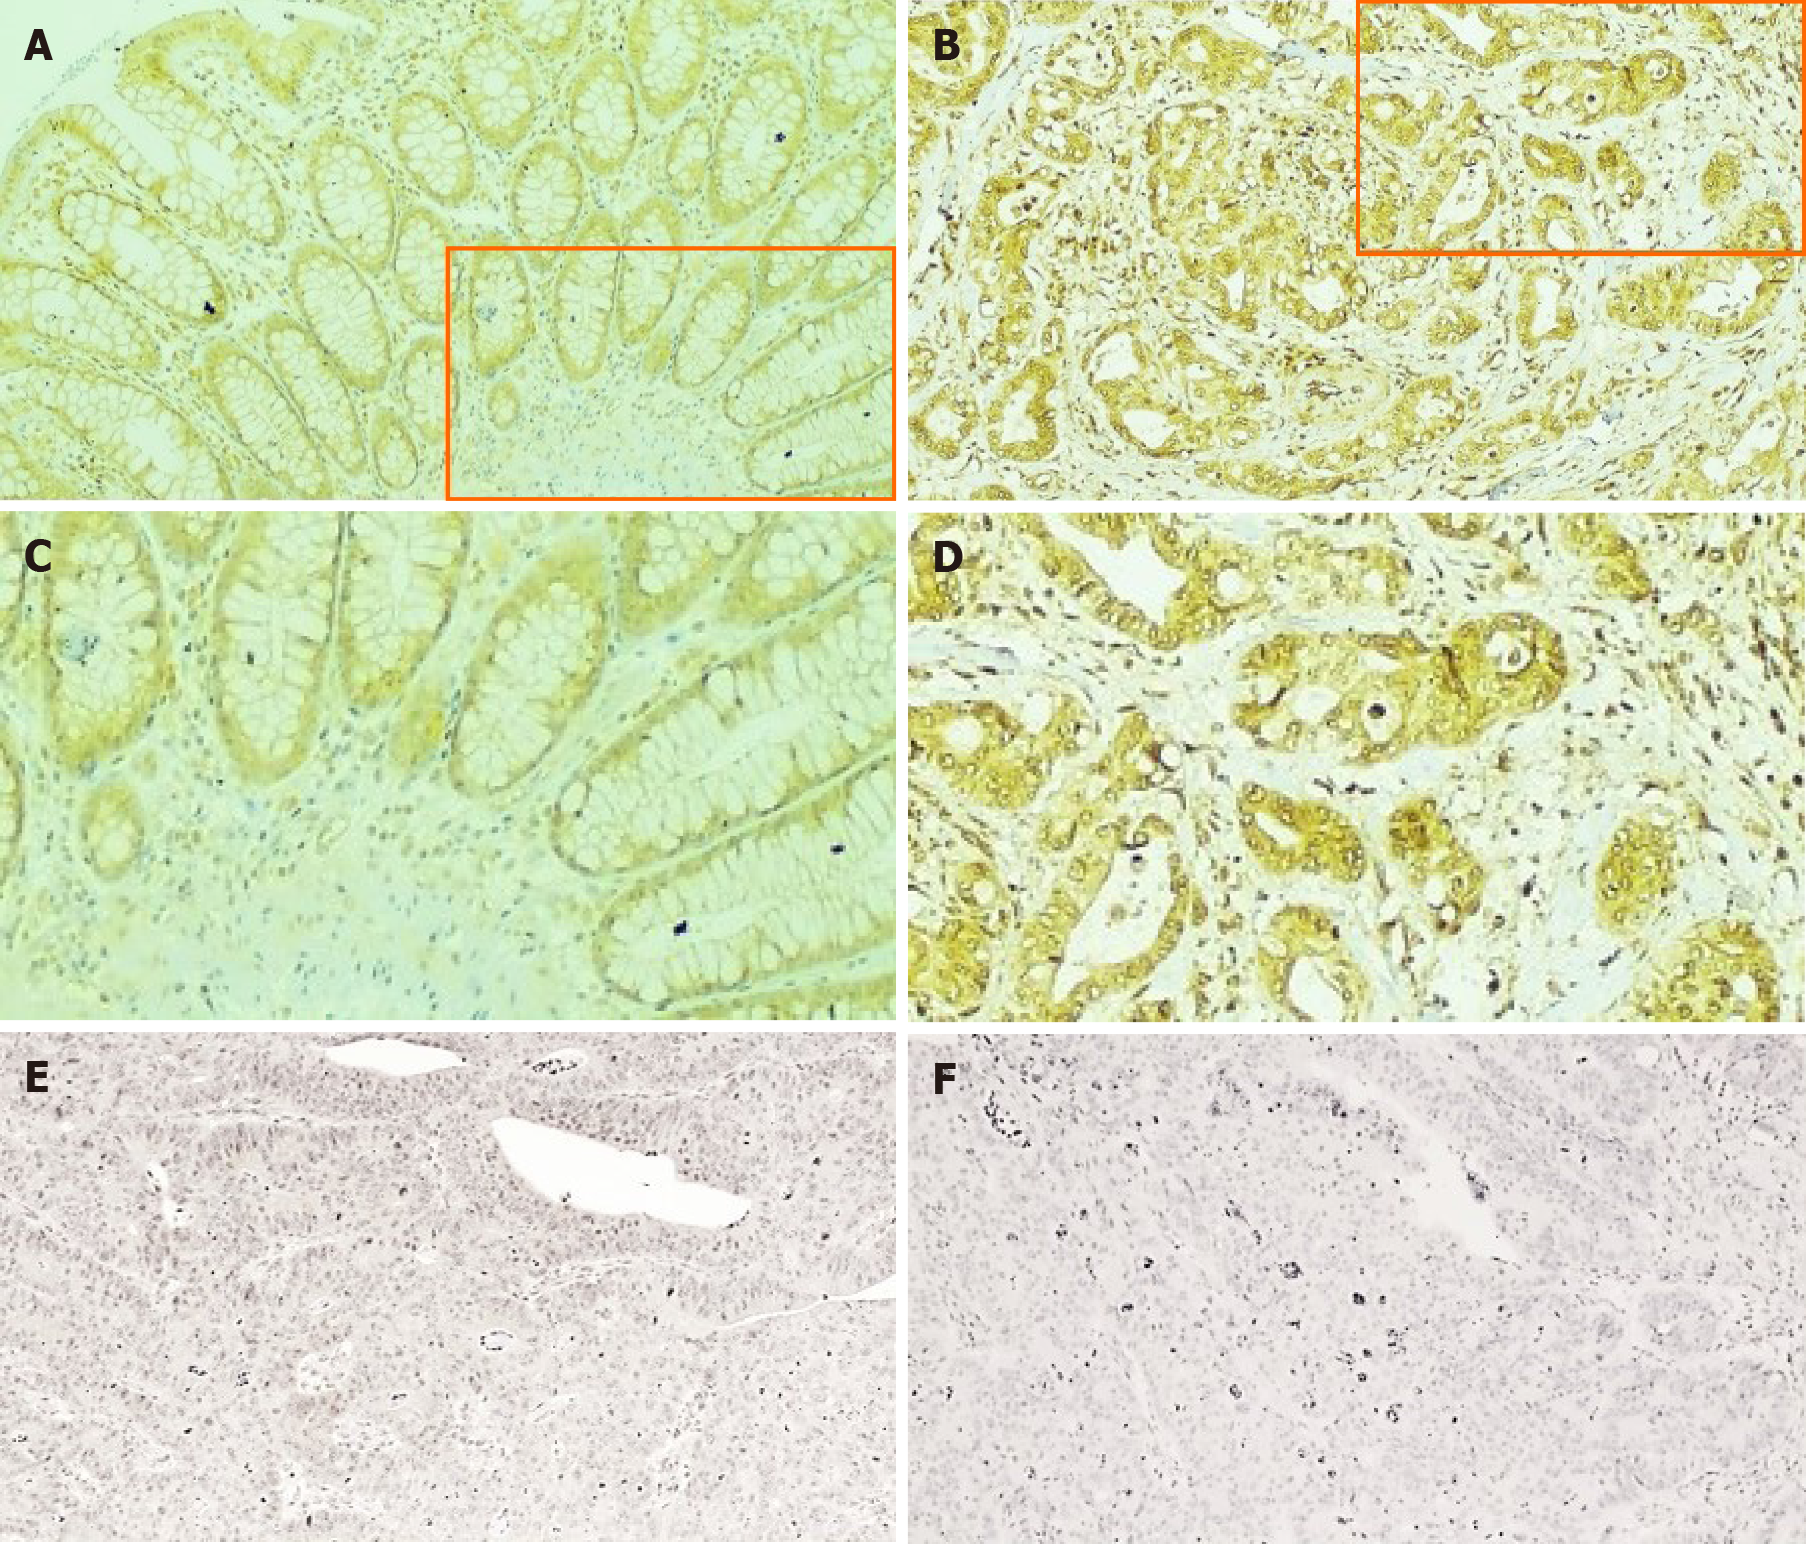
Figure 2 Representative immunohistochemical staining of CC chemokine ligand 4.
A: Normal tissue (× 100 magnification); B: Colon cancer tissue (× 100 magnification); C: Normal tissue (× 400 magnification) of highlighted area; D: Colon cancer tissue (× 400 magnification) of highlighted area; E: Isotype control antibody in colon cancer tissue (× 100 magnification); F: Primary antibody omitted in colon cancer tissue (× 100 magnification).
- Citation: Shamoun L, Landerholm K, Balboa Ramilo A, Andersson RE, Dimberg J, Wågsäter D. Association of gene and protein expression and genetic polymorphism of CC chemokine ligand 4 in colorectal cancer. World J Gastroenterol 2021; 27(30): 5076-5087
- URL: https://www.wjgnet.com/1007-9327/full/v27/i30/5076.htm
- DOI: https://dx.doi.org/10.3748/wjg.v27.i30.5076


