Copyright
©The Author(s) 2021.
World J Gastroenterol. Aug 14, 2021; 27(30): 4999-5018
Published online Aug 14, 2021. doi: 10.3748/wjg.v27.i30.4999
Published online Aug 14, 2021. doi: 10.3748/wjg.v27.i30.4999
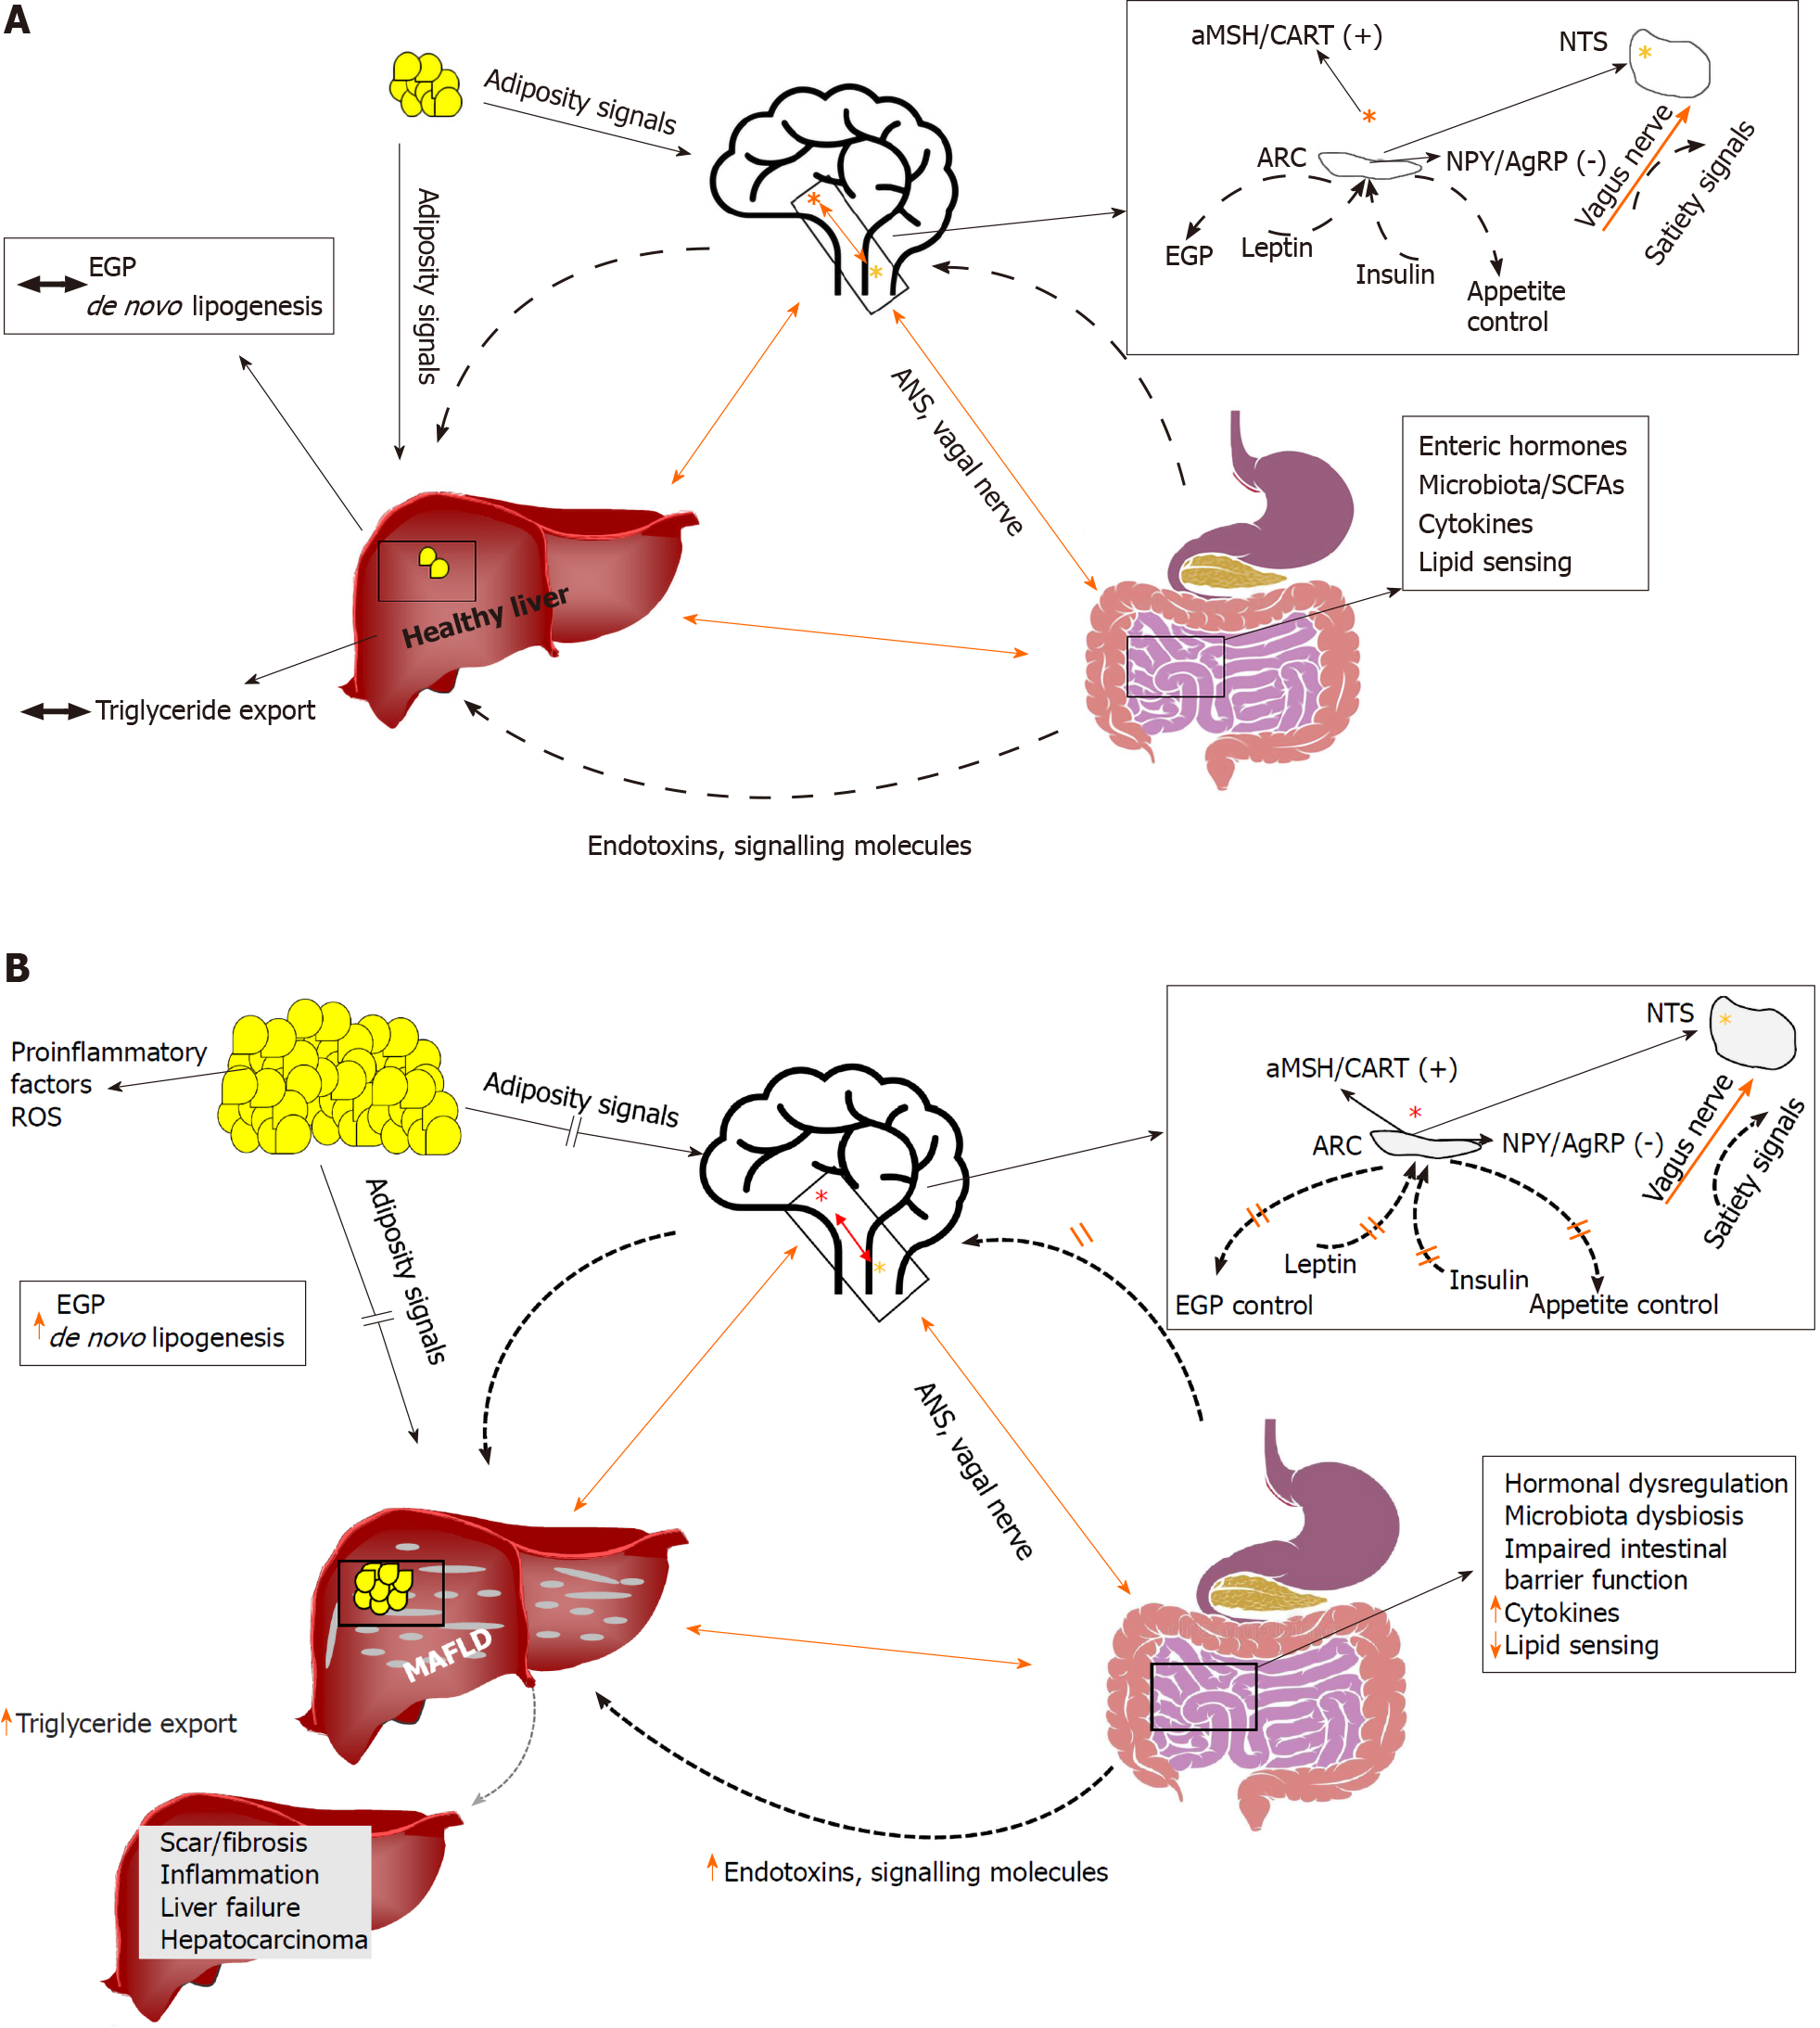
Figure 1 A summary of some interactions (A) of the brain, liver, and gut in health, and (B) in the context of insulin resistance.
Several lines of research have shown that the brain may directly control endogenous glucose production. Recent evidence suggests that the brain may also control the rate of lipid turnover in the liver, thus promoting or defending from metabolic associated fatty liver disease (MAFLD). The liver is anatomically in close relationship to the gut, which represents the first line of defense against gut-derived endotoxins and signaling molecules (e.g., short-chain fatty acids). Altered gut microbiota and/or a leaky gut may contribute directly to establishment of MAFLD. The gut also produces substantial amounts of hormones that, through endocrine signals, act on the brain and the liver. The autonomic nervous system and the vagus nerve constitute the basis of the brain, gut and liver axis interconnections. Orange line: liver–brain–gut neural arc; dotted line: other ways of communication (e.g., hormonal, adipocytokines). Red star denotes the hypothalamic nuclei; yellow star denotes the nucleus tractus solitaries. αMSH: α-melanocyte-stimulating hormone; AgRP: Agouti-related protein; ANS: Autonomous nervous system; ARC: Arcuate nucleus; CART: Cocaine- and amphetamine-regulated transcript; EGP: Endogenous glucose production; MAFLD: Metabolic associated fatty liver disease; NPY: Neuropeptide Y; NTS: Nucleus tractus solitarius; ROS: Reactive oxygen species; SCF: Short-chain fatty acid.
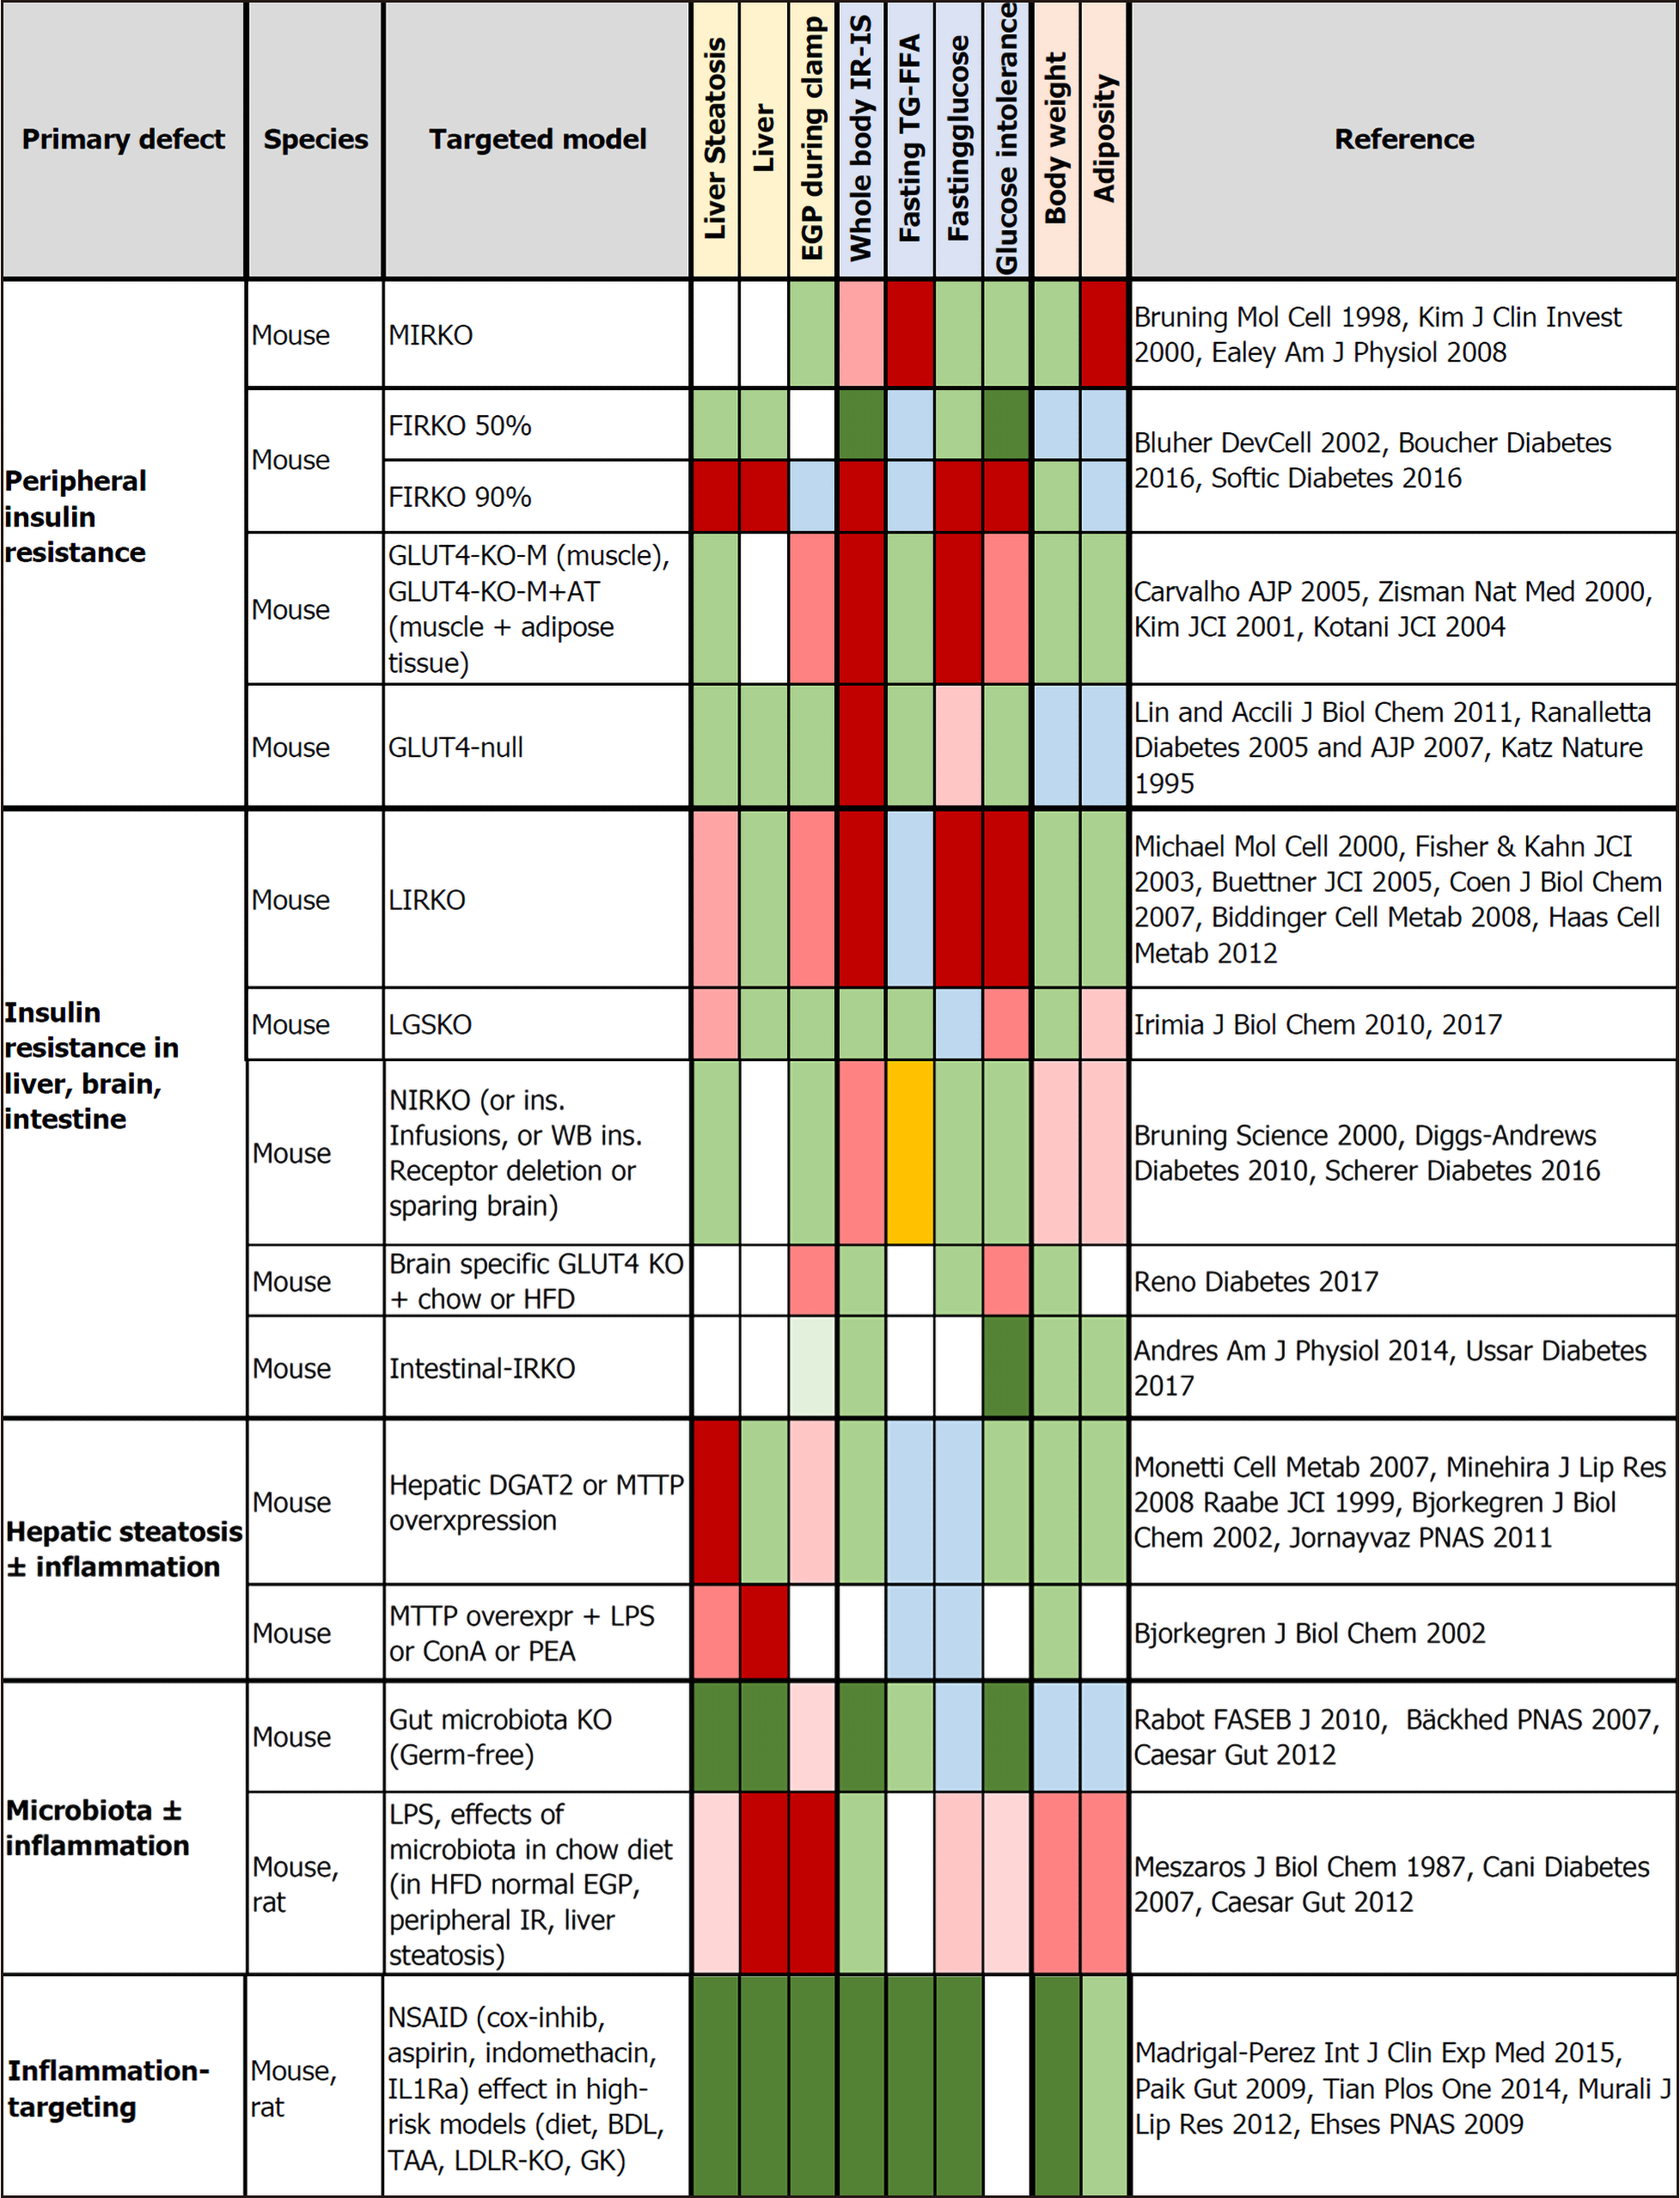
Figure 2 Tissue-targeted animal models evaluating the independent effects of tissue-specific insulin receptor knockout, or GLUT4 knockout, or the induction of steatosis or inflammation on metabolic outcomes, including liver steatosis, endogenous glucose production, glucose tolerance, and body weight.
Negative effects are shown in red and abnormalities reported as mild-moderate or not consistent in all studies in light red. Beneficial effects (dark) or no effect (light) are shown in green. Orange indicates opposite (high vs low) findings between studies. Light blue refers to a decrease that cannot be unequivocally interpreted as being beneficial or adverse to health. BDL: Bile duct ligation; ConA: Concanavalin A; DGAT2: Diacylglycerol O-acyltransferase 2; FFA: Free fatty acids; FIRKO: Fat-specific insulin receptor knockout; GK: Goto-Kakizaki; HFD: High-fat diet; IL-Ra: Interleukin-1 receptor antagonist; IR: Insulin resistance; IRKO: Insulin receptor knockout; KO: Knockout; LDLR-KO: Low-density lipoprotein cholesterol receptor knockout; LIRKO: Liver-specific insulin receptor knockout; LGSKO: Liver glycogen synthase knockout; LPS: Lipopolysaccharide; MIRKO: Muscle-specific insulin receptor knockout; MTTP: Microsomal triglyceride transfer protein; NIRKO: Brain-specific deletion of the insulin receptor; PEA: P. aeruginosa exotoxin A; TAA: Thioacetamide; TG: Triglycerides
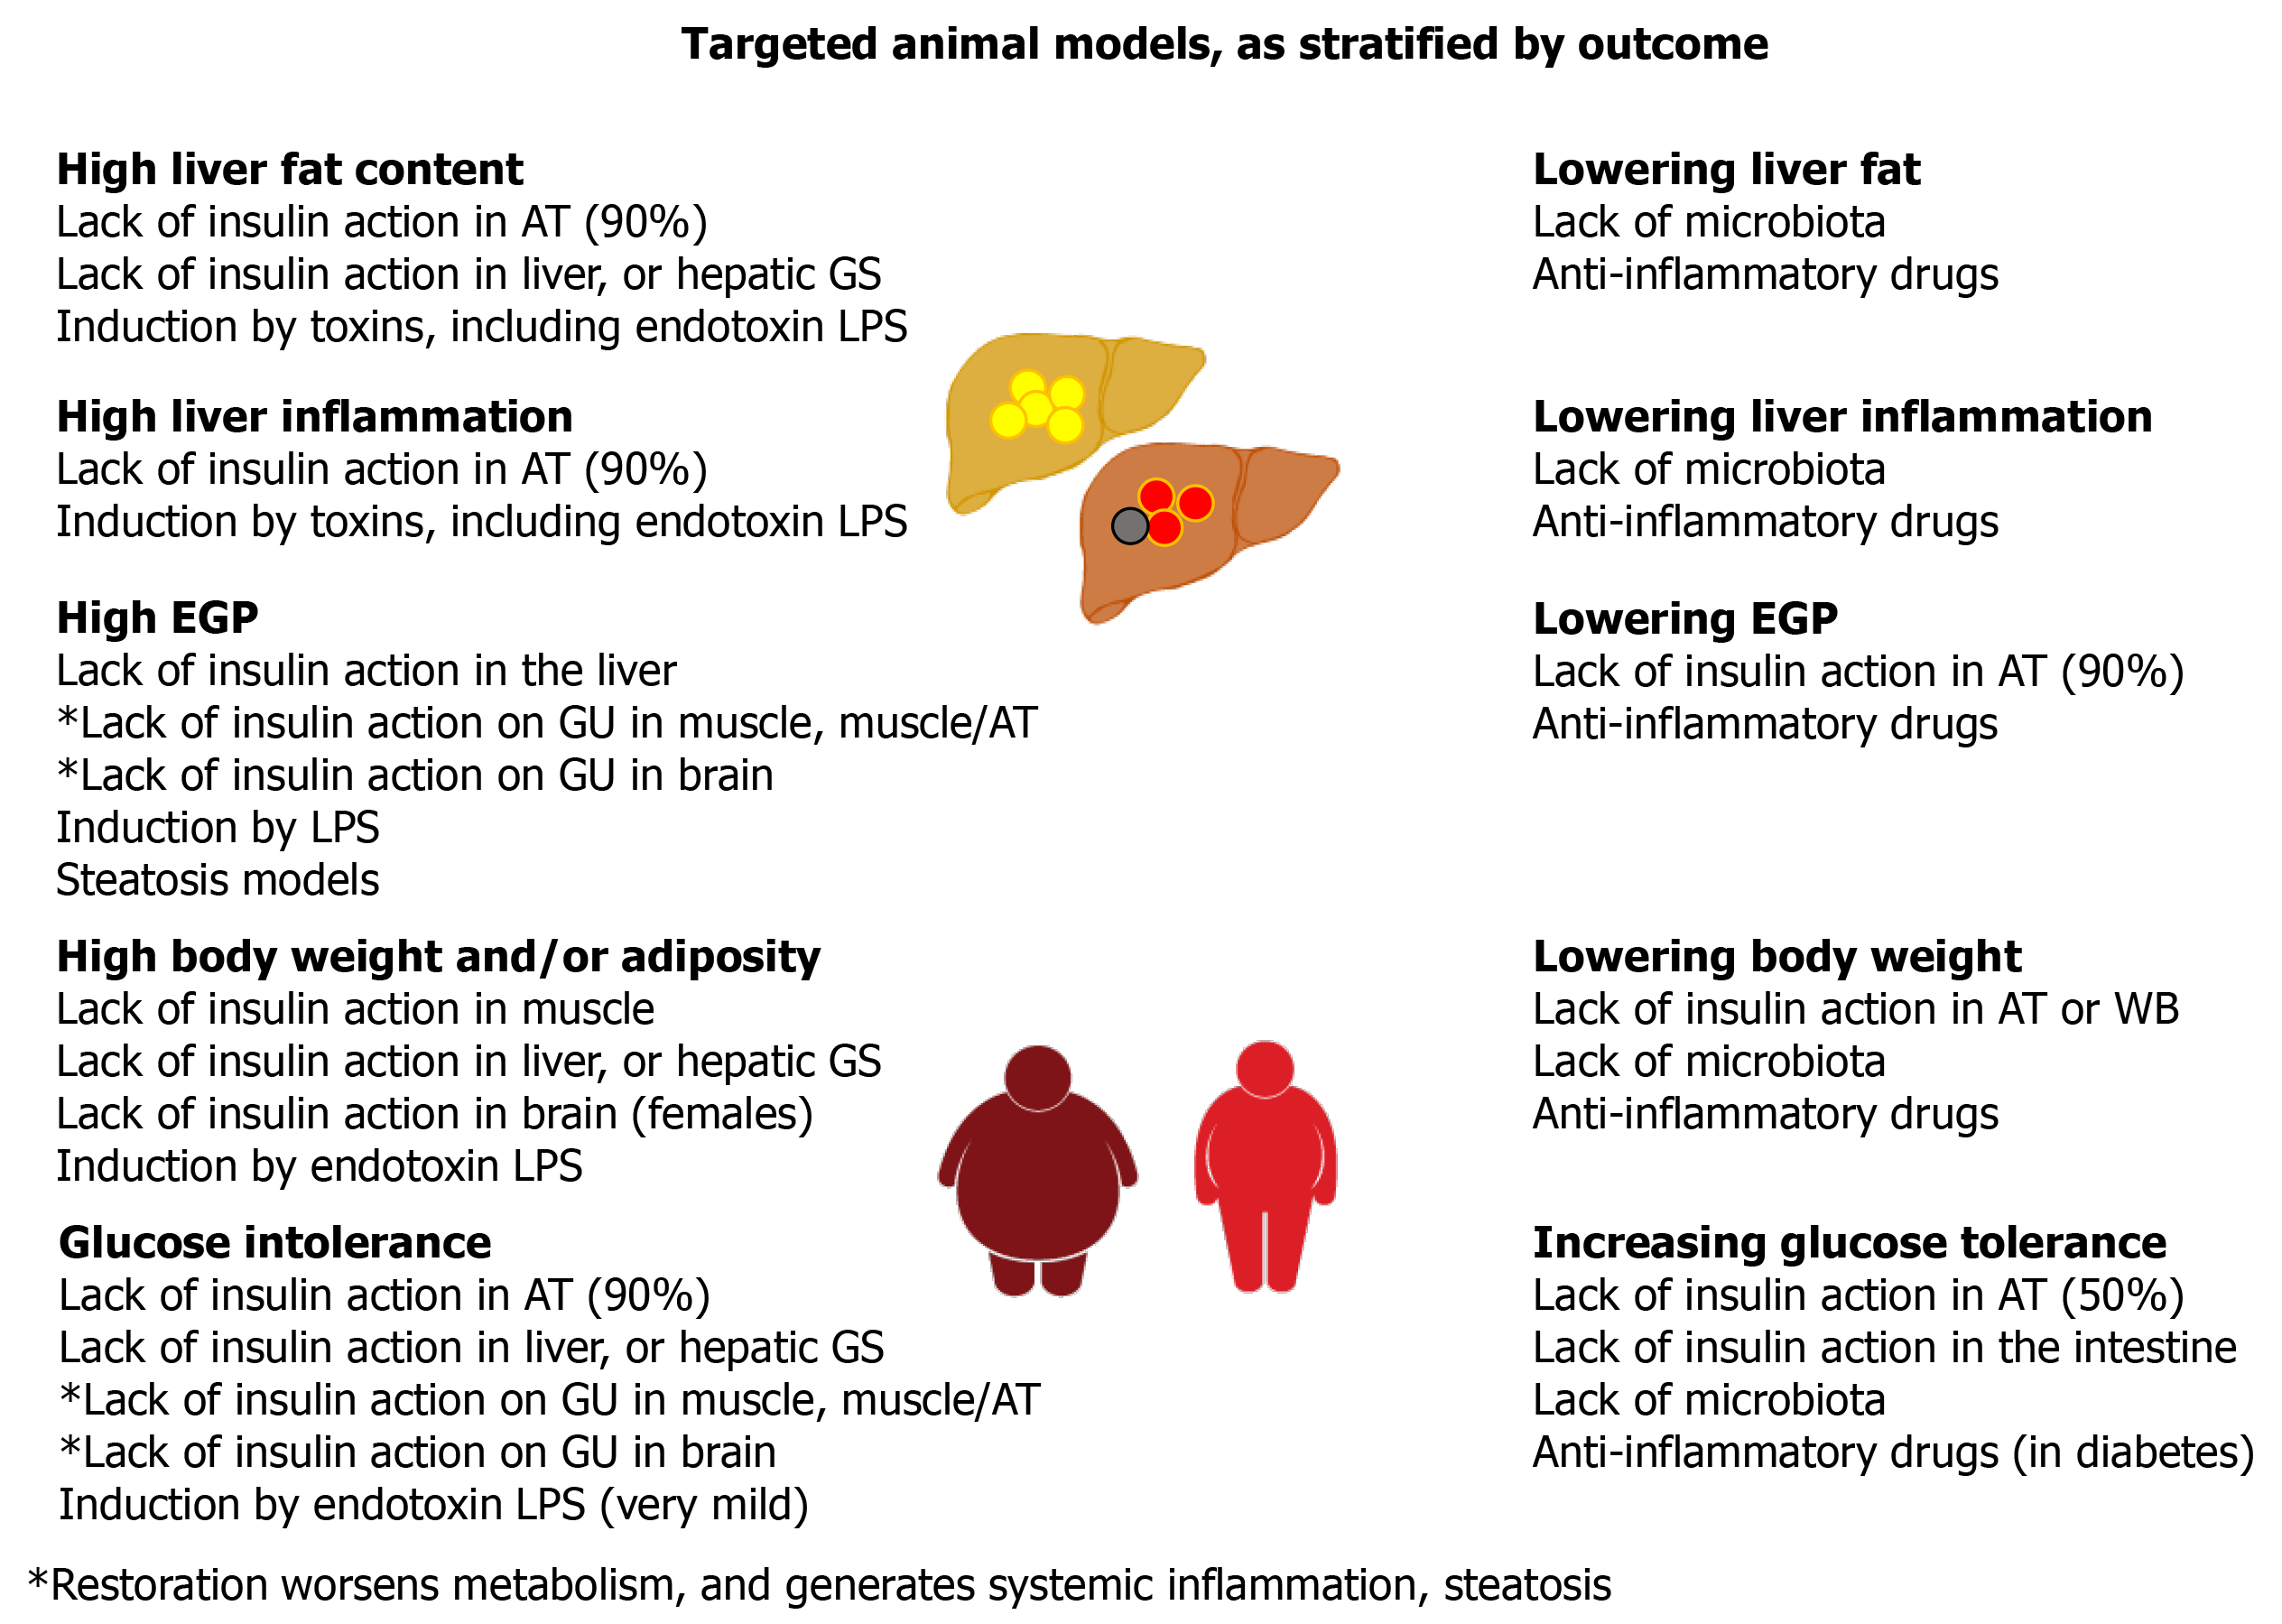
Figure 3 Summary of the outcomes yielded by targeted animal models.
AT: Adipose tissue; LPS: Lipopolysaccharide; GS: Glycogen synthase; GU: Glucose uptake; WB: Whole body.
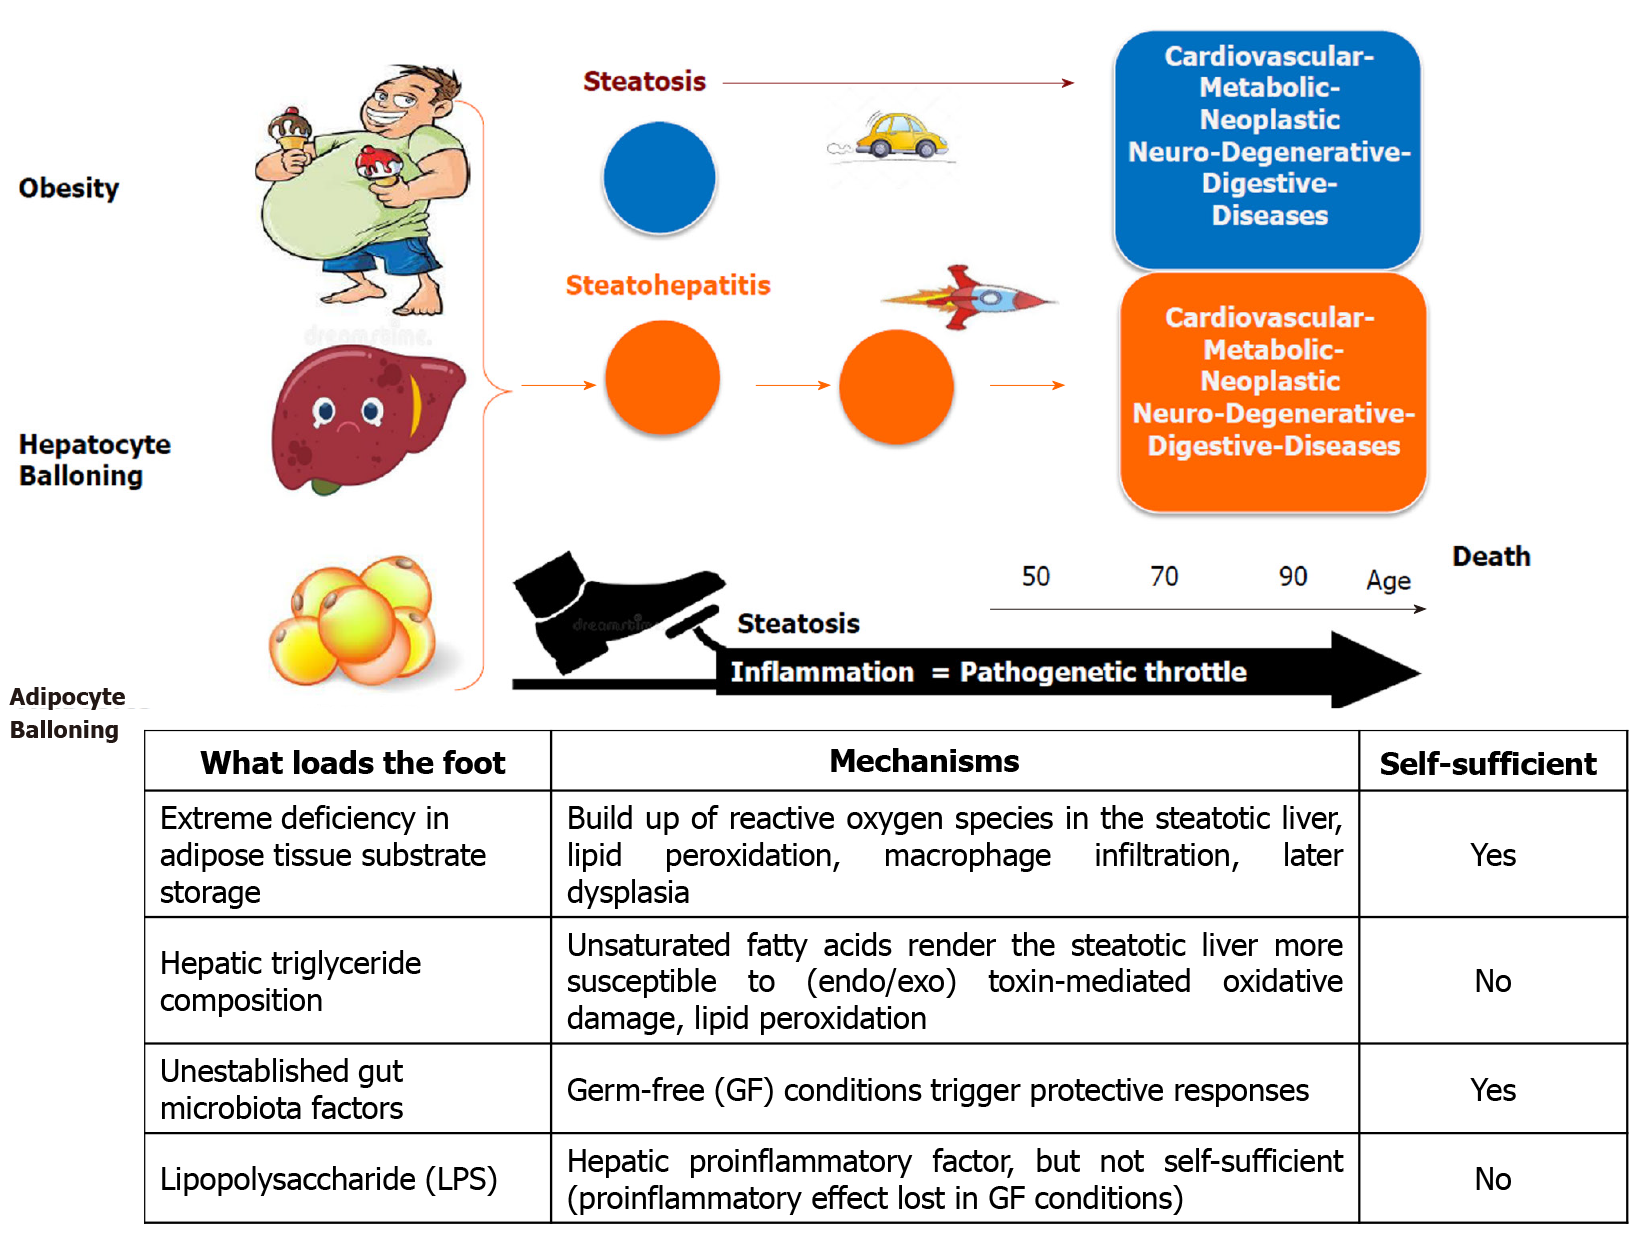
Figure 4 Threesome ballooning hallmark of progressive fatty liver disease.
Liver steatosis is associated with cardiovascular, digestive, metabolic, neoplastic, and neurodegenerative diseases; but it is the concomitant presence of inflammation that markedly accelerates the progression of these diseases. We illustrate this concept, representing steatosis as a “pedal” on which a series of aggravating factors may press as a “foot” that pushes on the “throttle”, namely inflammation.
- Citation: Rebelos E, Iozzo P, Guzzardi MA, Brunetto MR, Bonino F. Brain-gut-liver interactions across the spectrum of insulin resistance in metabolic fatty liver disease. World J Gastroenterol 2021; 27(30): 4999-5018
- URL: https://www.wjgnet.com/1007-9327/full/v27/i30/4999.htm
- DOI: https://dx.doi.org/10.3748/wjg.v27.i30.4999


