Copyright
©The Author(s) 2021.
World J Gastroenterol. Jul 21, 2021; 27(27): 4441-4452
Published online Jul 21, 2021. doi: 10.3748/wjg.v27.i27.4441
Published online Jul 21, 2021. doi: 10.3748/wjg.v27.i27.4441
Figure 1 Detection of diverticula using computed tomography colonography.
The diverticula were detected mainly in 2-dimensional (2D) supine axial images. If necessary, other 2D or 3-dimensional (3D) images were used. The arrow indicates a diverticulum. A: 2D-supine axial image; B: 2D-supine coronal image; C: 3D-virtual colonoscopy image.
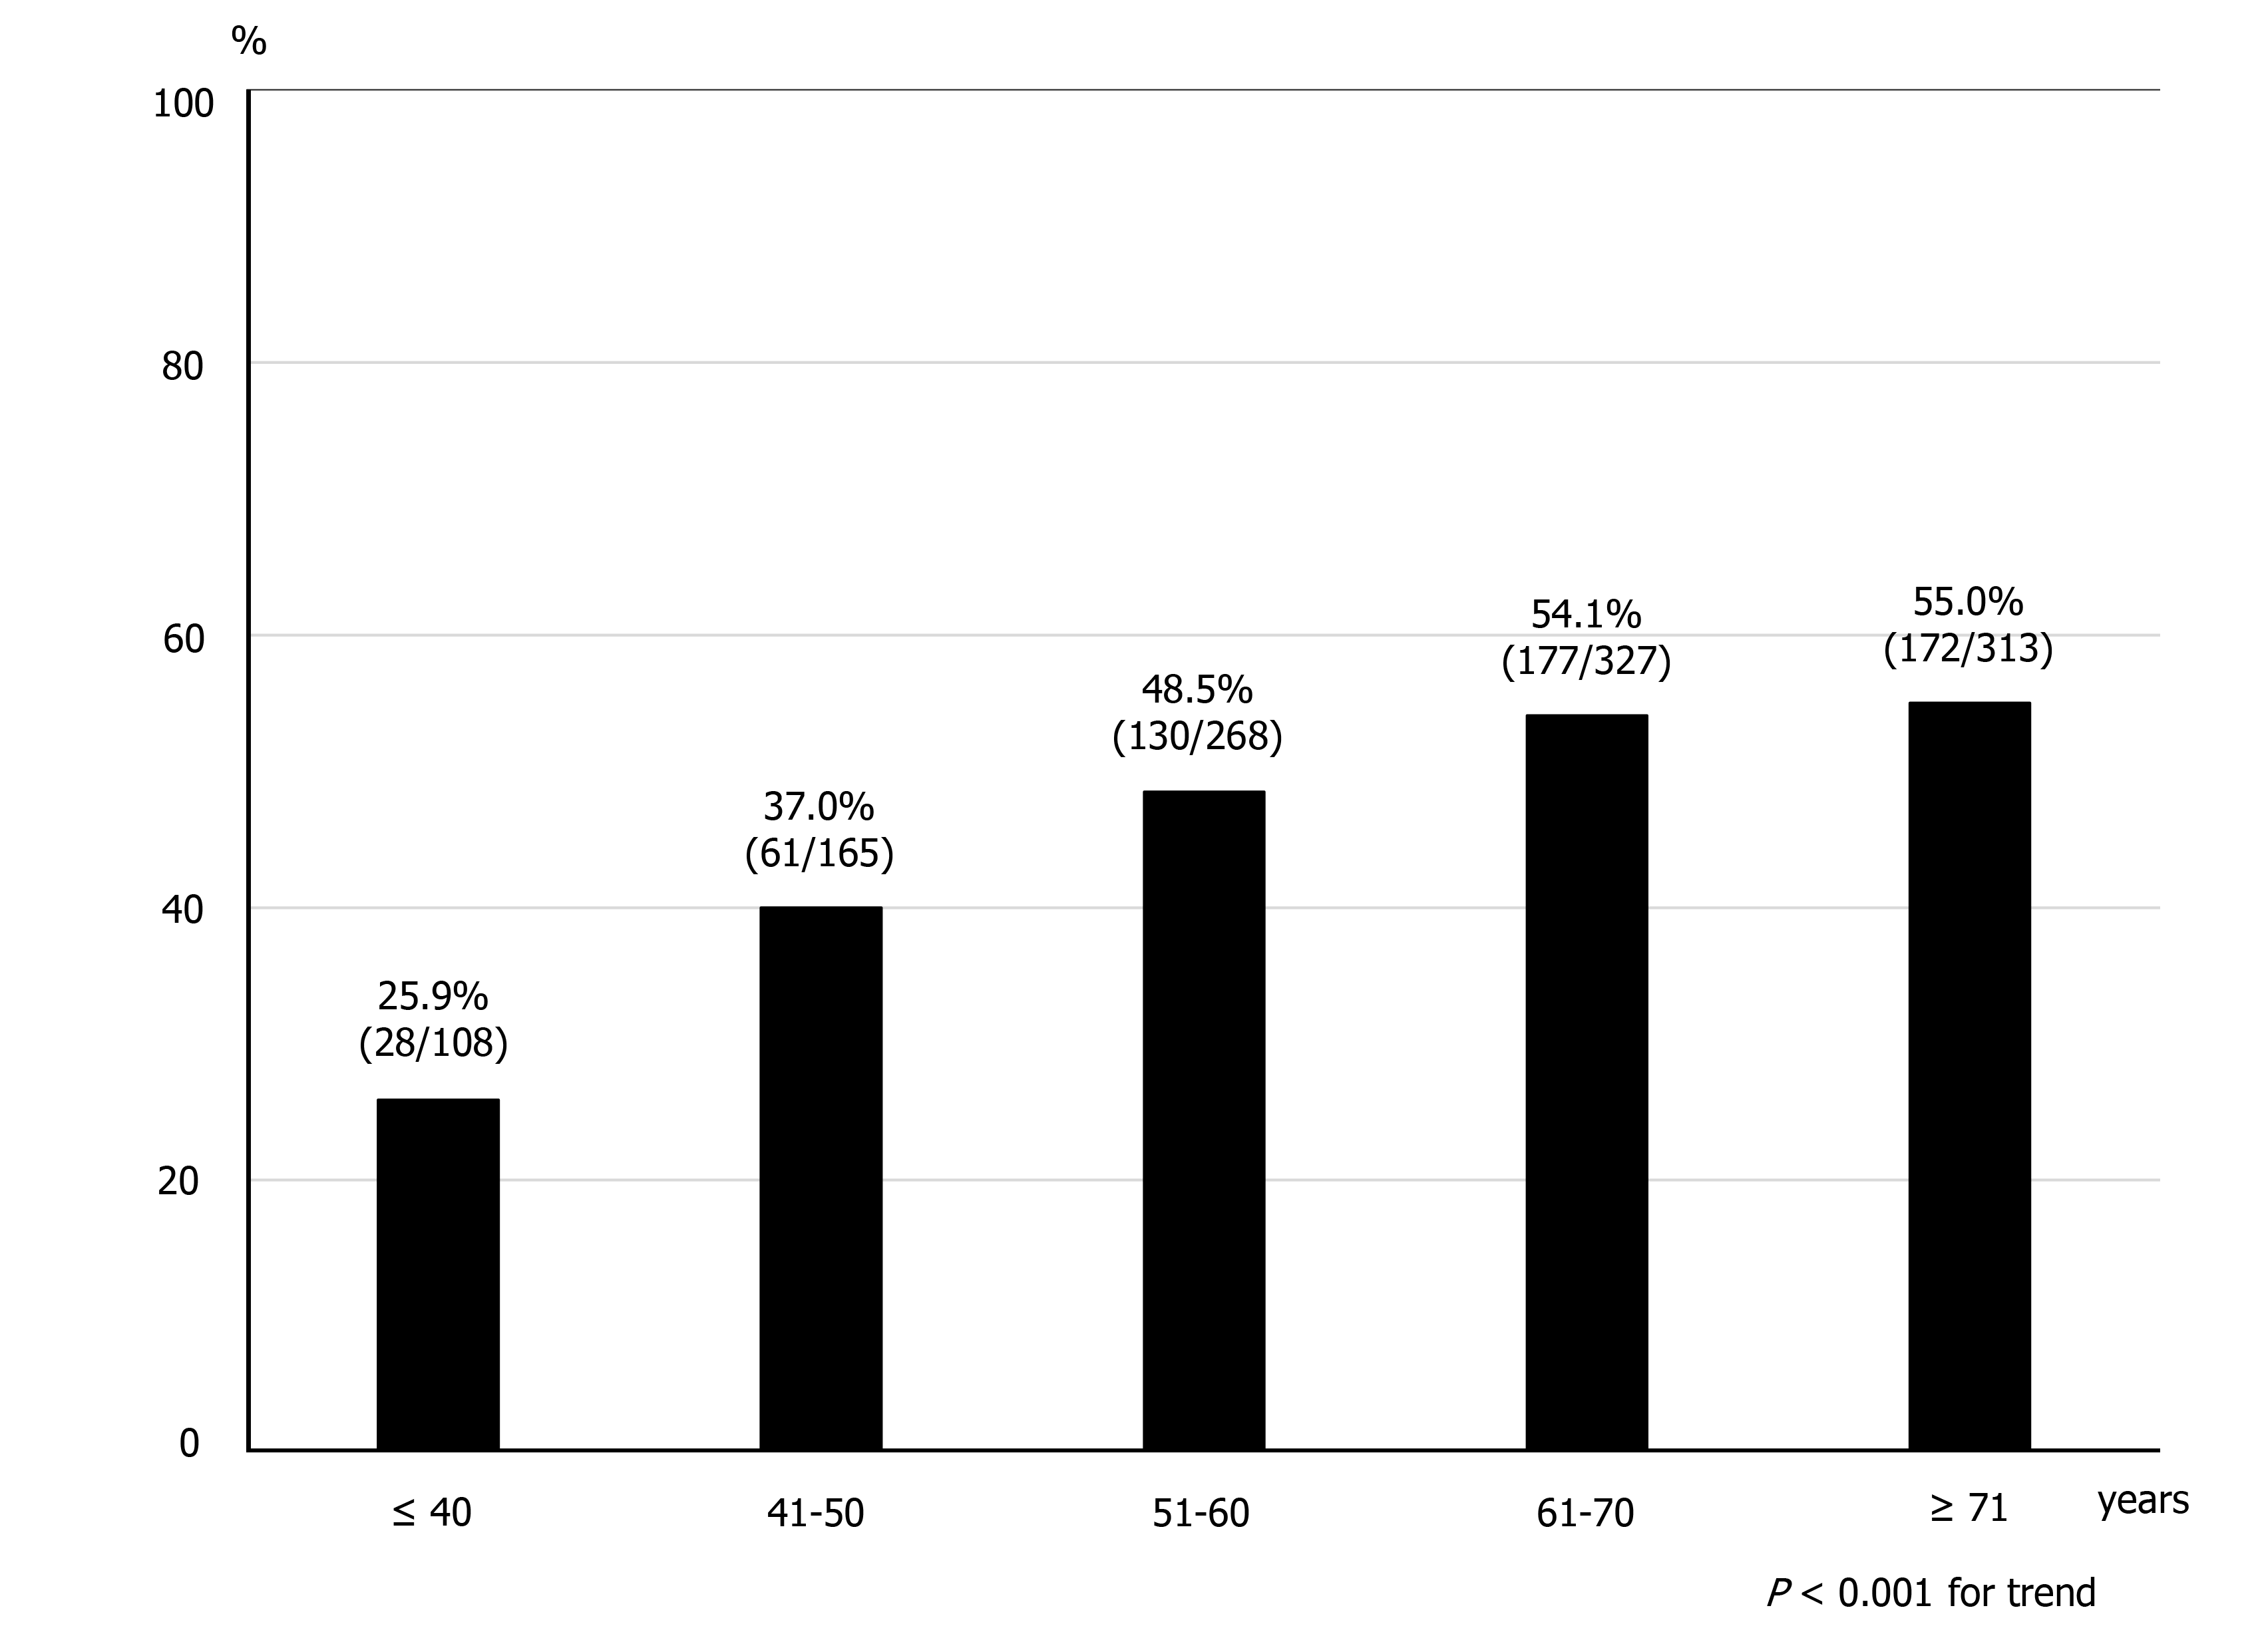
Figure 2 Prevalence of diverticulosis by age group.
The prevalence of diverticulosis increased with age (P < 0.001 for trend).
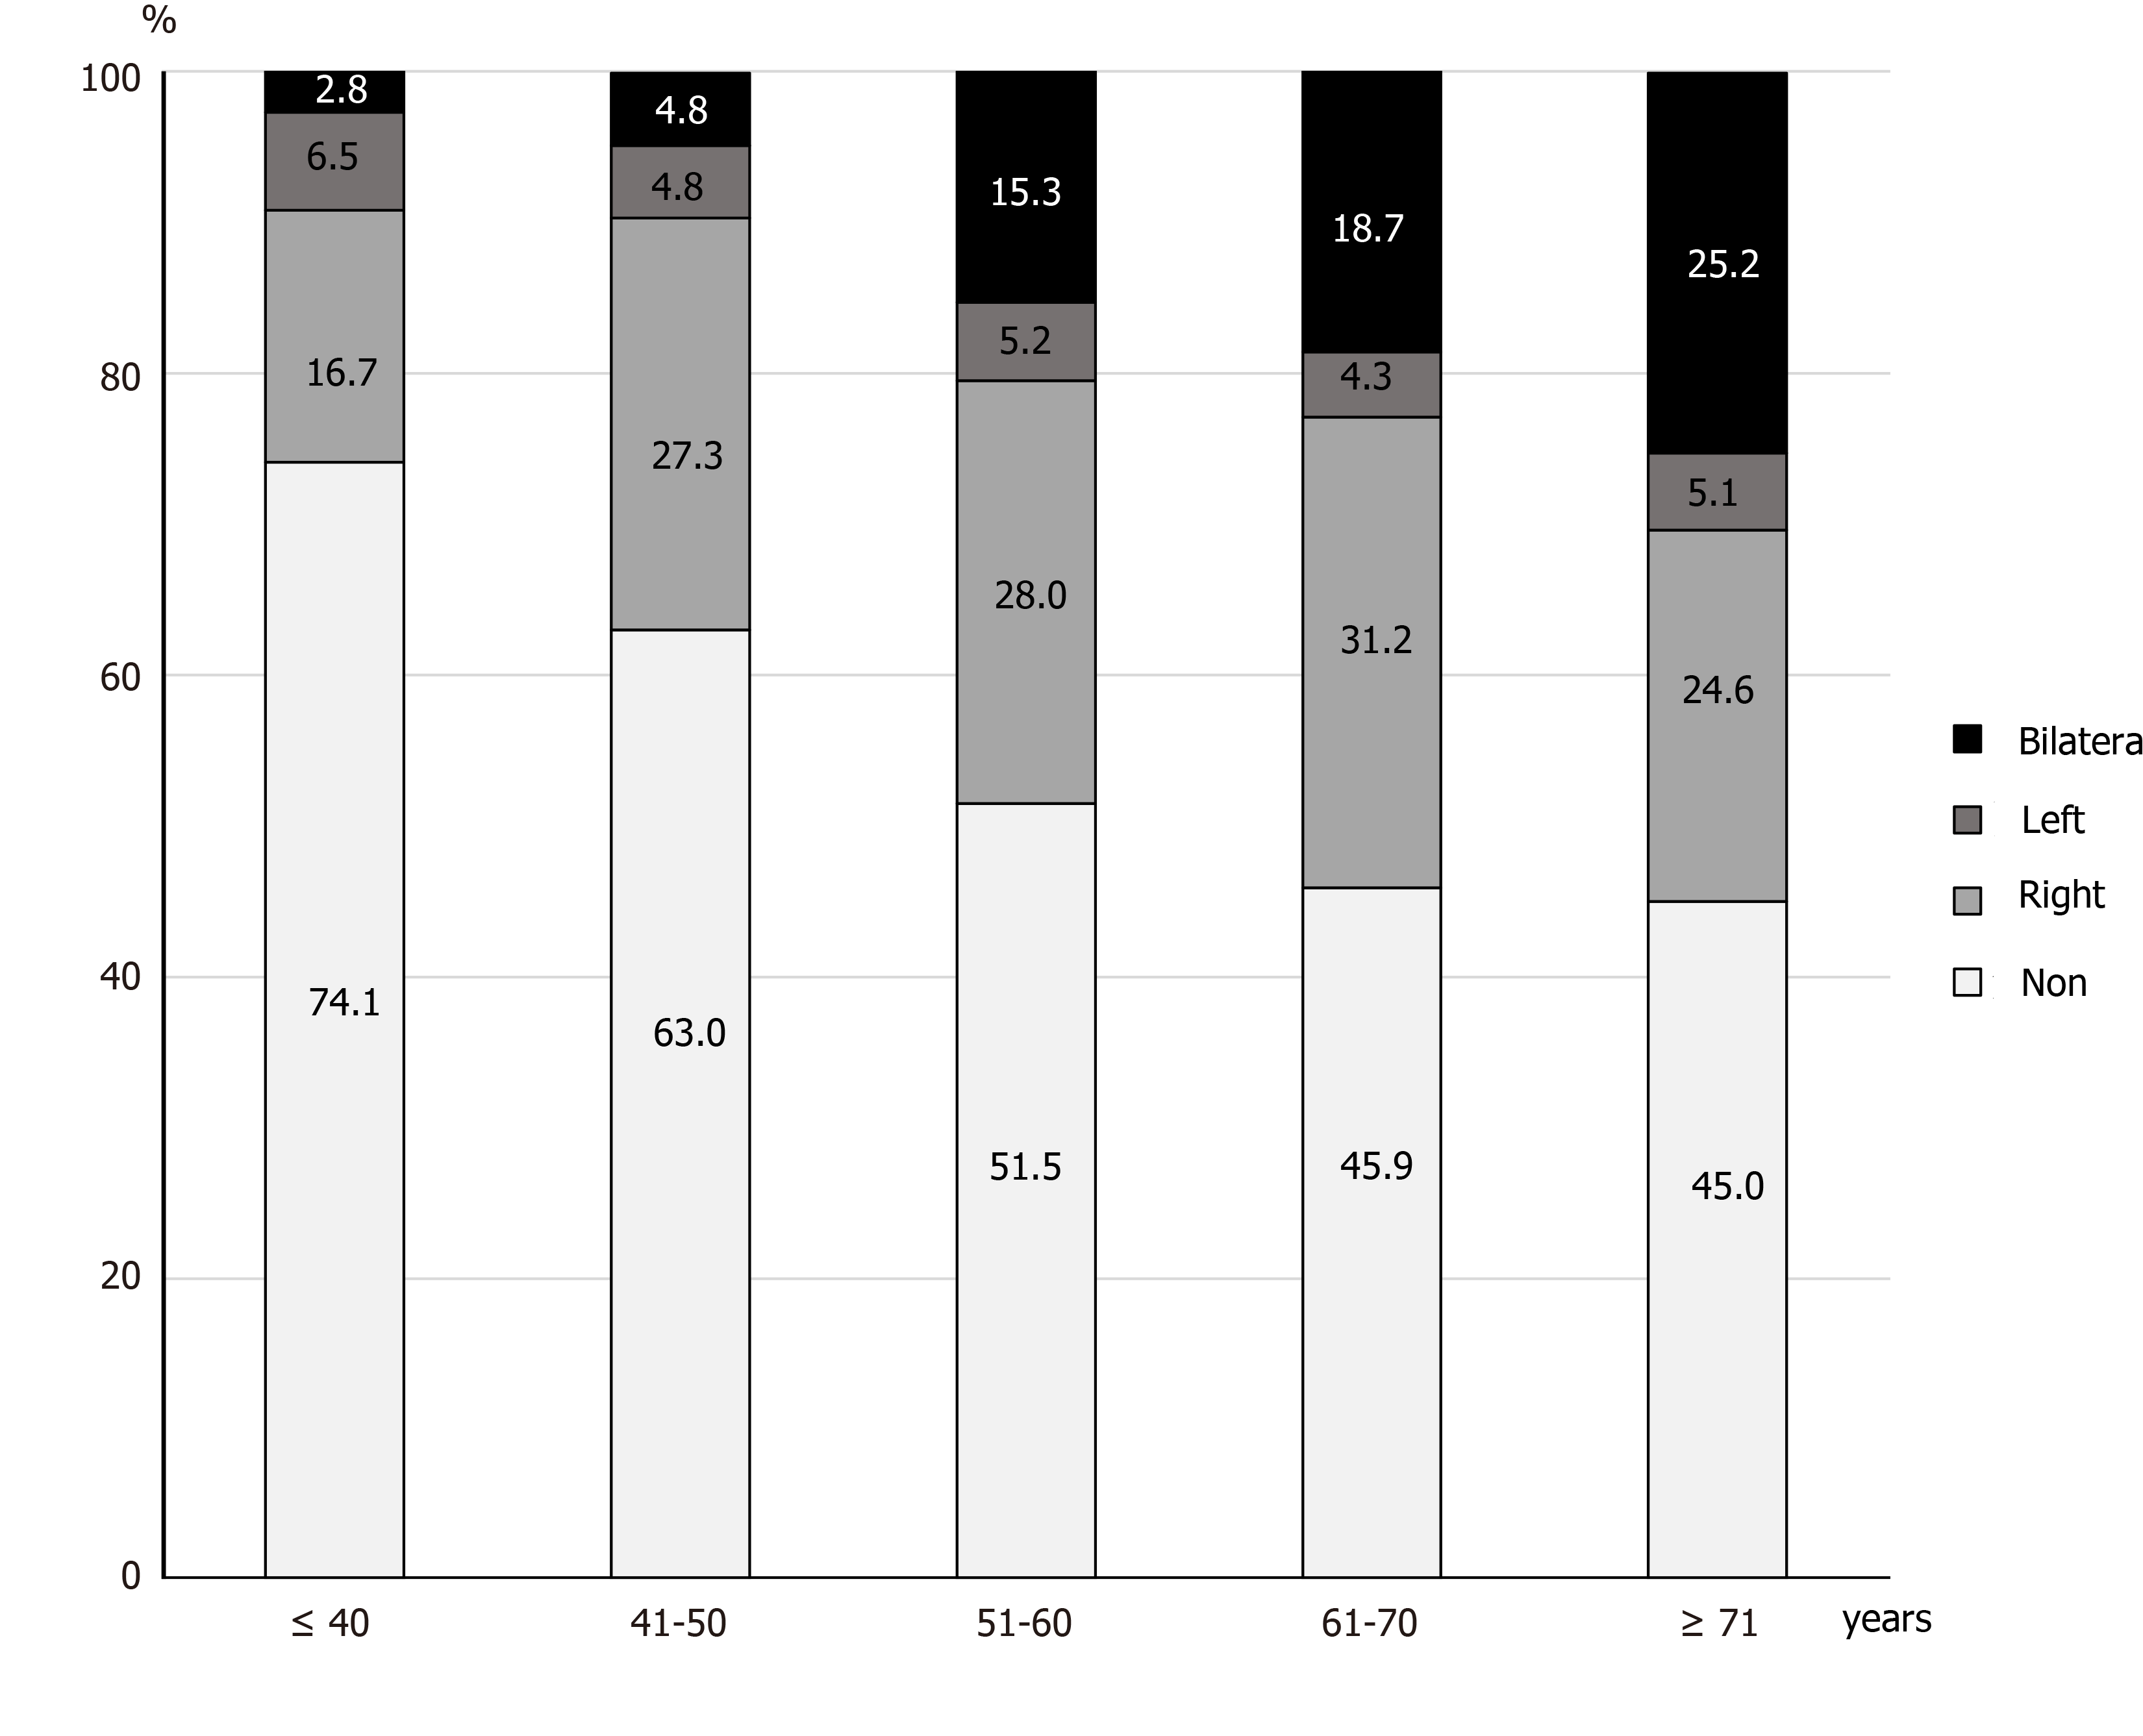
Figure 3 Location of diverticula by age group.
An analysis of all participants showed that diverticulosis of the younger generation was predominantly right-sided, and bilateral diverticulosis increased with age (P < 0.001 for trend).
- Citation: Isohata N, Nagata K, Utano K, Nozaki R, Nozu S, Kato T, Kijima S, Matsumoto H, Majima K, Ryu Y, Hirayama M, Endo S. Recent trends in the prevalence and distribution of colonic diverticula in Japan evaluated using computed tomography colonography. World J Gastroenterol 2021; 27(27): 4441-4452
- URL: https://www.wjgnet.com/1007-9327/full/v27/i27/4441.htm
- DOI: https://dx.doi.org/10.3748/wjg.v27.i27.4441


