Copyright
©The Author(s) 2021.
World J Gastroenterol. Jun 14, 2021; 27(22): 3085-3096
Published online Jun 14, 2021. doi: 10.3748/wjg.v27.i22.3085
Published online Jun 14, 2021. doi: 10.3748/wjg.v27.i22.3085
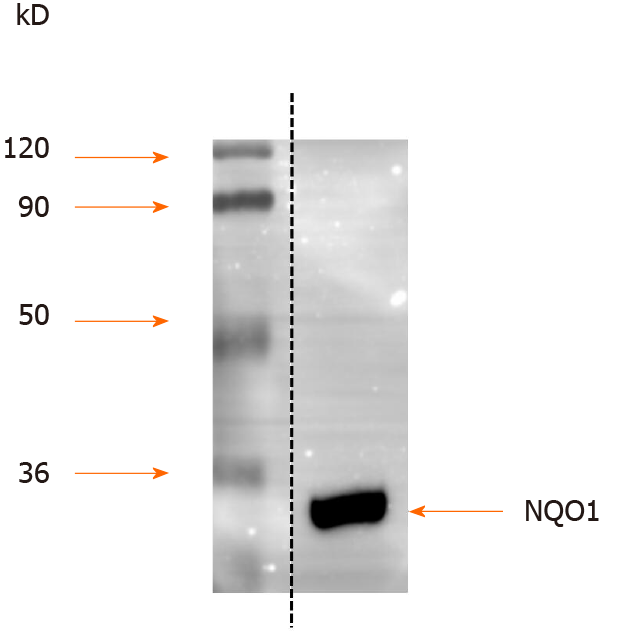
Figure 1 Western blot analysis of quinine oxidoreductase 1 expression in gastric carcinoma cell line AGS.
Protein extracts from AGS human gastric cancer cells were separated by sodium dodecyl sulfate-polyacrylamide gel electrophoresis, and the proteins were detected by Western blot using anti-quinine oxidoreductase 1 antibodies. Molecular masses in kDa are indicated to the left. NQO1: Quinine oxidoreductase 1.
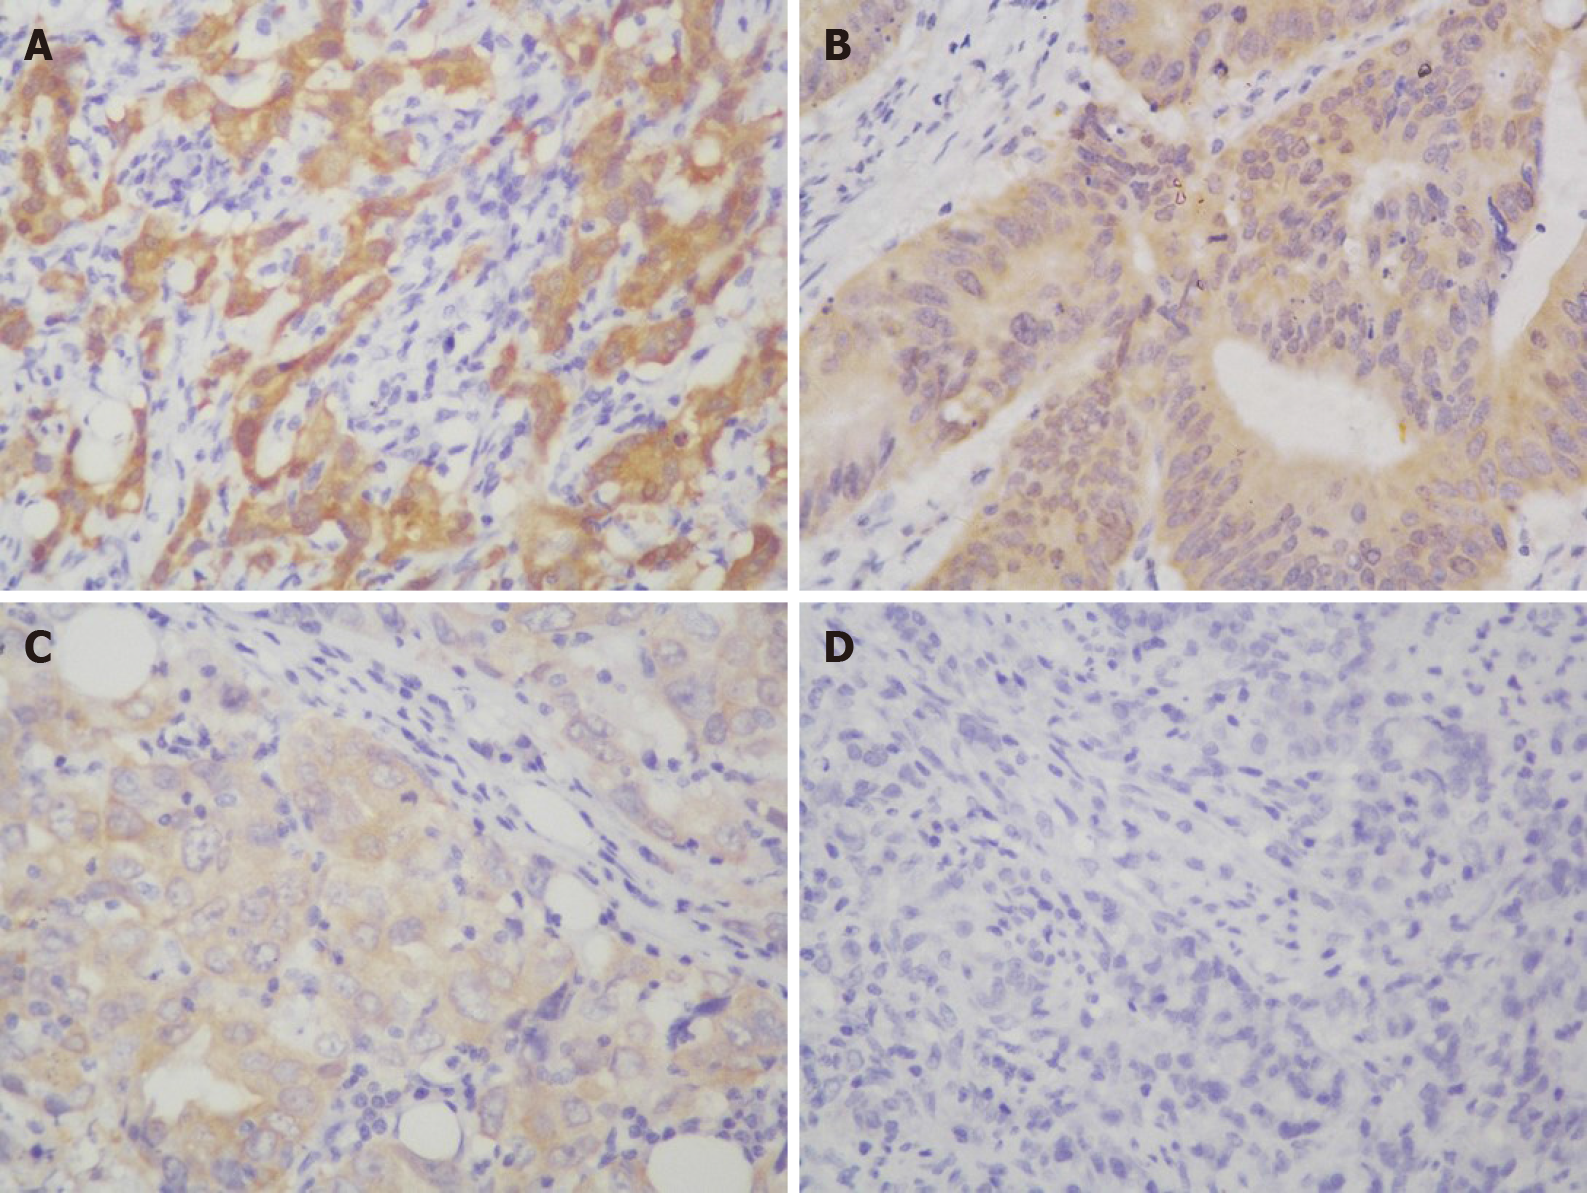
Figure 2 Representative images of immunohistochemical staining for quinine oxidoreductase 1 in gastric cancer samples.
A: Strong (+++); B: Moderate (++); C: Weak (+); D: Negative staining (original magnification × 400).
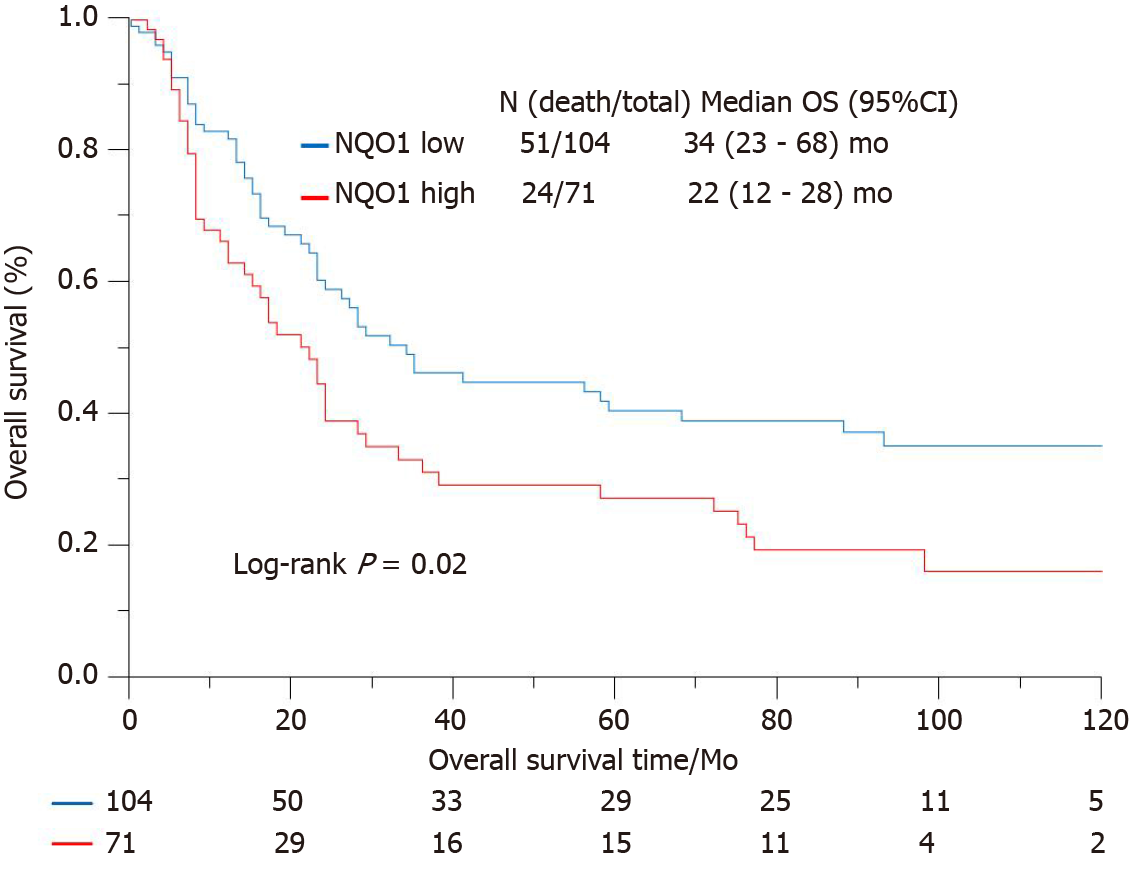
Figure 3 Kaplan-Meier survival curves of postoperative outcomes of gastric cancer patients according to quinine oxidoreductase 1 expression status.
The correlation of high and low quinine oxidoreductase 1 expression with the overall survival rate was statistically significant (P = 0.02). NQO1: Quinine oxidoreductase 1; OS: Overall survival; CI: Confidence interval.
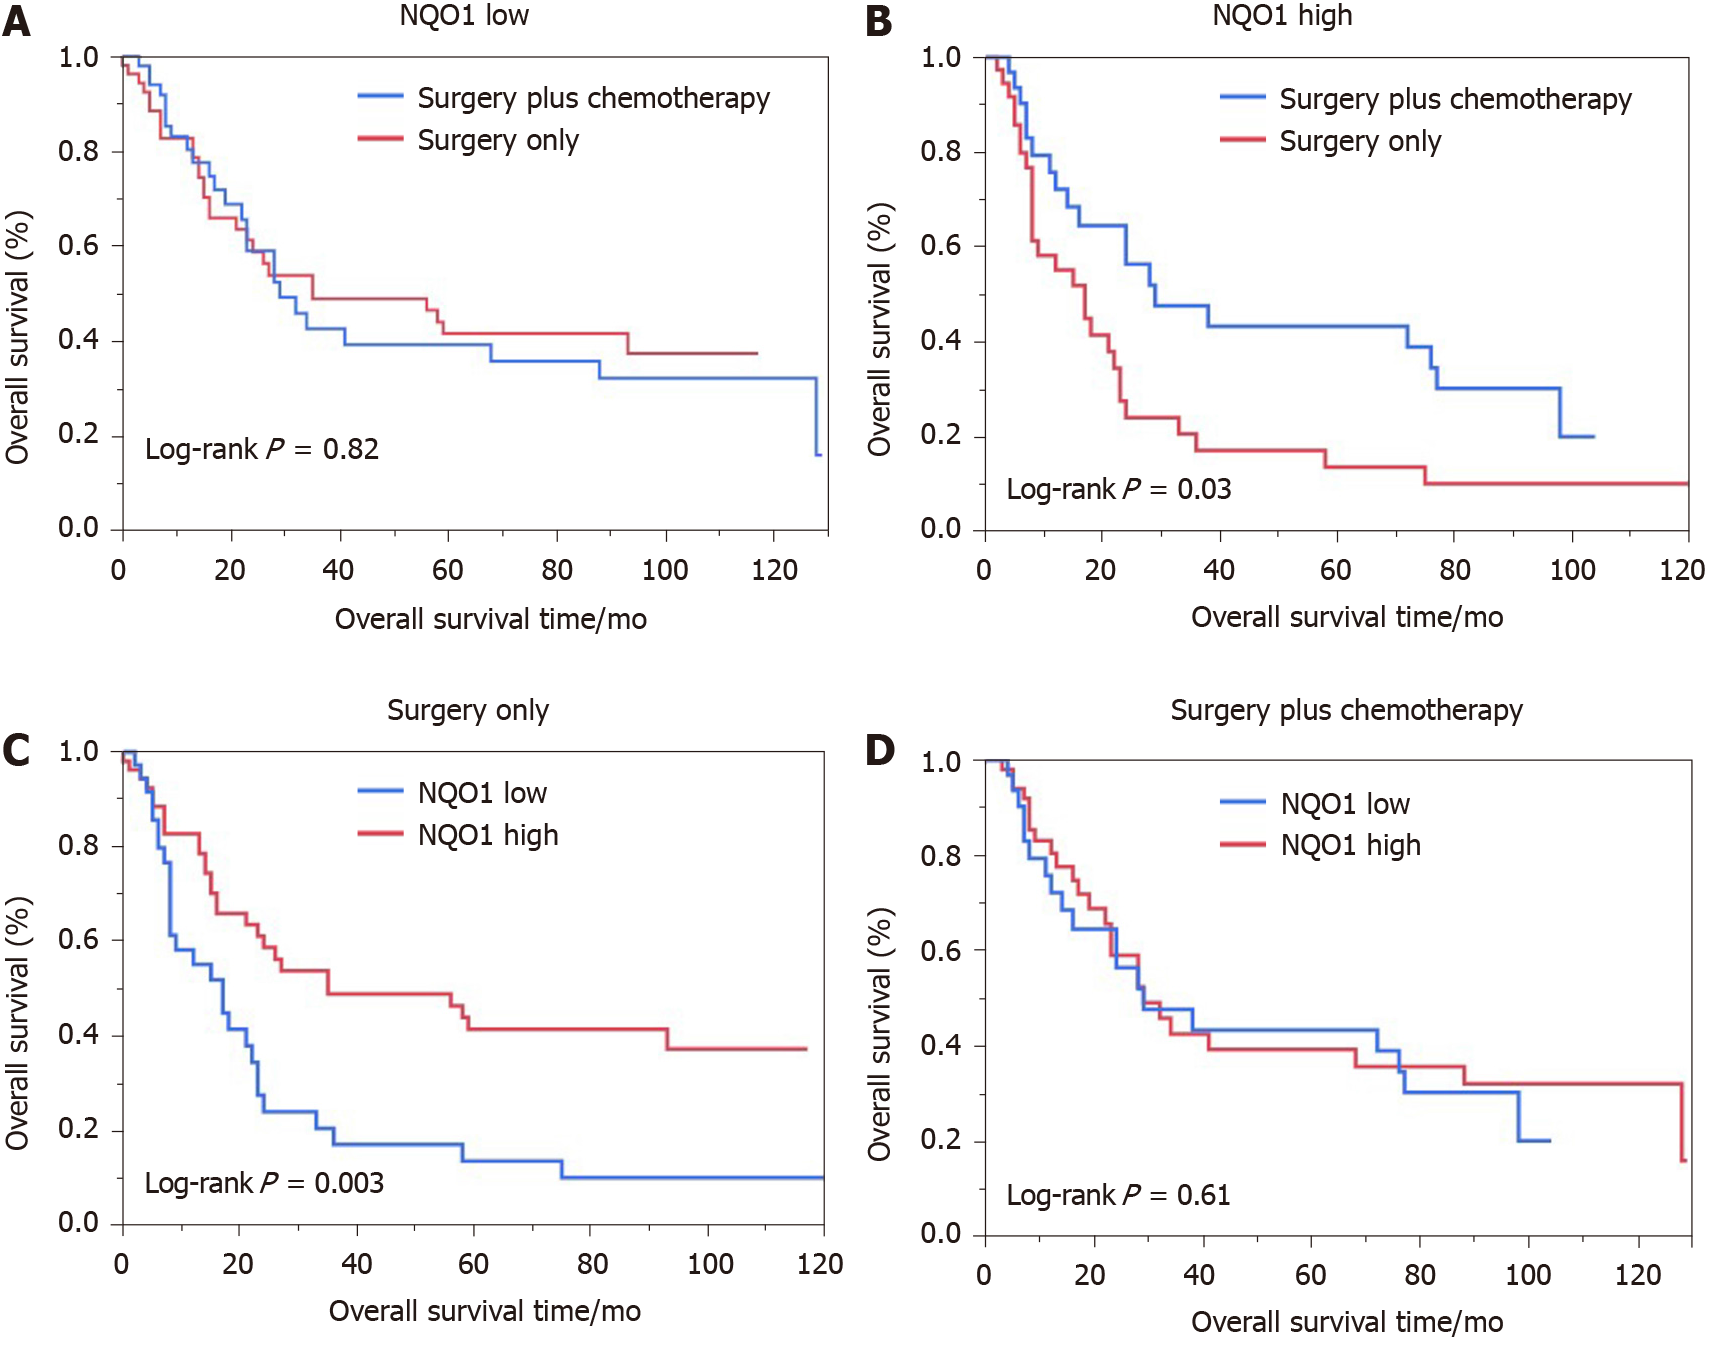
Figure 4 Kaplan-Meier analysis of overall survival rates in patients with gastric cancer.
A: Low oxidoreductase 1 expression; B: High quinine oxidoreductase 1 expression; C: Surgery only; D: With adjuvant chemotherapy. NQO1: Quinine oxidoreductase 1.
- Citation: Jiang ZN, Ahmed SMU, Wang QC, Shi HF, Tang XW. Quinone oxidoreductase 1 is overexpressed in gastric cancer and associated with outcome of adjuvant chemotherapy and survival. World J Gastroenterol 2021; 27(22): 3085-3096
- URL: https://www.wjgnet.com/1007-9327/full/v27/i22/3085.htm
- DOI: https://dx.doi.org/10.3748/wjg.v27.i22.3085


