Copyright
©The Author(s) 2021.
World J Gastroenterol. Jun 14, 2021; 27(22): 2921-2943
Published online Jun 14, 2021. doi: 10.3748/wjg.v27.i22.2921
Published online Jun 14, 2021. doi: 10.3748/wjg.v27.i22.2921
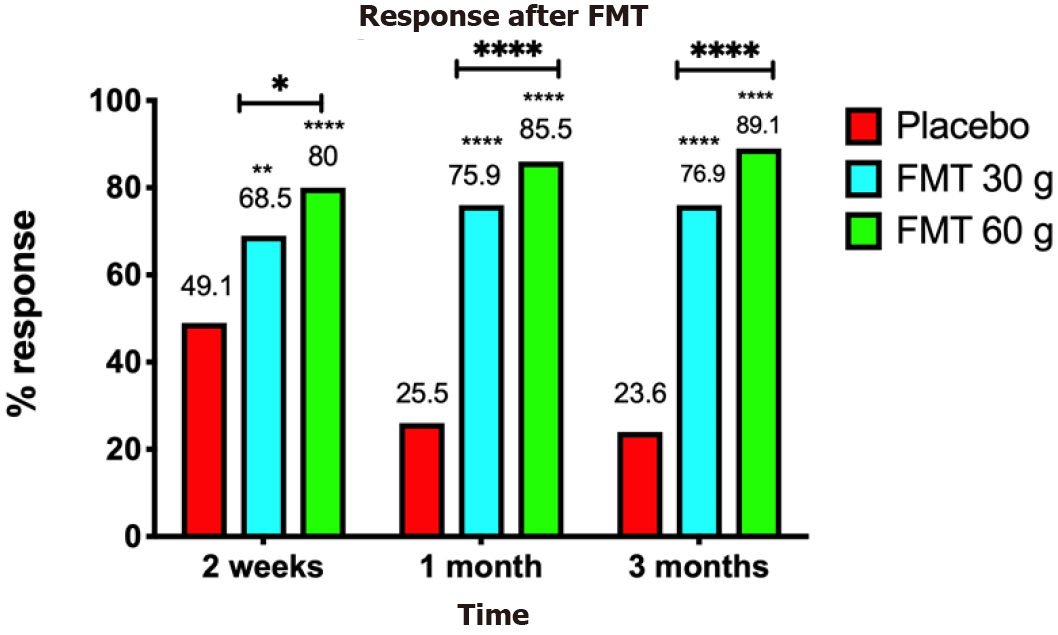
Figure 1 Responses of irritable bowel syndrome patients to placebo, 30-g fecal microbiota transplantation, and 60-g fecal microbiota transplantation at different intervals after transplantation.
**P < 0.001; ****P < 0.0001 compared with placebo. **P < 0.001; ****P < 0.0001 for 30-g fecal microbiota transplantation (FMT) compared with 60-g FMT. Citation: El-Salhy M, Hatlebakk JG, Gilja OH, Bråthen Kristoffersen A, Hausken T. Efficacy of faecal microbiota transplantation for patients with irritable bowel syndrome in a randomised, double-blind, placebo-controlled study. Gut 2020; 69: 859-867. Copyright @BMJ Publishing Group Ltd 2020. Published by BMJ Publishing Group Ltd[11].
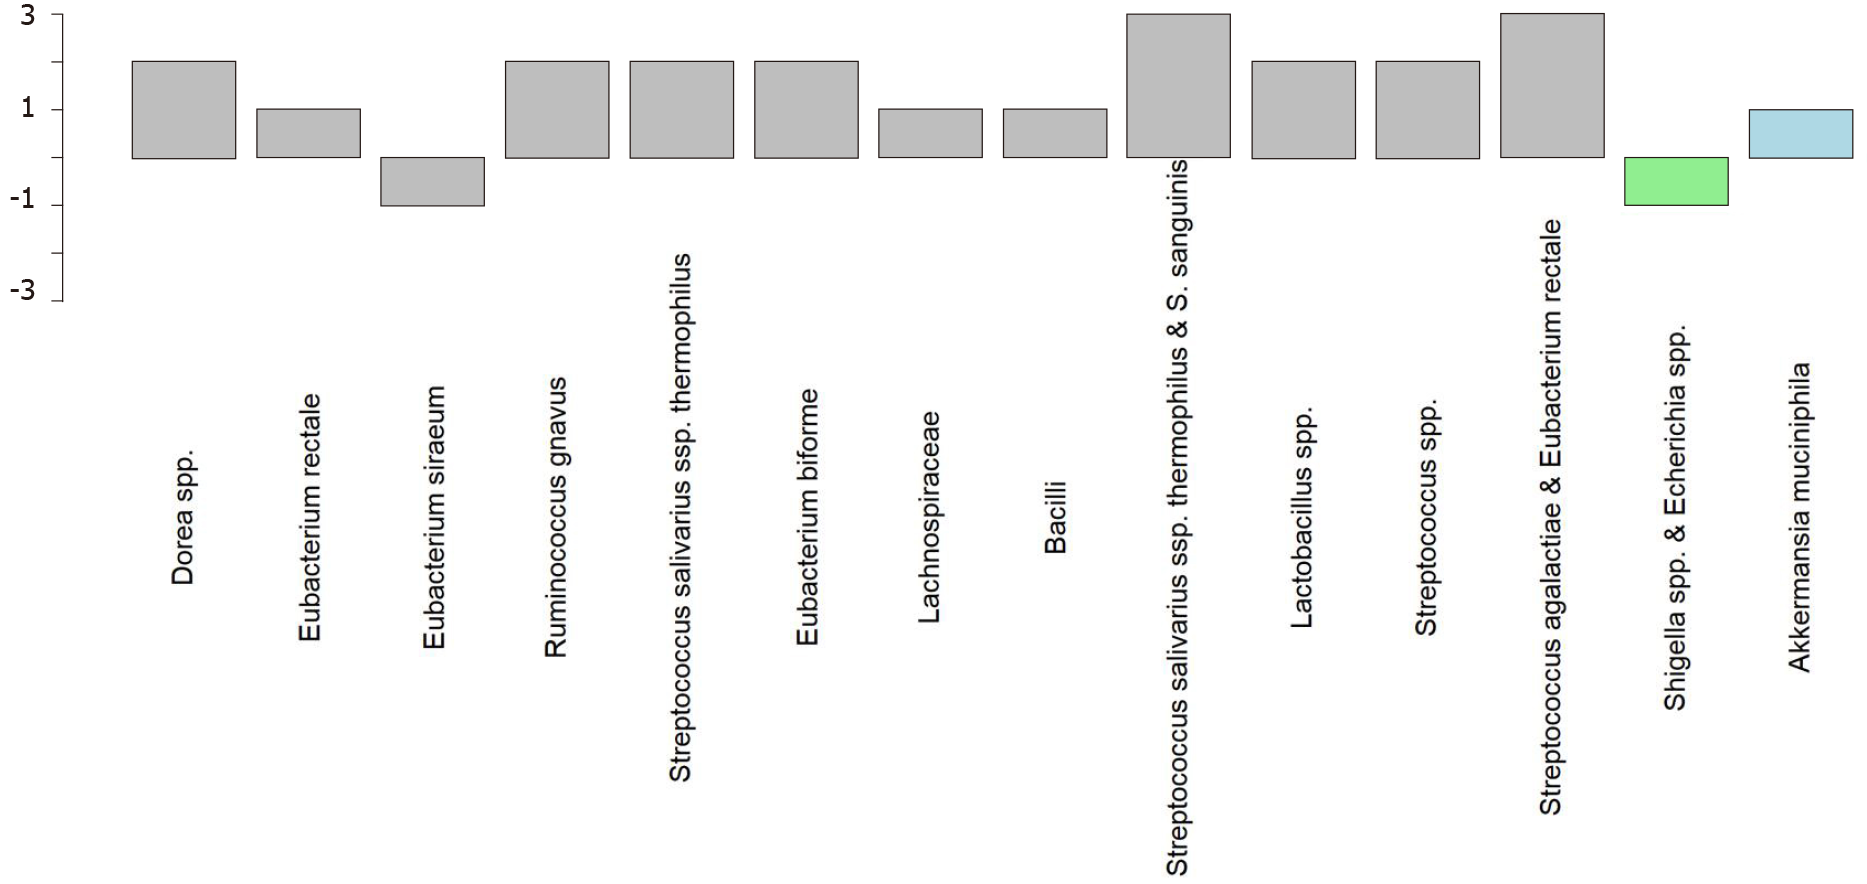
Figure 2 Superdonor bacterial profile deviated from the expected normal abundance in 14 of the 39 bacteria markers.
The deviating bacteria belong to the typical commensal bacteria species that do not contribute to dysbiosis. Twelve of these bacteria belong to the Firmicutes phylum (gray), one to the Proteobacteria phylum (light green), and one to the Verrucomicrobia phylum (light blue). Citation: El-Salhy M, Hatlebakk JG, Gilja OH, Bråthen Kristoffersen A, Hausken T. Efficacy of faecal microbiota transplantation for patients with irritable bowel syndrome in a randomised, double-blind, placebo-controlled study. Gut 2020; 69: 859-867. Copyright @BMJ Publishing Group Ltd 2020. Published by BMJ Publishing Group Ltd[11].
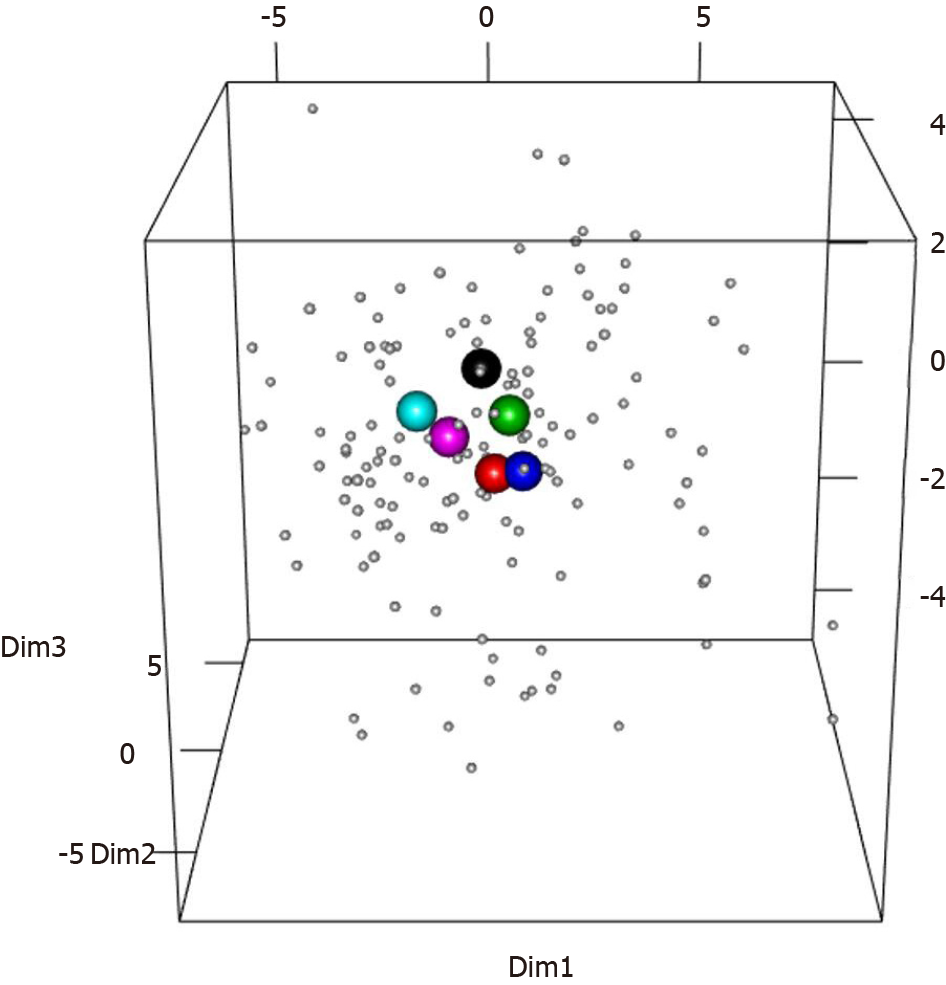
Figure 3 Scaled principal component analysis plot of fecal samples from the superdonor and patients before transplantation.
The patient samples are indicated by small gray circles. The superdonor samples are indicated by the larger circles of different colors reflecting the sampling times: black, 3 mo; red, 6 mo; green, 9 mo; blue, 12 mo; light blue, 15 mo; and pink, 18 mo. All of the superdonor samples are grouped closely together and remain in very similar positions over time. Citation: El-Salhy M, Hatlebakk JG, Gilja OH, Bråthen Kristoffersen A, Hausken T. Efficacy of faecal microbiota transplantation for patients with irritable bowel syndrome in a randomised, double-blind, placebo-controlled study. Gut 2020; 69: 859-867. Copyright @BMJ Publishing Group Ltd 2020. Published by BMJ Publishing Group Ltd[11].
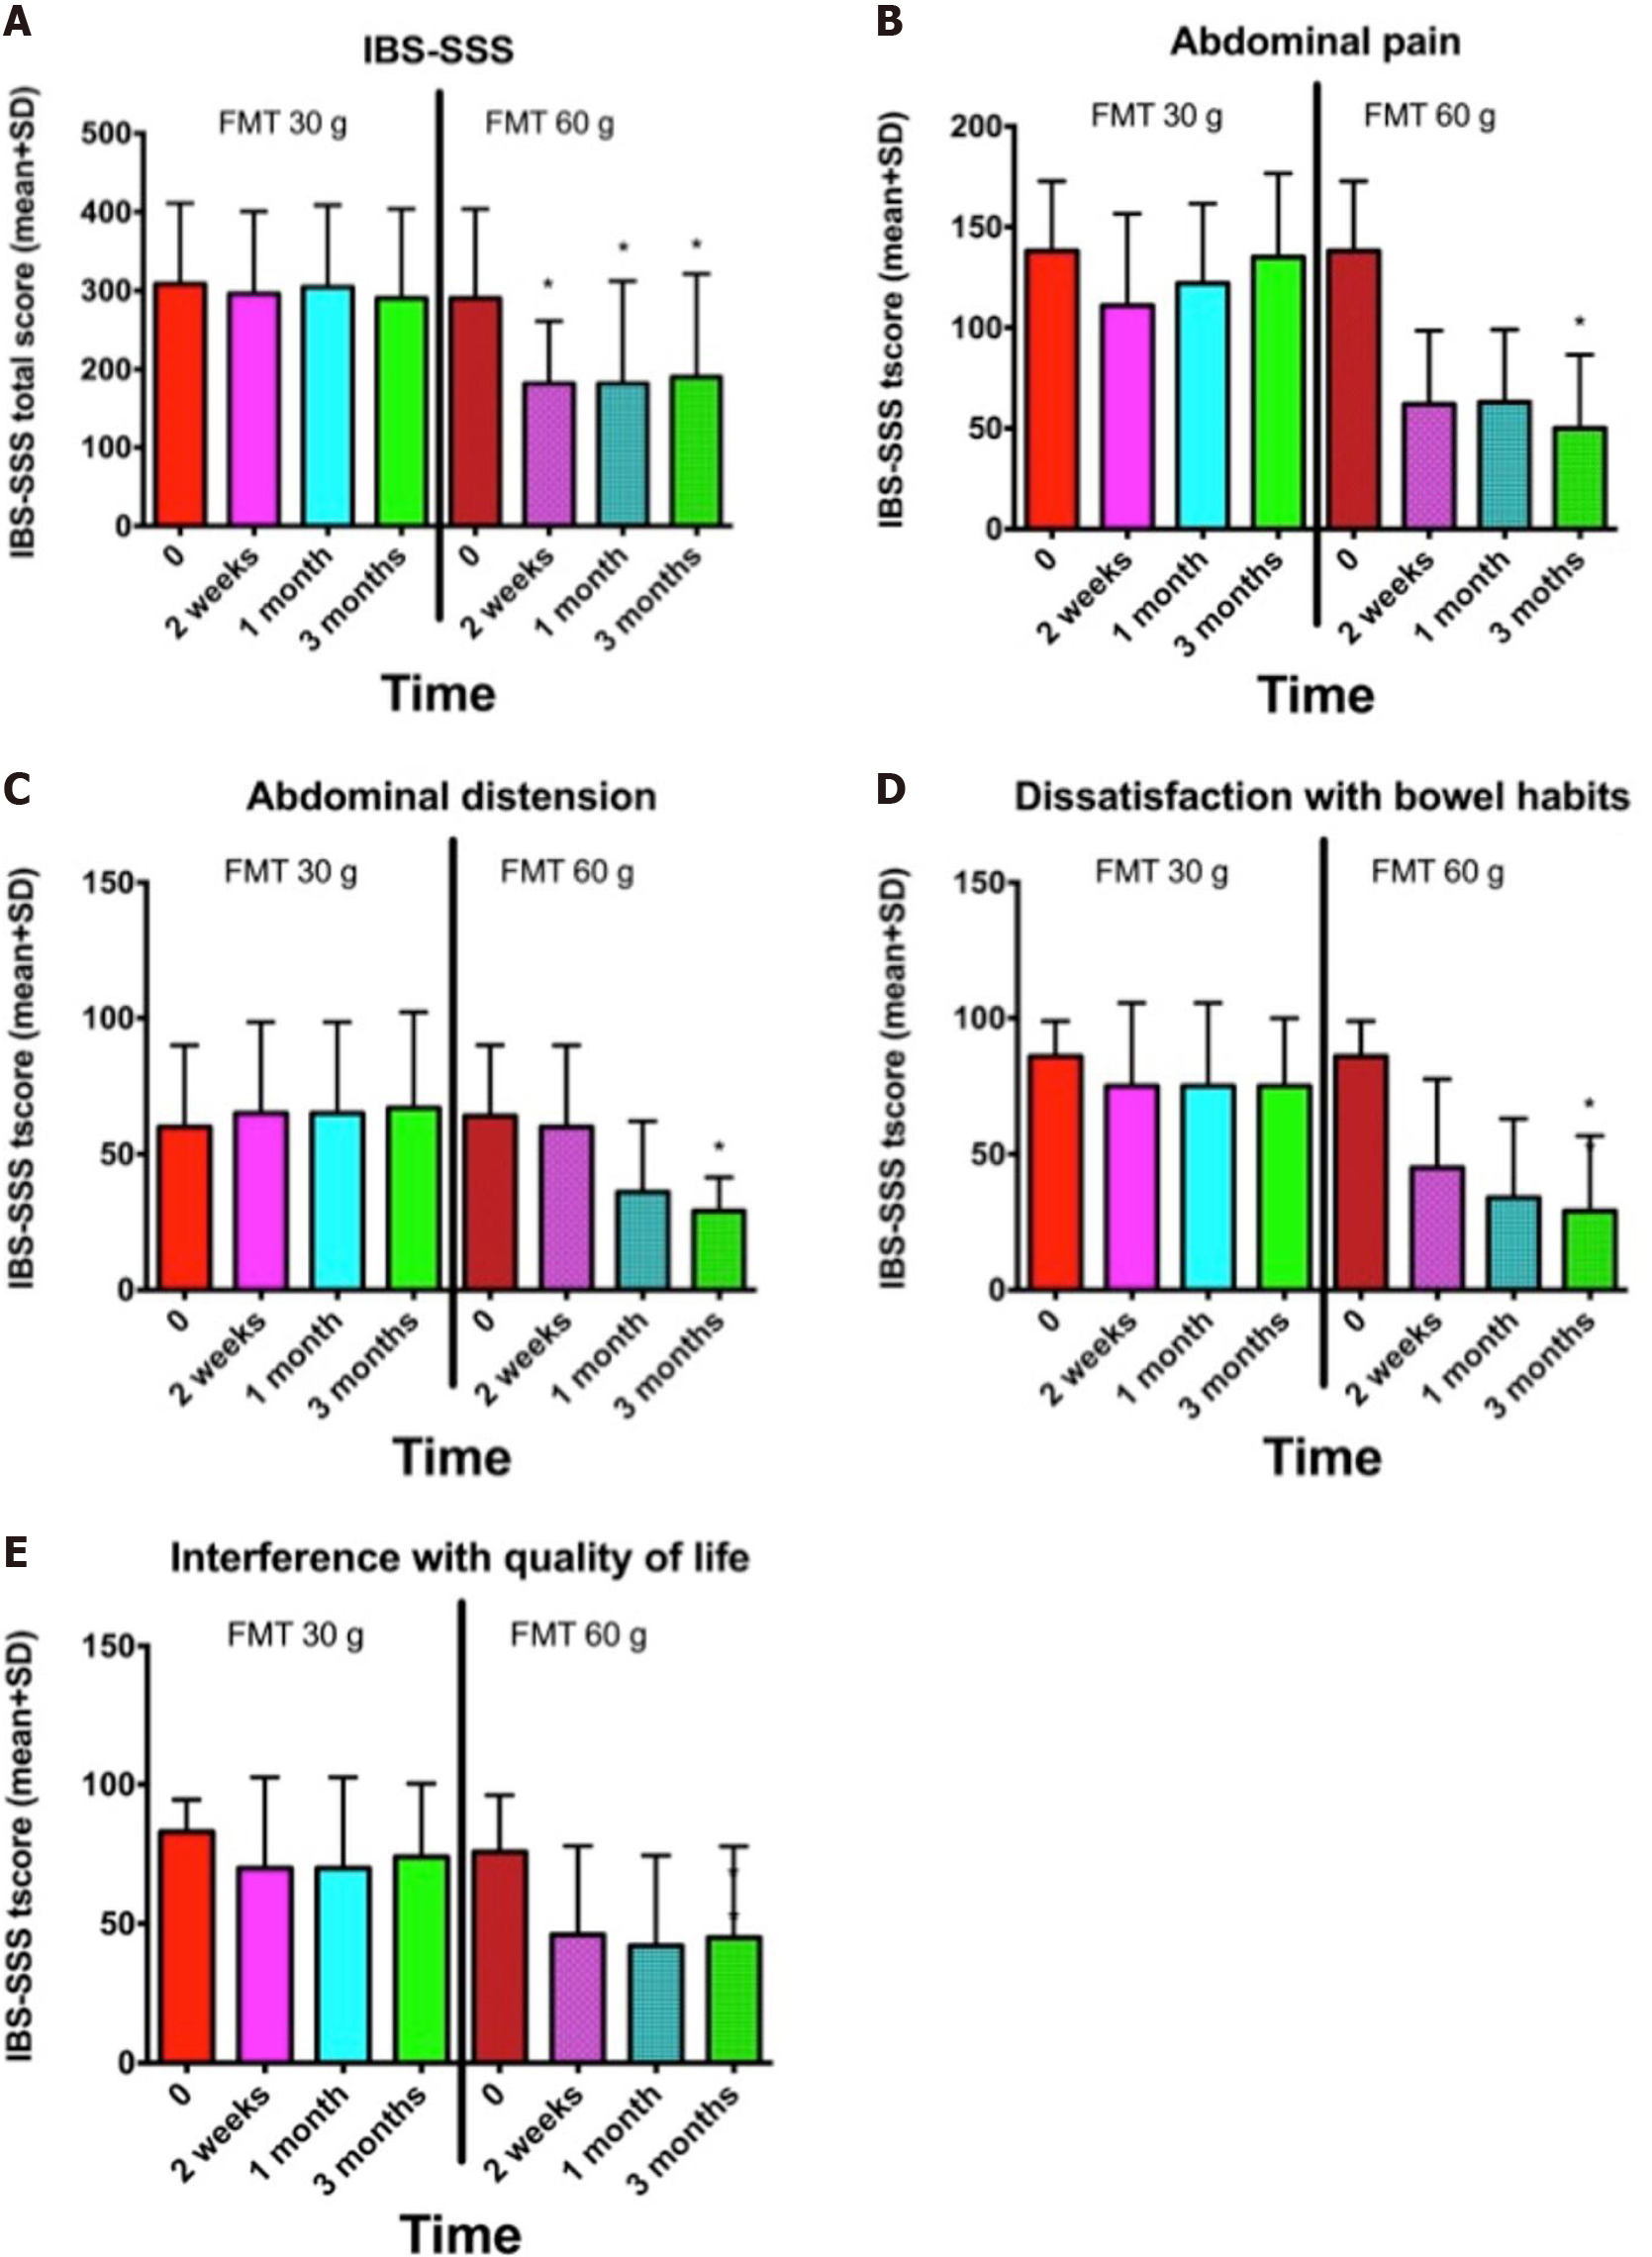
Figure 4 Nonresponders to 30-g donor`s fecal transplant were retransplanted with 60-g donor´s transplant.
A-E: Irritable bowel syndrome-severity scoring system (SSS) total score (A) and IBS-SSS scores for abdominal pain (B), abdominal distension (C), dissatisfaction with bowel habits (D), and interference with quality of life (E) at different intervals after receiving 30-g and 60-g fecal microbiota transplantation. *P < 0.05 compared with baseline. Citation: El-Salhy M, Hausken T, Hatlebakk JG. Increasing the Dose and/or Repeating Faecal Microbiota Transplantation (FMT) Increases the Response in Patients with Irritable Bowel Syndrome (IBS). Nutrients 2019; 11 [PMID: 31238507 DOI: 10.3390/nu11061415]54].
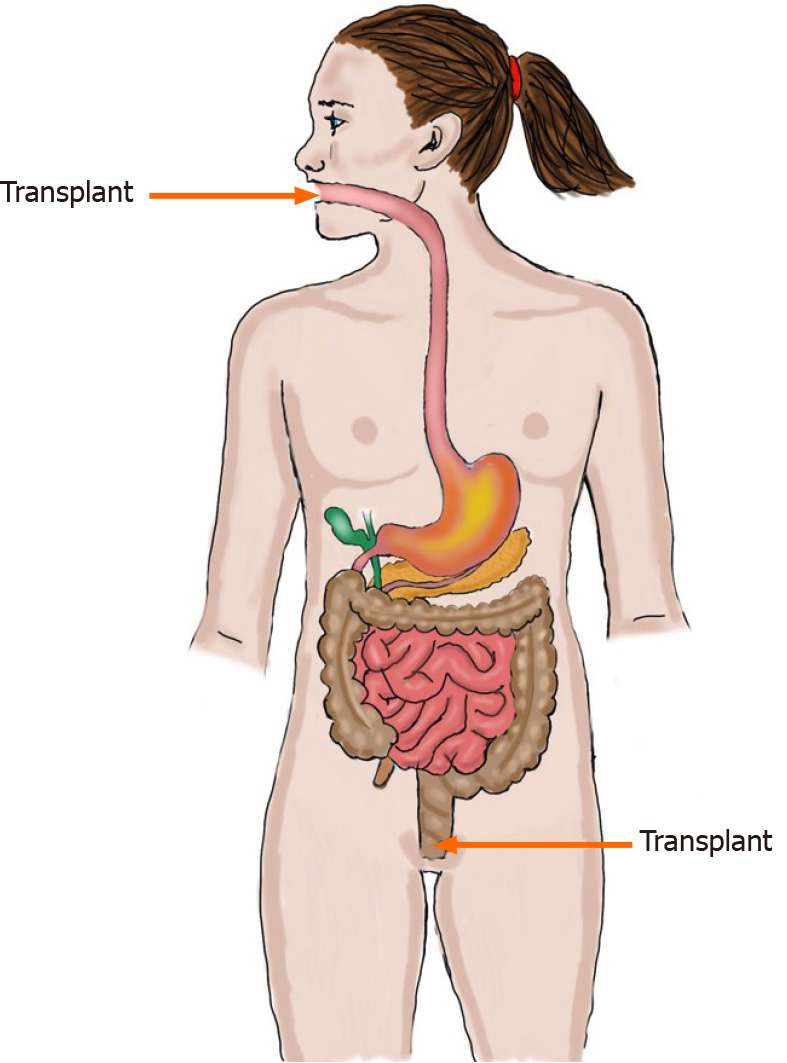
Figure 5
Fecal transplant can be administered to the small intestine (distal duodenum) or to the large intestine (colon).
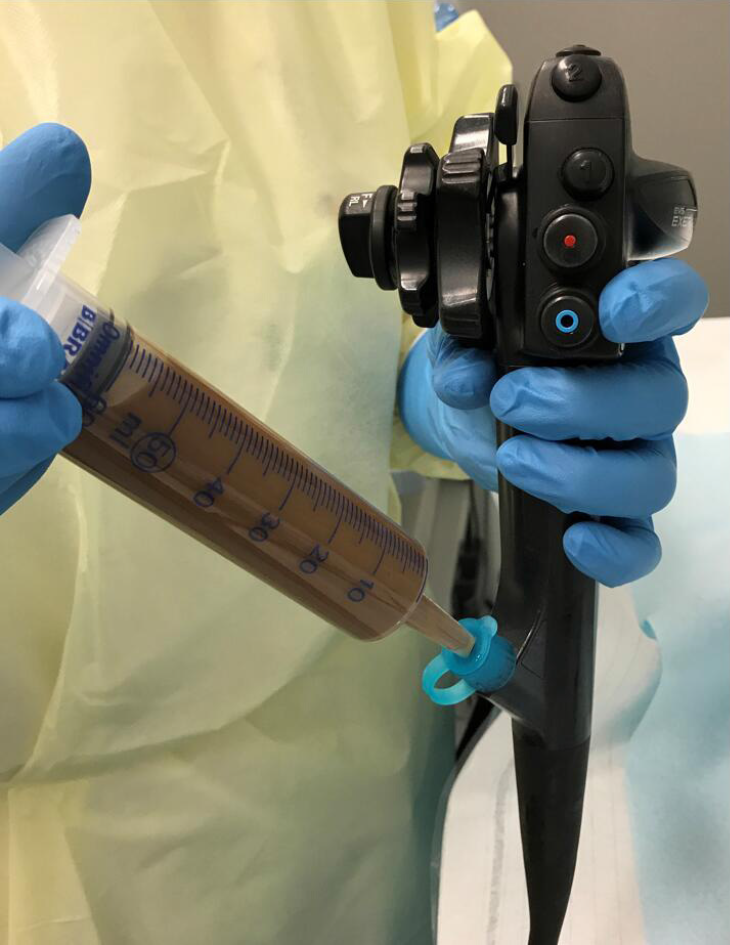
Figure 6
Although the fecal transplant can be administered to the small intestine via a nasojejunal probe and to the colon via an enema, administering a fecal transplant via the working channel of a gastroscope or colonoscope is faster and more acceptable to patients.
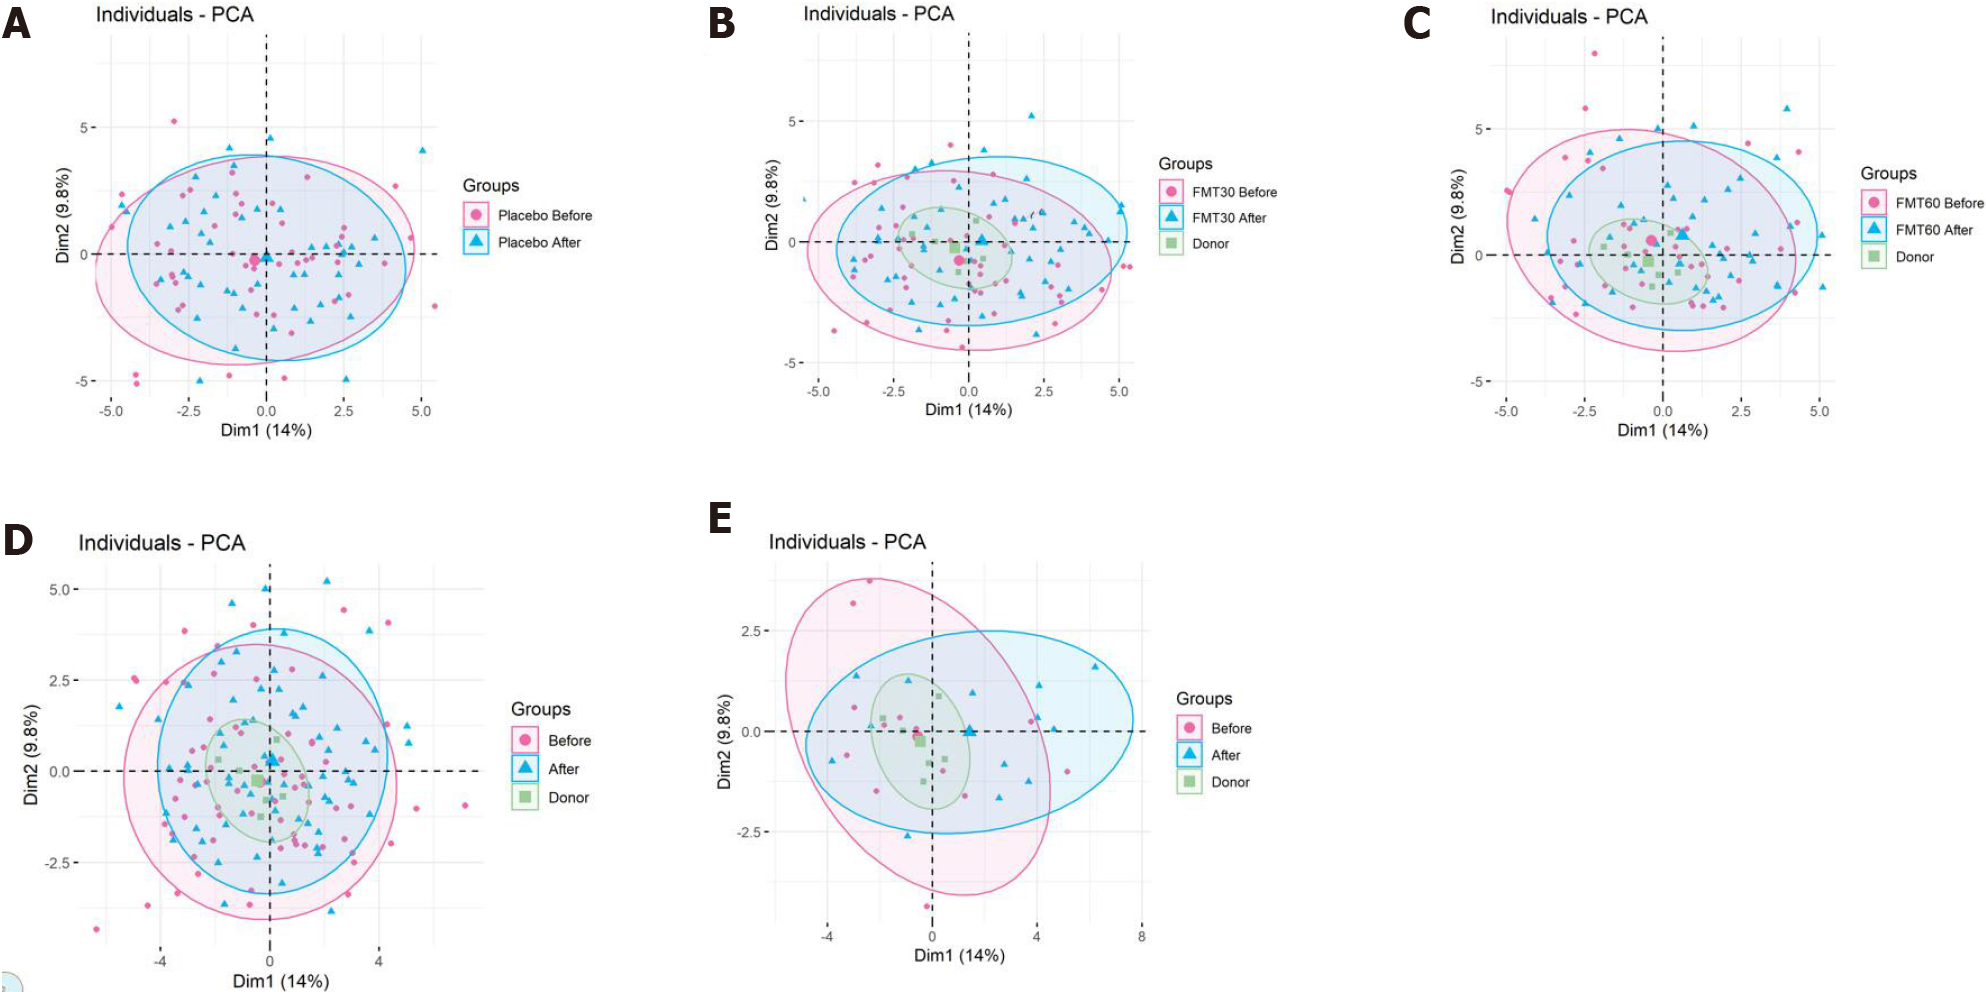
Figure 7 Scaled principal component analysis plot of fecal samples before and 1 mo after transplantation for placebo, 30-g and 60-g fecal microbiota transplantation, responders and nonresponders.
A: Placebo; B: 30-g fecal microbiota transplantation (FMT); C: 60-g FMT; D: Responders; E: Nonresponders. Fecal samples before and after transplantation are indicated by pink circles and blue triangles, respectively. The ellipses cover 80% of the samples within a group. Citation: El-Salhy M, Hatlebakk JG, Gilja OH, Bråthen Kristoffersen A, Hausken T. Efficacy of faecal microbiota transplantation for patients with irritable bowel syndrome in a randomised, double-blind, placebo-controlled study. Gut 2020; 69: 859-867. Copyright @BMJ Publishing Group Ltd 2020. Published by BMJ Publishing Group Ltd[11].
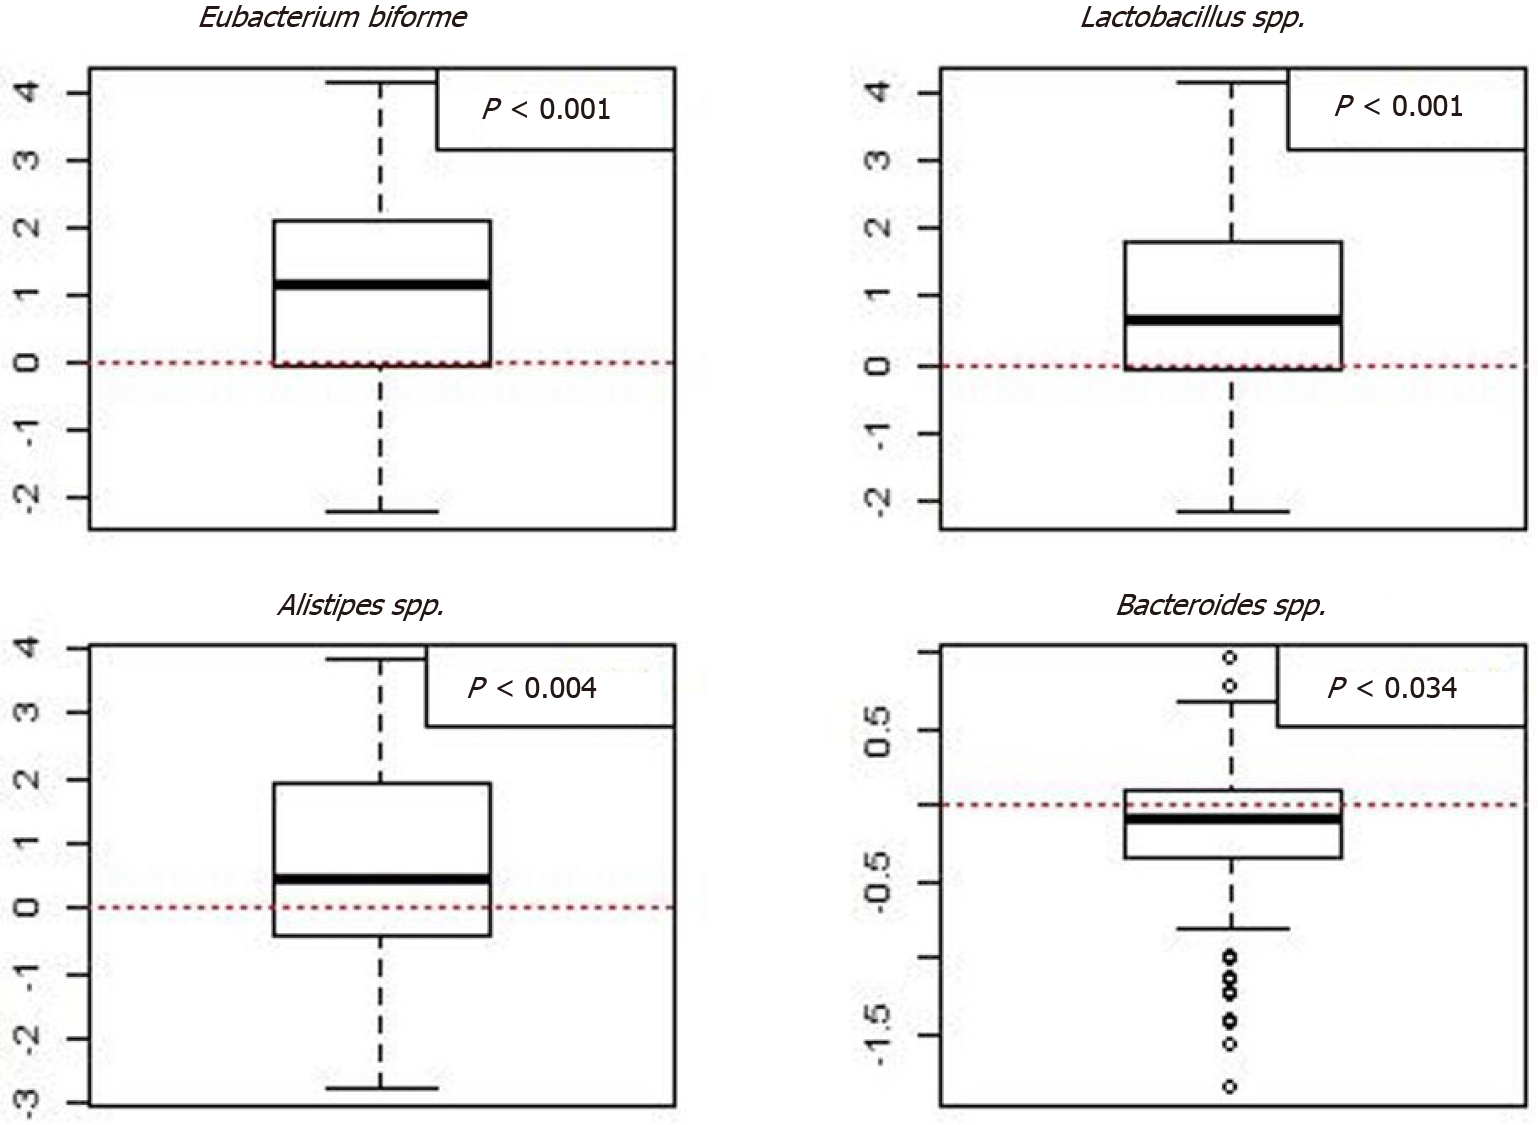
Figure 8 Box plots of the logarithm of the difference in signals between baseline and 1 mo after fecal microbiota transplantation for the responders in both the 30-g and 60-g fecal microbiota transplantation groups.
Red stippled line indicates 0, where no change occurred between before and after fecal microbiota transplantation (FMT). Signals after FMT in responders were higher for Eubacterium biforme, Lactobacillus spp., and Alistipes spp., and lower for Bacteroides spp. Citation: El-Salhy M, Hatlebakk JG, Gilja OH, Bråthen Kristoffersen A, Hausken T. Efficacy of faecal microbiota transplantation for patients with irritable bowel syndrome in a randomised, double-blind, placebo-controlled study. Gut 2020; 69: 859-867. Copyright @BMJ Publishing Group Ltd 2020. Published by BMJ Publishing Group Ltd[11].
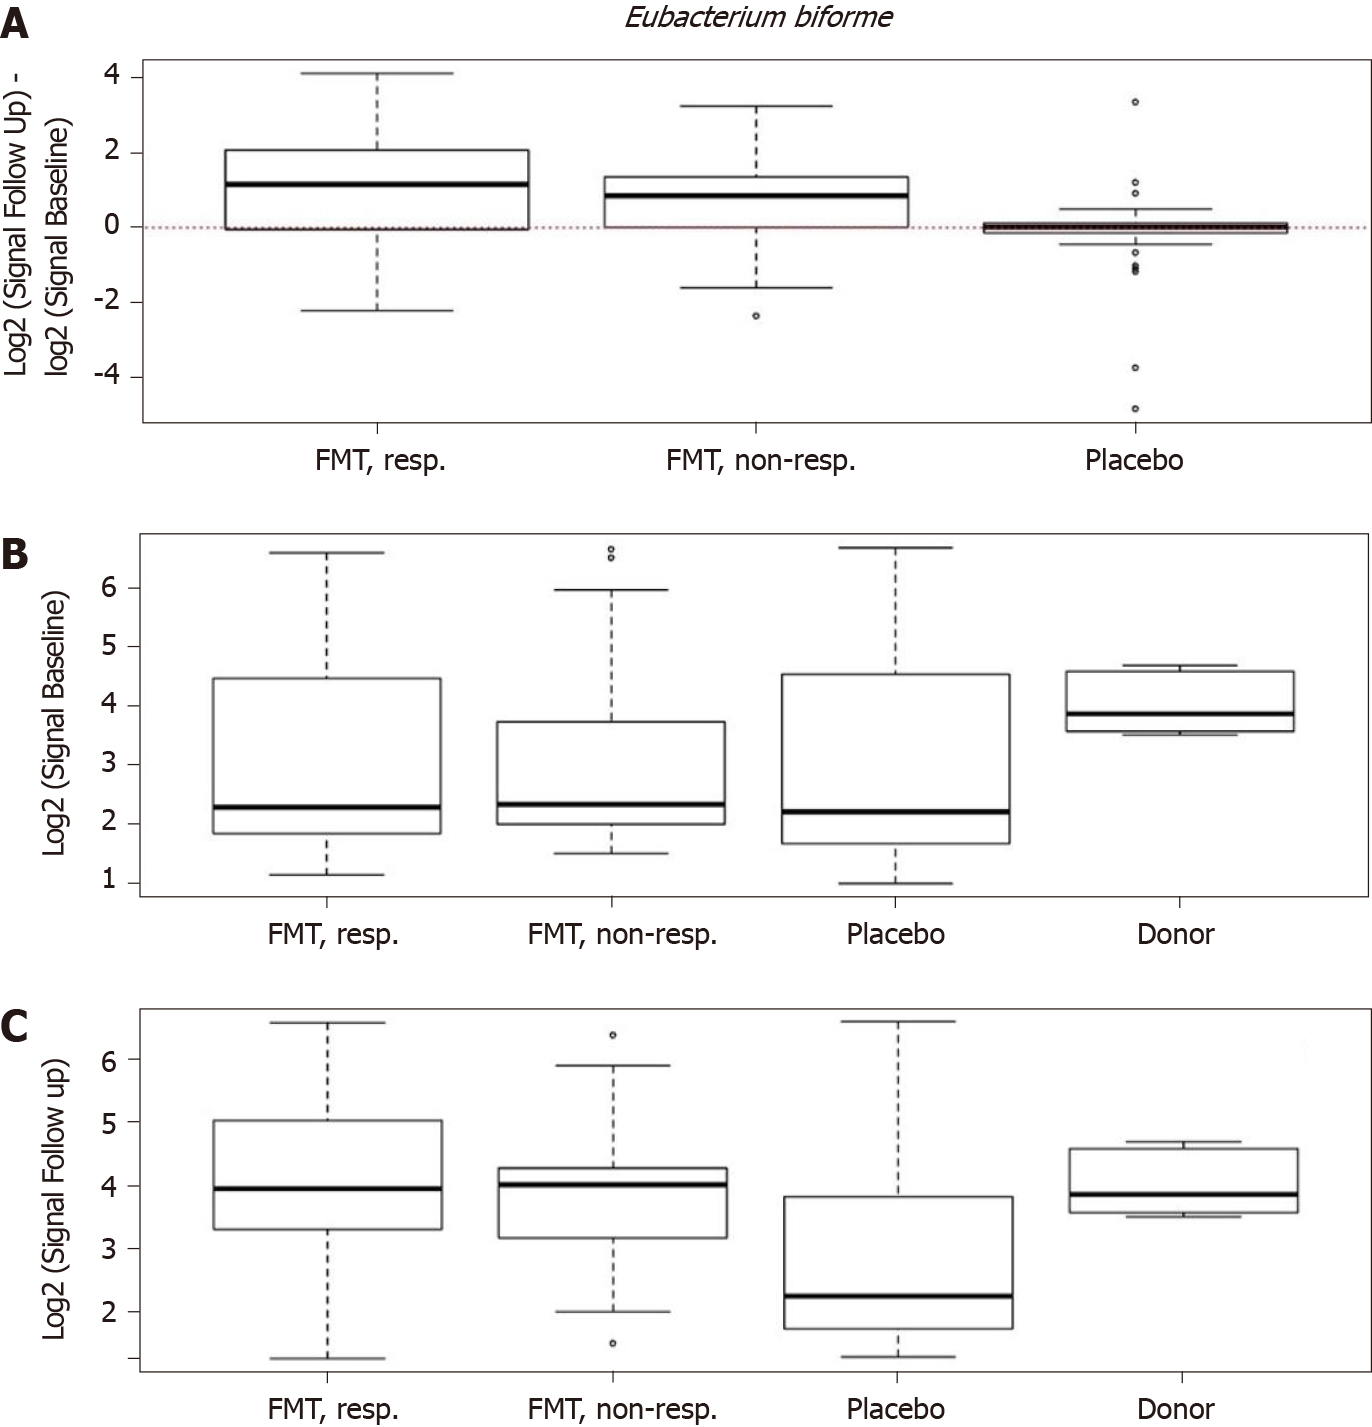
Figure 9 Differences in signals for Eubacterium biforme in the responder, nonresponder, and placebo groups between before and 1 mo after transplantation.
There were significant changes in the signal levels in responders (P < 0.001). The nonresponders also exhibited increased signal levels, though the changes were smaller than those in the responders. A: The signal level did not change in the placebo group; B: Signal levels at baseline were similar in the responder, nonresponder, and placebo groups, but they were higher for the superdonor; C: The signal levels in the responders and nonresponders became as high as that for the superdonor after fecal microbiota transplantation, while that in the placebo group did not change.
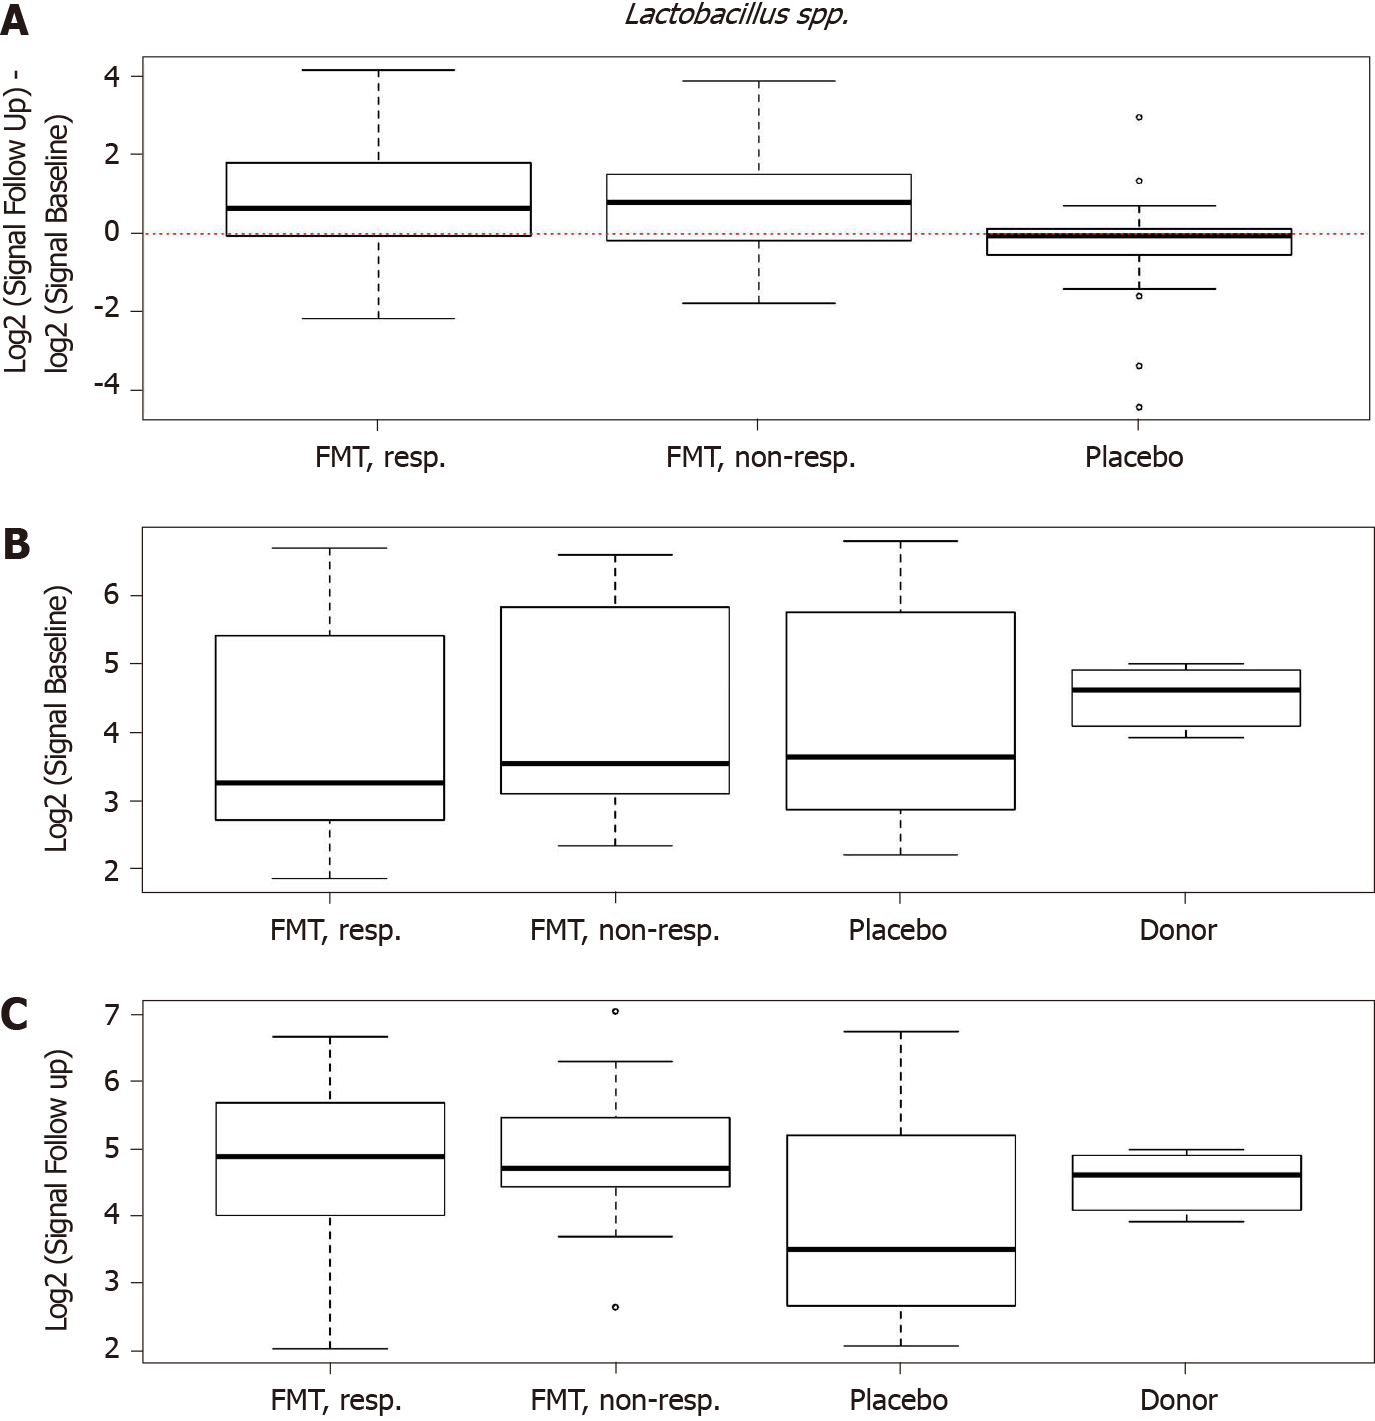
Figure 10 Differences in signals for Lactobacillus spp.
in the responder, nonresponder, and placebo groups between before and 1 mo after transplantation. There were significant changes in the signal levels in responders (P < 0.001). A: The nonresponders exhibited similar signal levels to those in the responders, while there was no change in the placebo group; B: The signal levels in the responder, nonresponder, and placebo groups were similar, but it was higher for the superdonor; C: After transplantation, the signal levels in responders and nonresponders became similar to that for the superdonor, while that in the placebo group did not differ from the baselin. Citation: El-Salhy M, Hatlebakk JG, Gilja OH, Bråthen Kristoffersen A, Hausken T. Efficacy of faecal microbiota transplantation for patients with irritable bowel syndrome in a randomised, double-blind, placebo-controlled study. Gut 2020; 69: 859-867. Copyright @BMJ Publishing Group Ltd 2020. Published by BMJ Publishing Group Ltd[11].
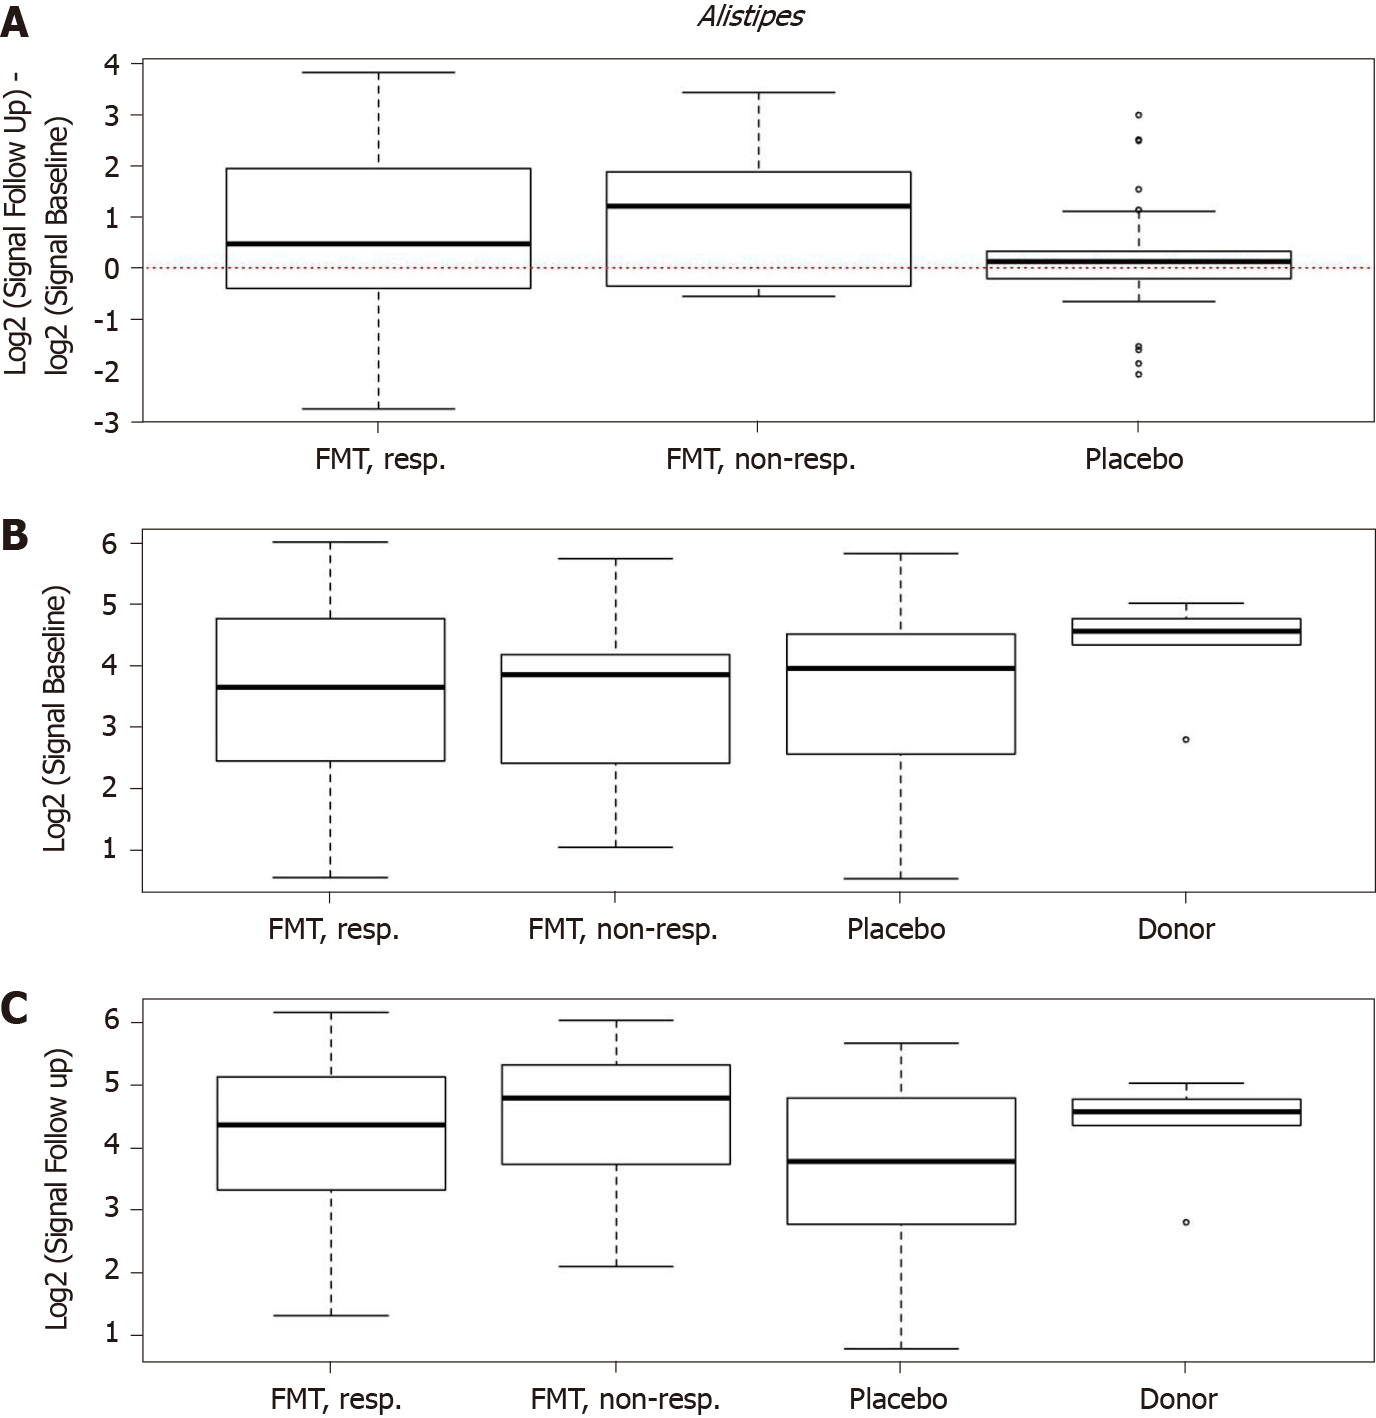
Figure 11 Changes in signals for Alistipes spp.
in responders, nonresponders, and placebo groups as well as in the donor. A: Differences in signals for Alistipes spp. between before and 1 mo after transplantation in the responder, nonresponder, and placebo groups; B: There were significant changes in the signals level in responders (P = 0.004). The signal levels also changed in nonresponders, but they did not change in the placebo group. Signal levels at baseline in the responder, nonresponder, and placebo groups as well as the superdonor; C: The baseline signal levels were similar in the responder, nonresponder, and placebo groups, while that for the superdonor was higher. Signal levels in the responder, nonresponder, and placebo groups and the superdonor after transplantation. The signal levels were similar in responders, nonresponders and the superdonor, while it was lower in the placebo group. Citation: El-Salhy M, Hatlebakk JG, Gilja OH, Bråthen Kristoffersen A, Hausken T. Efficacy of faecal microbiota transplantation for patients with irritable bowel syndrome in a randomised, double-blind, placebo-controlled study. Gut 2020; 69: 859-867. Copyright @BMJ Publishing Group Ltd 2020. Published by BMJ Publishing Group Ltd[11].
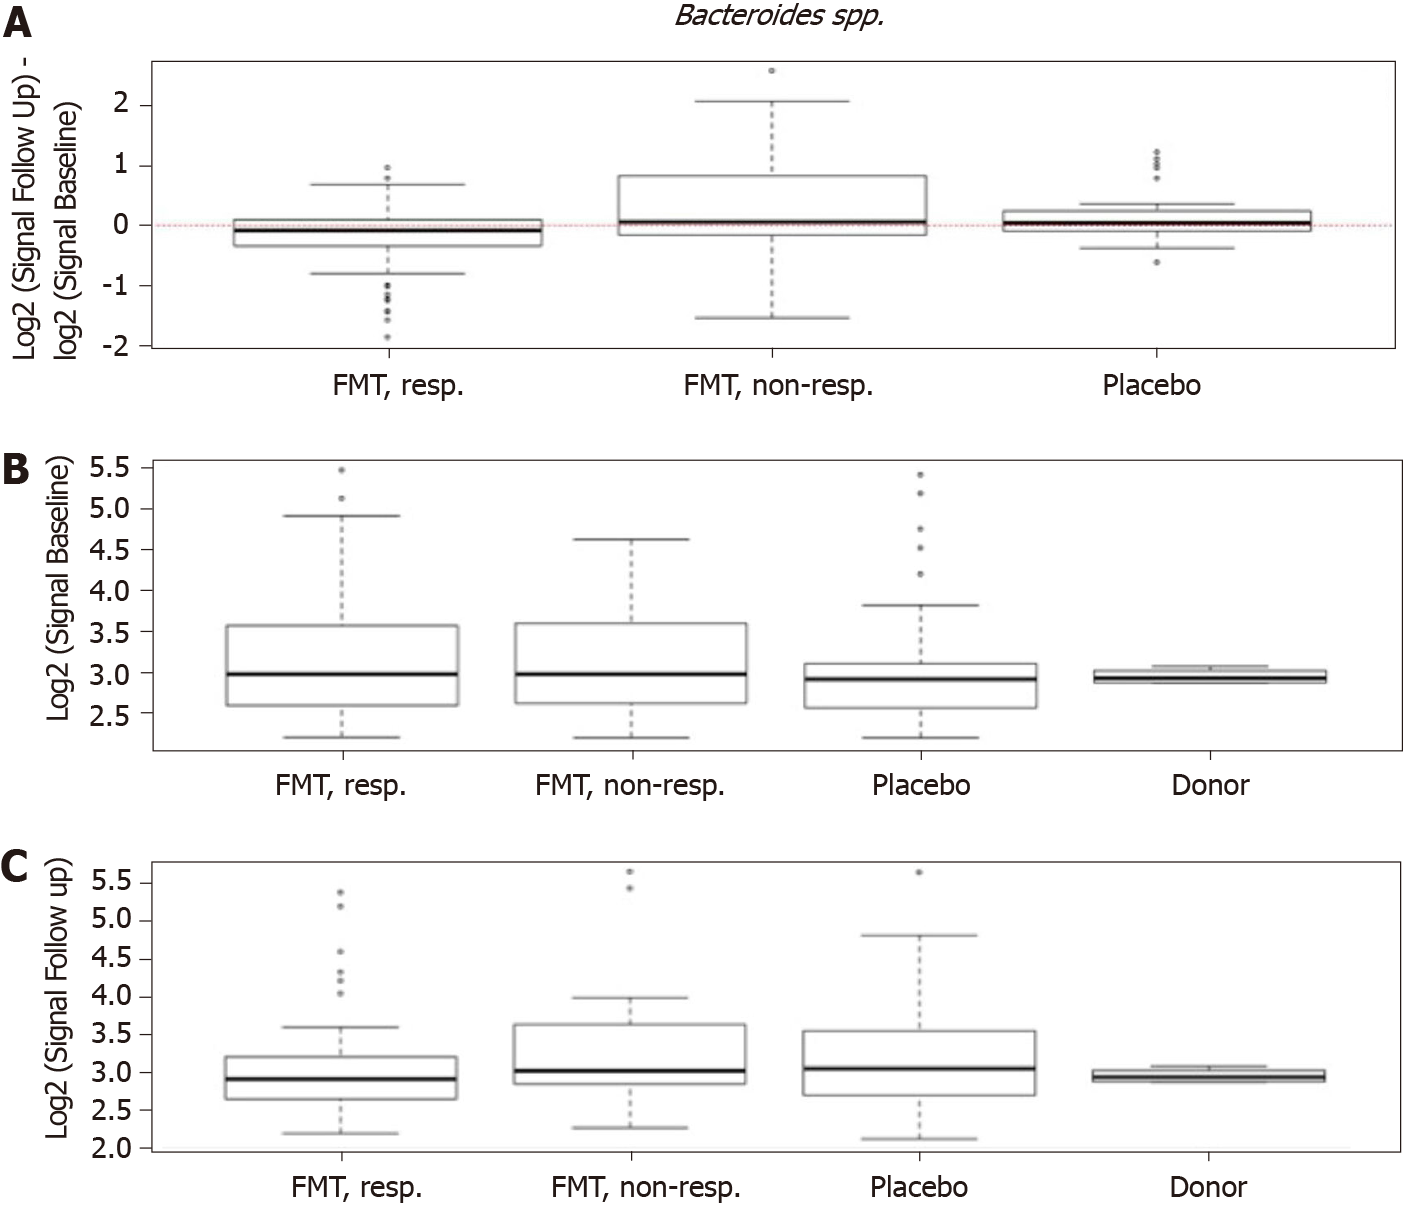
Figure 12 Changes in signals for Bacteroides spp.
in responders, nonresponders, and placebo groups as well as in the donor. A: Differences in signals for Bacteroides spp. between before and 1 mo after fecal microbiota transplantation in the responder, nonresponder, and placebo groups; B: There were significant changes in the signal levels in responders (P < 0.034). The nonresponders showed similar changes, while there were no changes observed in the placebo group. Signal levels at baseline in the responder, nonresponder, and placebo groups and for the superdonor; C: The baseline signal levels were similar in the responder, nonresponder, and placebo groups, and both higher and lower than those for the superdonor. Signal levels in the same groups after transplantation. Citation: El-Salhy M, Hatlebakk JG, Gilja OH, Bråthen Kristoffersen A, Hausken T. Efficacy of faecal microbiota transplantation for patients with irritable bowel syndrome in a randomised, double-blind, placebo-controlled study. Gut 2020; 69: 859-867. Copyright @BMJ Publishing Group Ltd 2020. Published by BMJ Publishing Group Ltd[11].
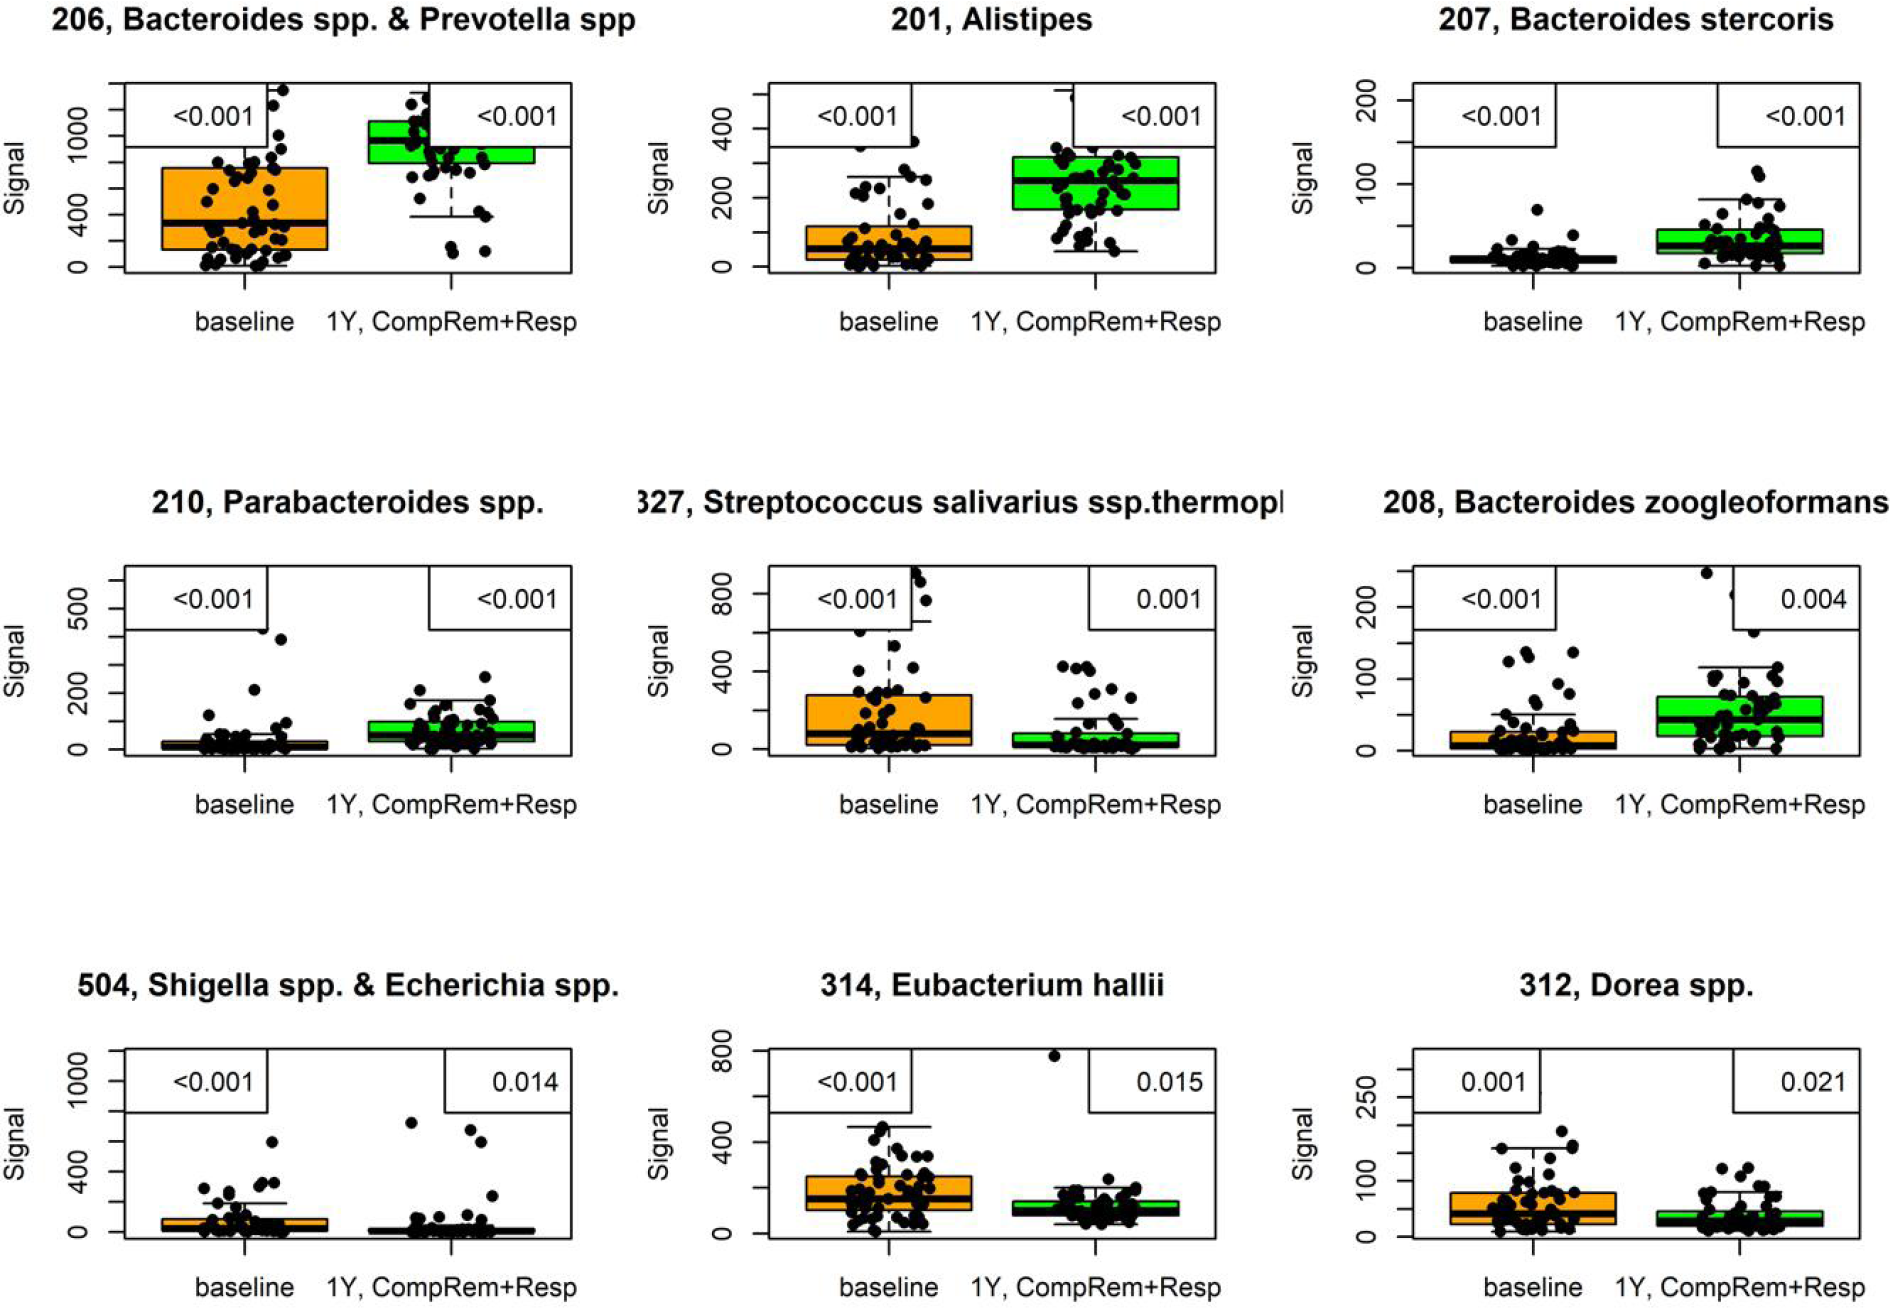
Figure 13 Signals of nine bacteria had changed at 1 year after fecal microbiota transplantation in irritable bowel syndrome patients that either maintained a response or experienced complete remission.
P values are in the upper-left corner, with corrected P values in the upper-right corner. This figure is based on unpublished data from El-Salhy et al.
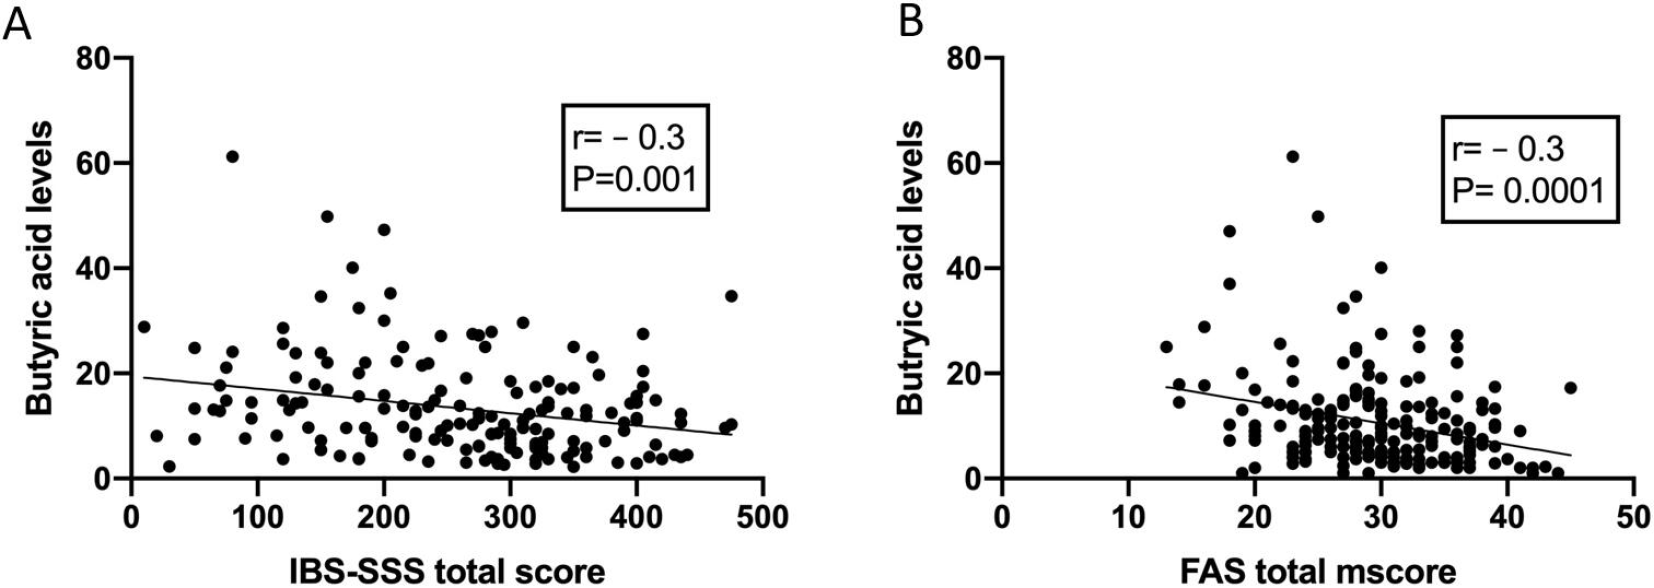
Figure 14 The correlation between butyric acid levels and IBS symptoms and fatigue 1 mo after fecal transplation.
A and B: Correlations between butyric acid levels and irritable bowel syndrome-severity scoring system total scores (A) and fatigue assessment total score (B). Citation: El-Salhy M, Hausken T, Hatlebakk JG. Increasing the Dose and/or Repeating Faecal Microbiota Transplantation (FMT) Increases the Response in Patients with Irritable Bowel Syndrome (IBS). El-Salhy M, Valeur J, Hausken T, Gunnar Hatlebakk J. Changes in fecal short-chain fatty acids following fecal microbiota transplantation in patients with irritable bowel syndrome. Neurogastroenterol Motil 2021; 33: e13983 [PMID: 32945066 DOI: 10.1111/nmo.13983][55].
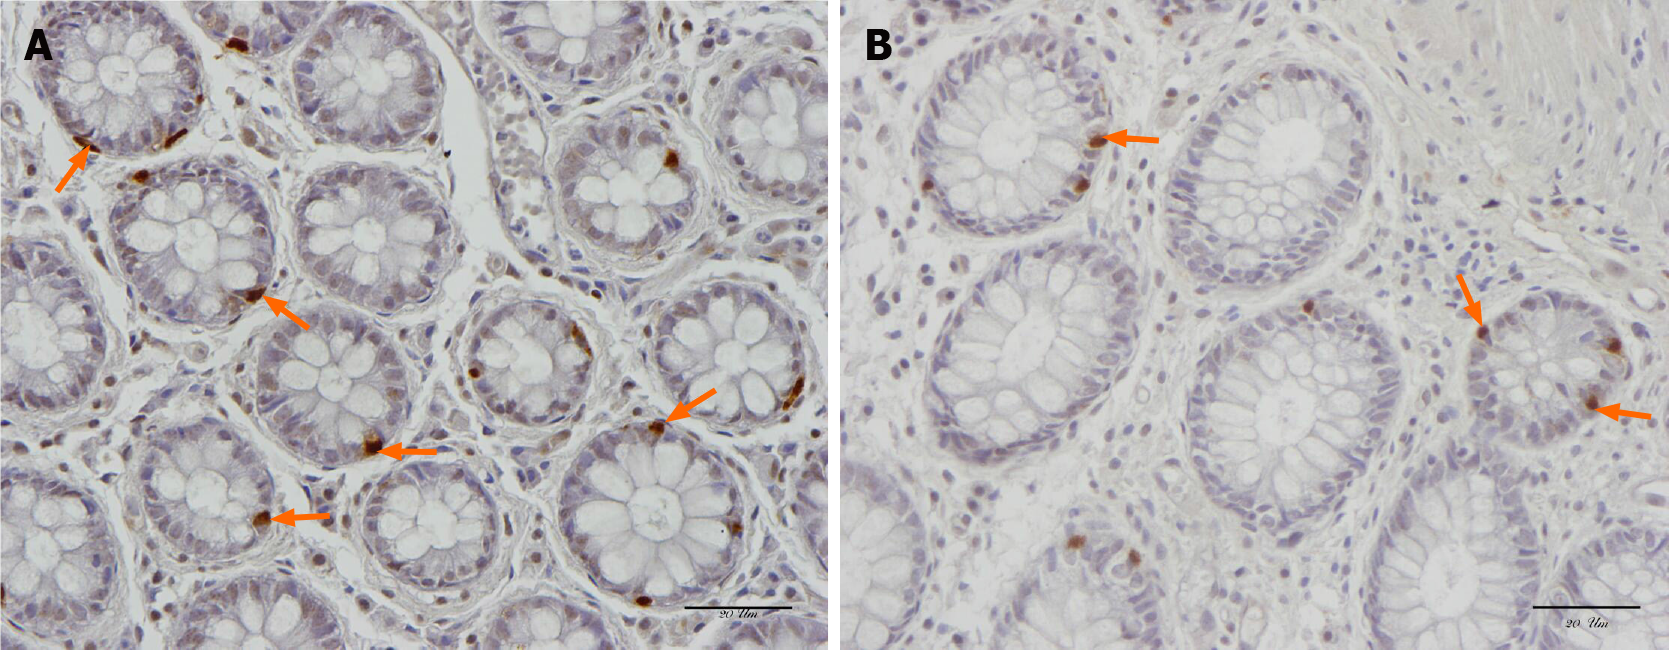
Figure 15 Serotonin-immunoreactive cells (arrows) in the colon of a healthy subject and in a patient with irritable bowel syndrome.
A: Healthy subject; B: Patient with irritable bowel syndrome.
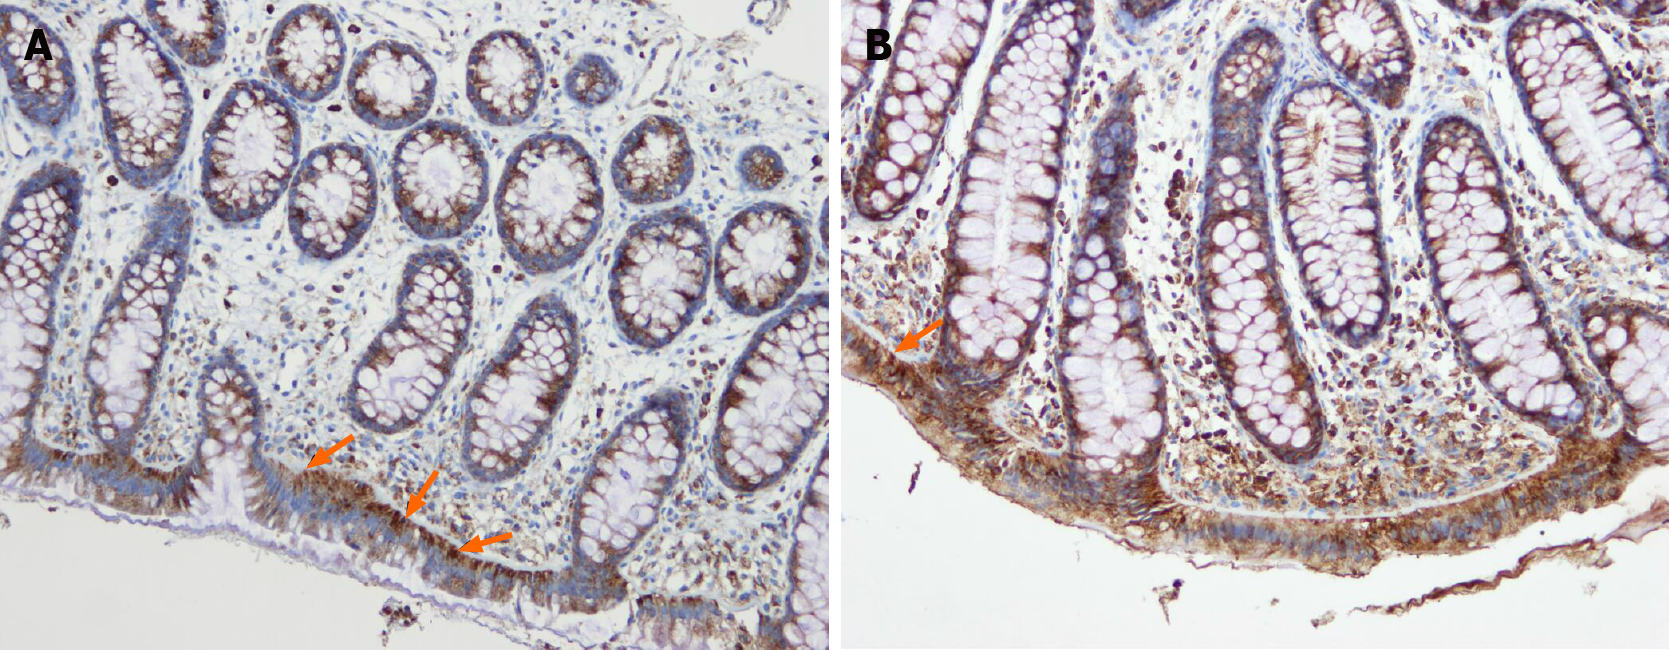
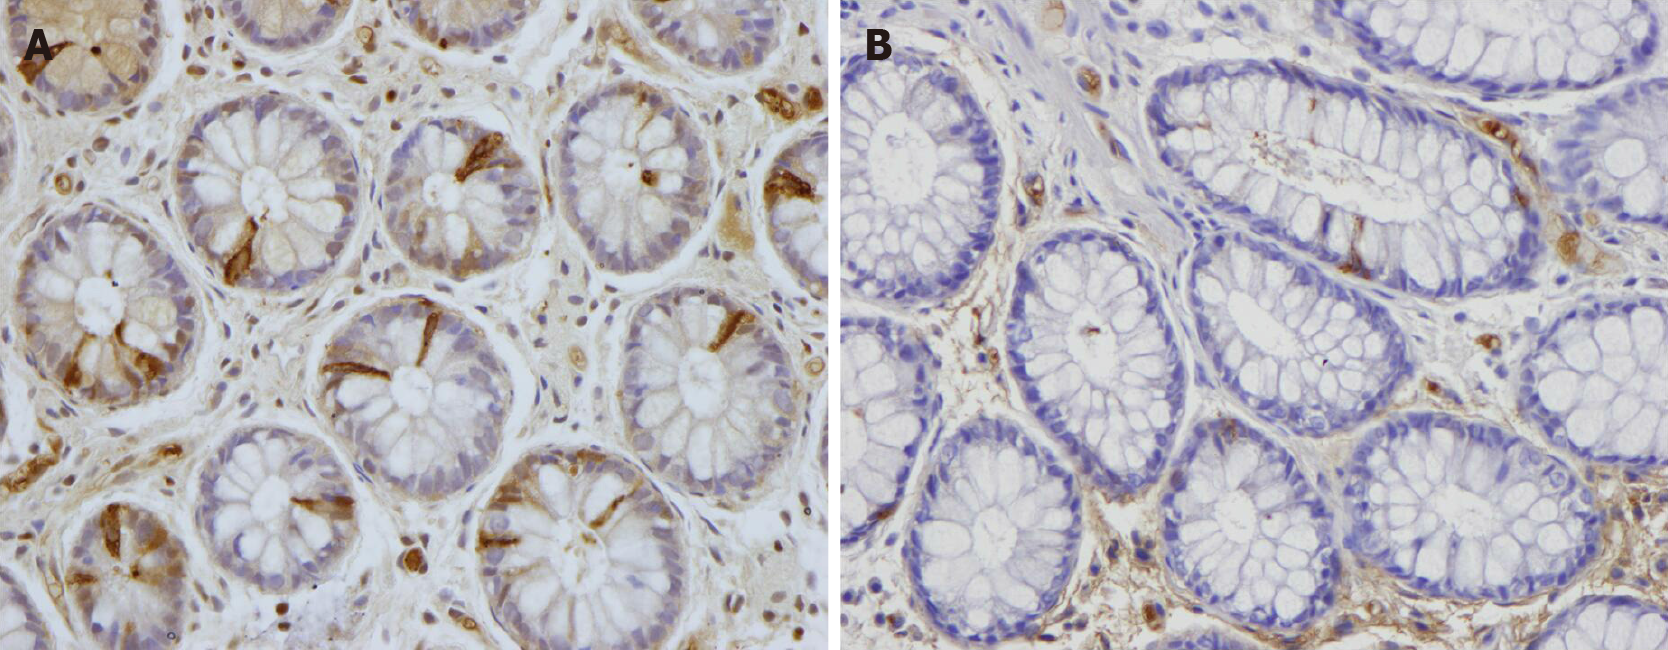
Figure 16 Difference in serotonin selective reuptake transporter immunoreactivity between a healthy subject and a patient with irritable bowel syndrome.
A and B: Serotonin selective reuptake transporter immunoreactivity in the cytoplasm of the epithelial cells lining the rectal lumen (arrows) of a healthy subject (A) and of an irritable bowel syndrome patient (B).
Figure 17 Peptide YY immunoreactivity (arrows) in the colon of a healthy subject and in a patient with irritable bowel syndrome.
A: Healthy subject; B: Patient with irritable bowel syndrome.
- Citation: El-Salhy M, Patcharatrakul T, Gonlachanvit S. Fecal microbiota transplantation for irritable bowel syndrome: An intervention for the 21st century. World J Gastroenterol 2021; 27(22): 2921-2943
- URL: https://www.wjgnet.com/1007-9327/full/v27/i22/2921.htm
- DOI: https://dx.doi.org/10.3748/wjg.v27.i22.2921


