Copyright
©The Author(s) 2021.
World J Gastroenterol. Jun 7, 2021; 27(21): 2871-2894
Published online Jun 7, 2021. doi: 10.3748/wjg.v27.i21.2871
Published online Jun 7, 2021. doi: 10.3748/wjg.v27.i21.2871
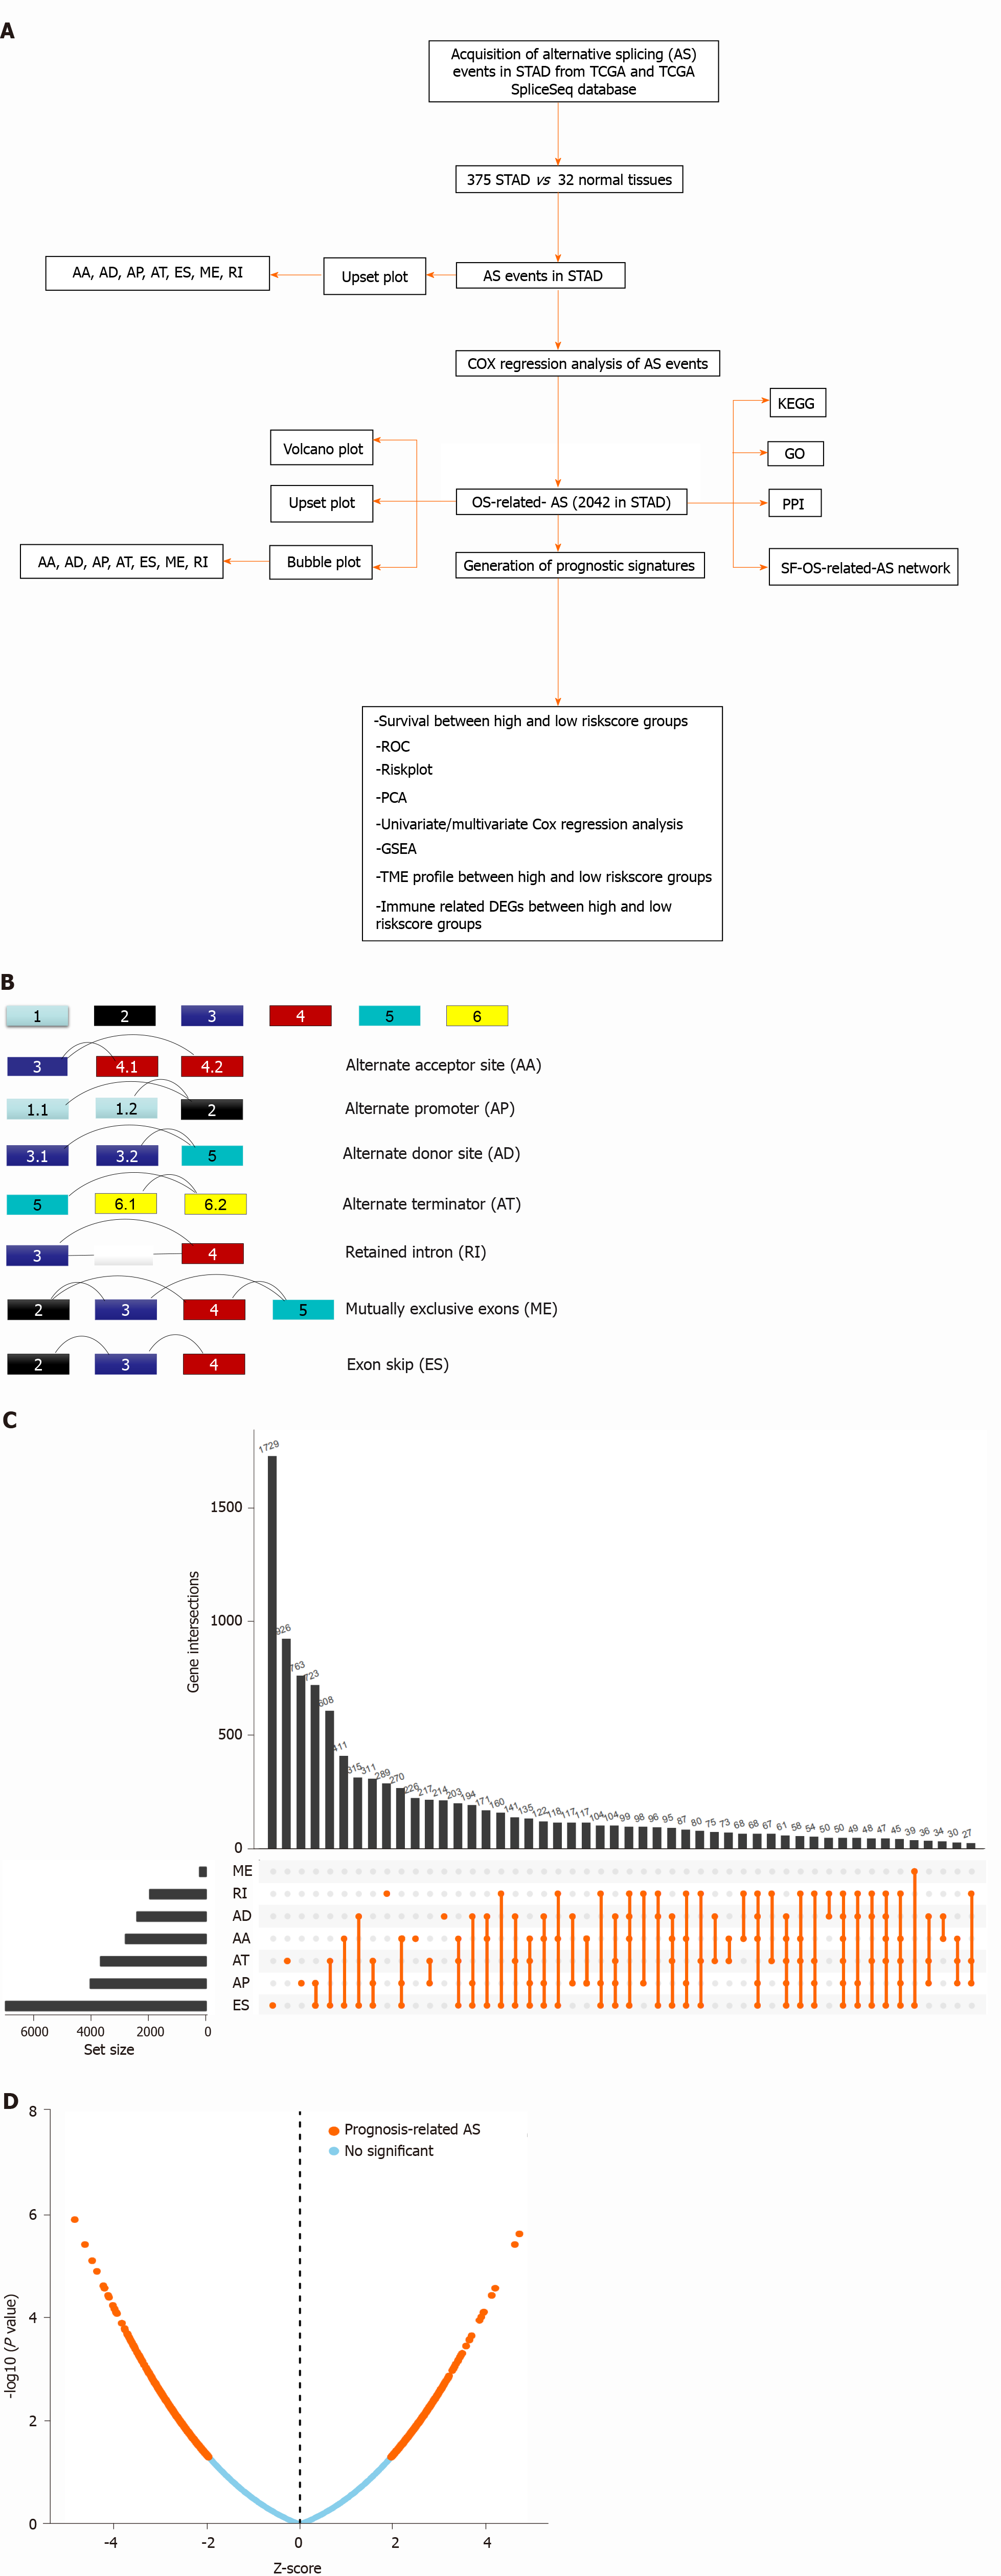
Figure 1 Overview of alternative splicing events profiling in stomach adenocarcinoma.
A: The flow chart for identification of overall survival (OS)-related alternative splicing (AS) signatures in stomach adenocarcinoma (STAD); B: Schematic diagram of seven splicing modes; C: UpSet plot of different types of AS events in STAD; D: Volcano plot of OS-related AS events in STAD. Upregulated OS-related AS events are indicated by red points and downregulated OS-related AS events by green points. TCGA: The Cancer Genome Atlas; KEGG: Kyoto Encyclopedia of Genes and Genomes; GO: Gene Ontology; PPI: Protein-protein interaction; ES: Exon skip; AP: Alternate promoters; AT: Alternate terminators; AA: Alternate acceptors; AD: Alternate donors; RI: Retained introns; ME: Exclusive exons.
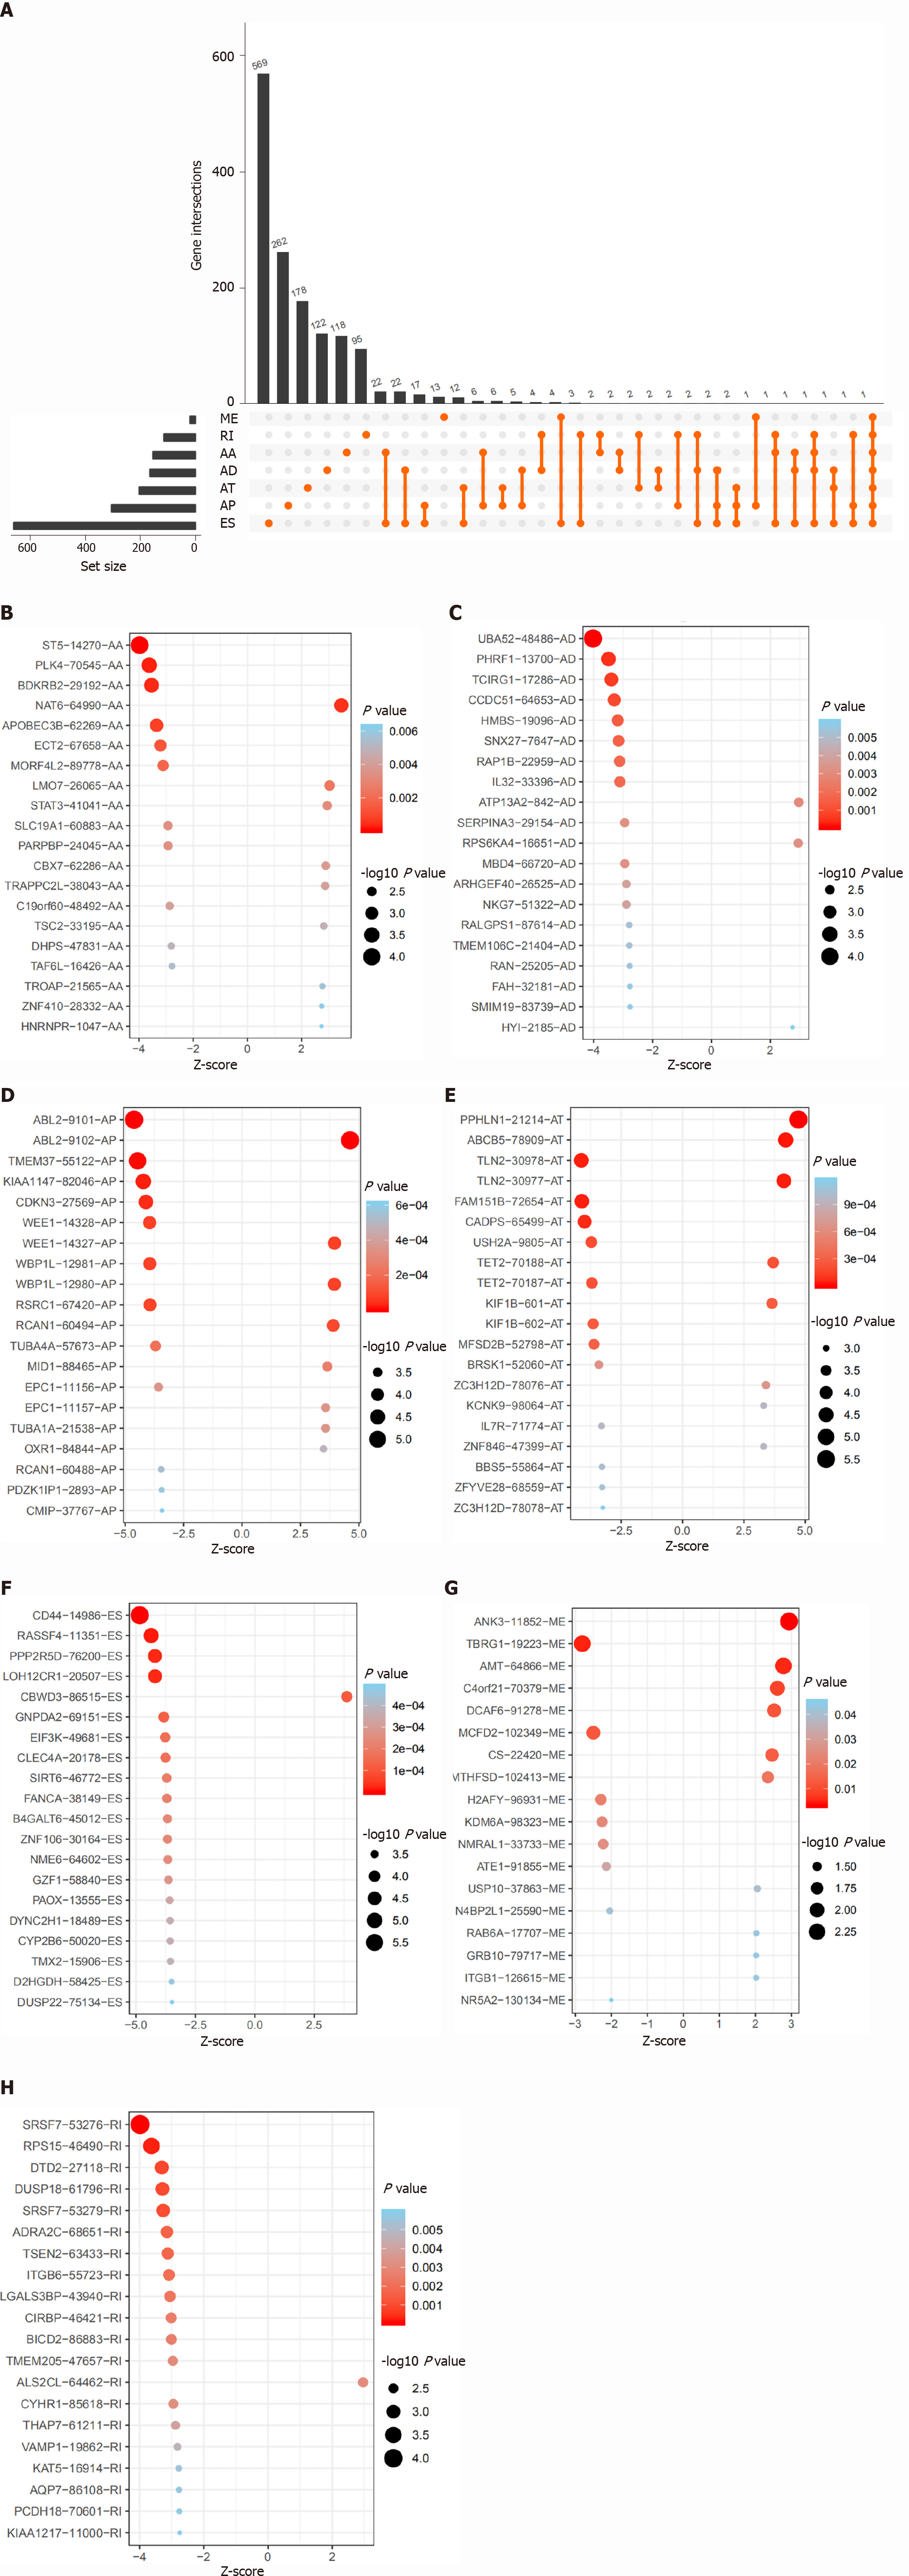
Figure 2 Overall survival-related alternative splicing events and the distribution in stomach adenocarcinoma.
A: UpSet plot of different types of overall survival (OS)-related alternative splicing (AS) events in stomach adenocarcinoma (STAD); B-H: The distribution of OS-related AS events in STAD are illustrated by the bubble plot, including exon skip, alternate promoters, alternate terminators, alternate acceptors, alternate donors, retained introns, and exclusive exons.
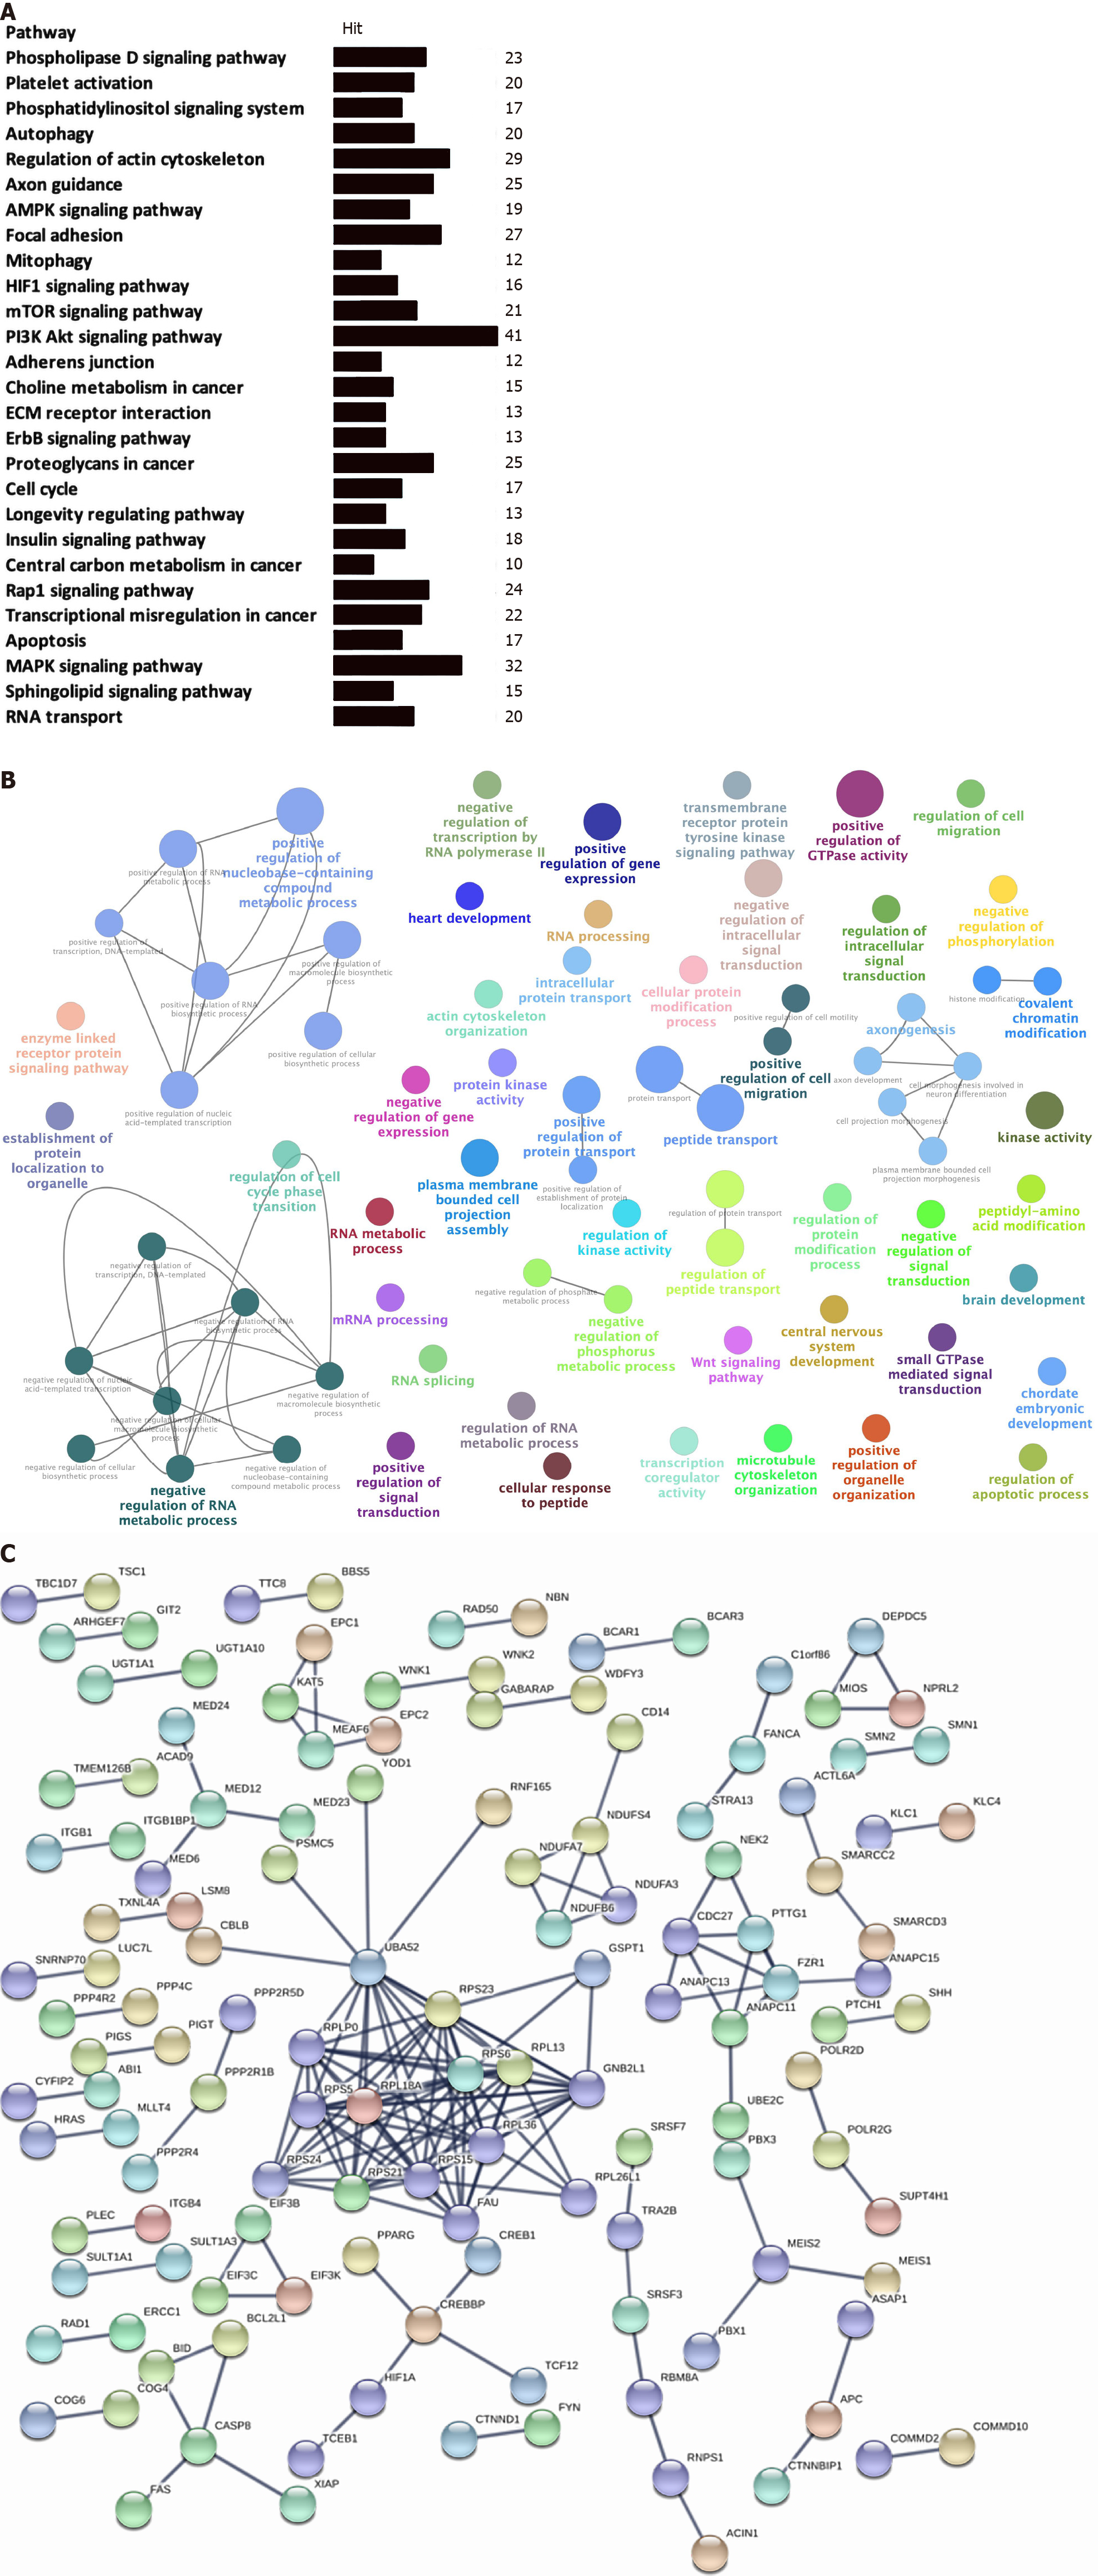
Figure 3 Functional enrichment and pathway analysis of overall survival-related alternative splicing events in stomach adenocarcinoma.
A: Kyoto Encyclopedia of Genes and Genomes pathway enrichment analysis of overall survival (OS)-related alternative splicing (AS) events in stomach adenocarcinoma (STAD) (P < 0.05); B: GO enrichment analysis (biological process) of OS-related AS events in STAD. Only gene sets with natural organic matter P < 0.05 and false discovery rate (FDR) Q < 0.05 (adjusted P value using the Benjamini-Hochberg procedure to control the FDR) were considered significant. The lower P value and higher significant enrichment are shown with the greater node size. The same color indicated the same function group. Among the groups, we chose a representative for the most significant term and lag highlighted; C: Protein-protein interaction network of OS-related AS events in STAD.
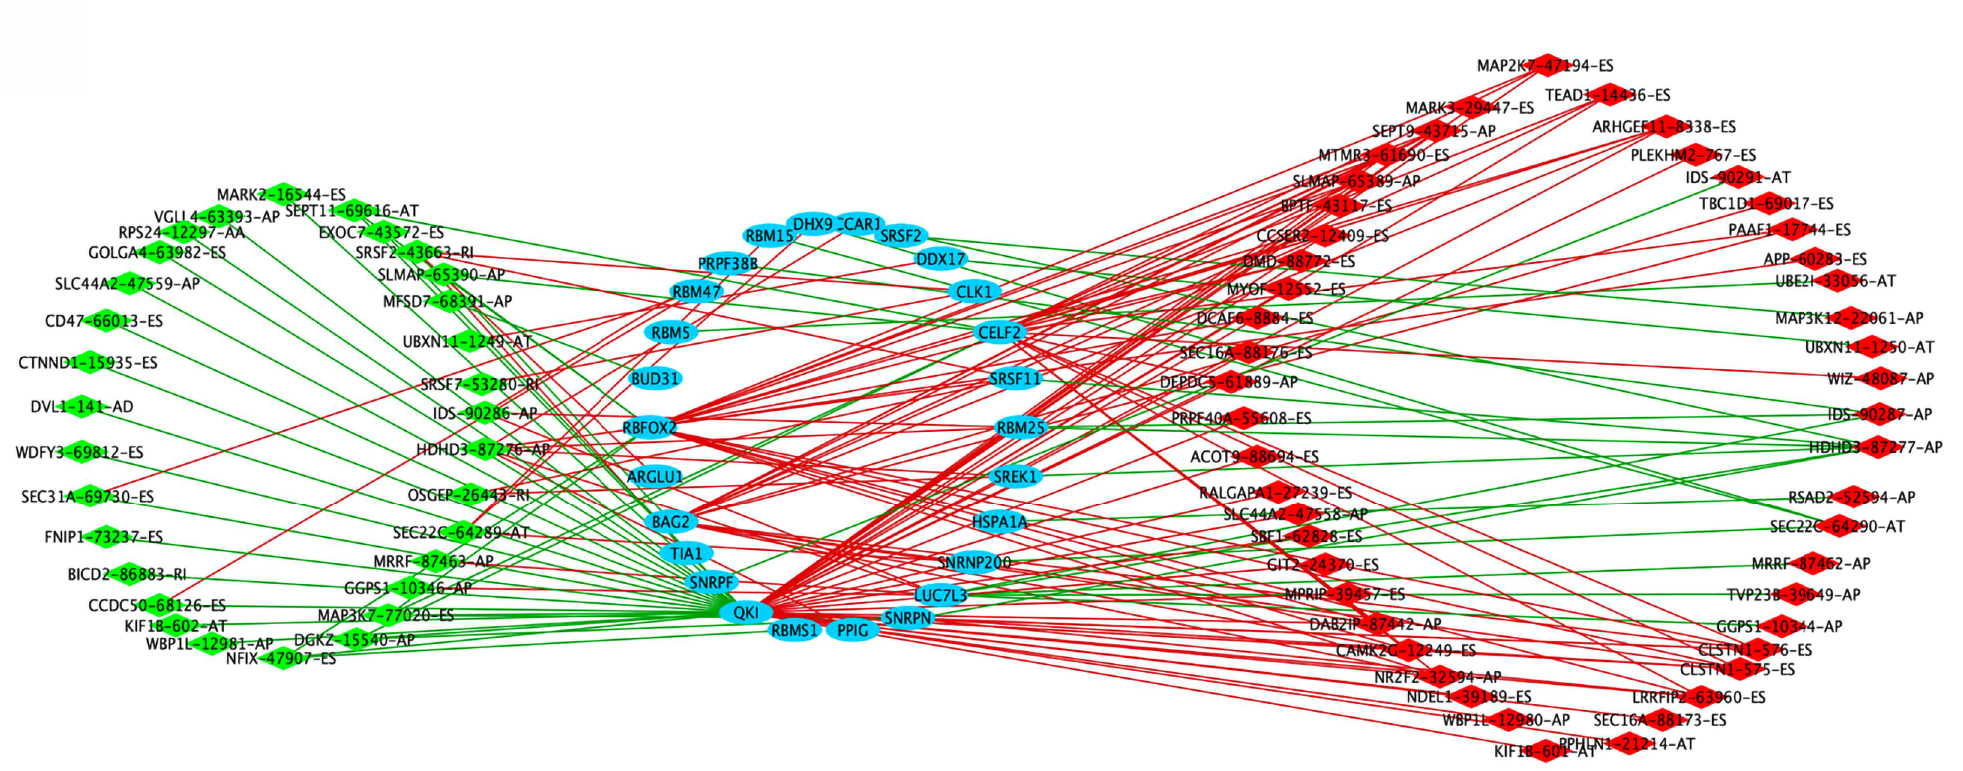
Figure 4 Splicing factor-alternative splicing interaction network in stomach adenocarcinoma.
The favorable prognosis of overall survival (OS)-related alternative splicing (AS) events are indicated in green; the unfavorable prognosis of OS-related AS events, red; the upstream splicing factors (SFs), blue; the negative correlation between SFs and OS-related AS events, green lines; the positive correlation between SFs and OS-related AS events, red lines.
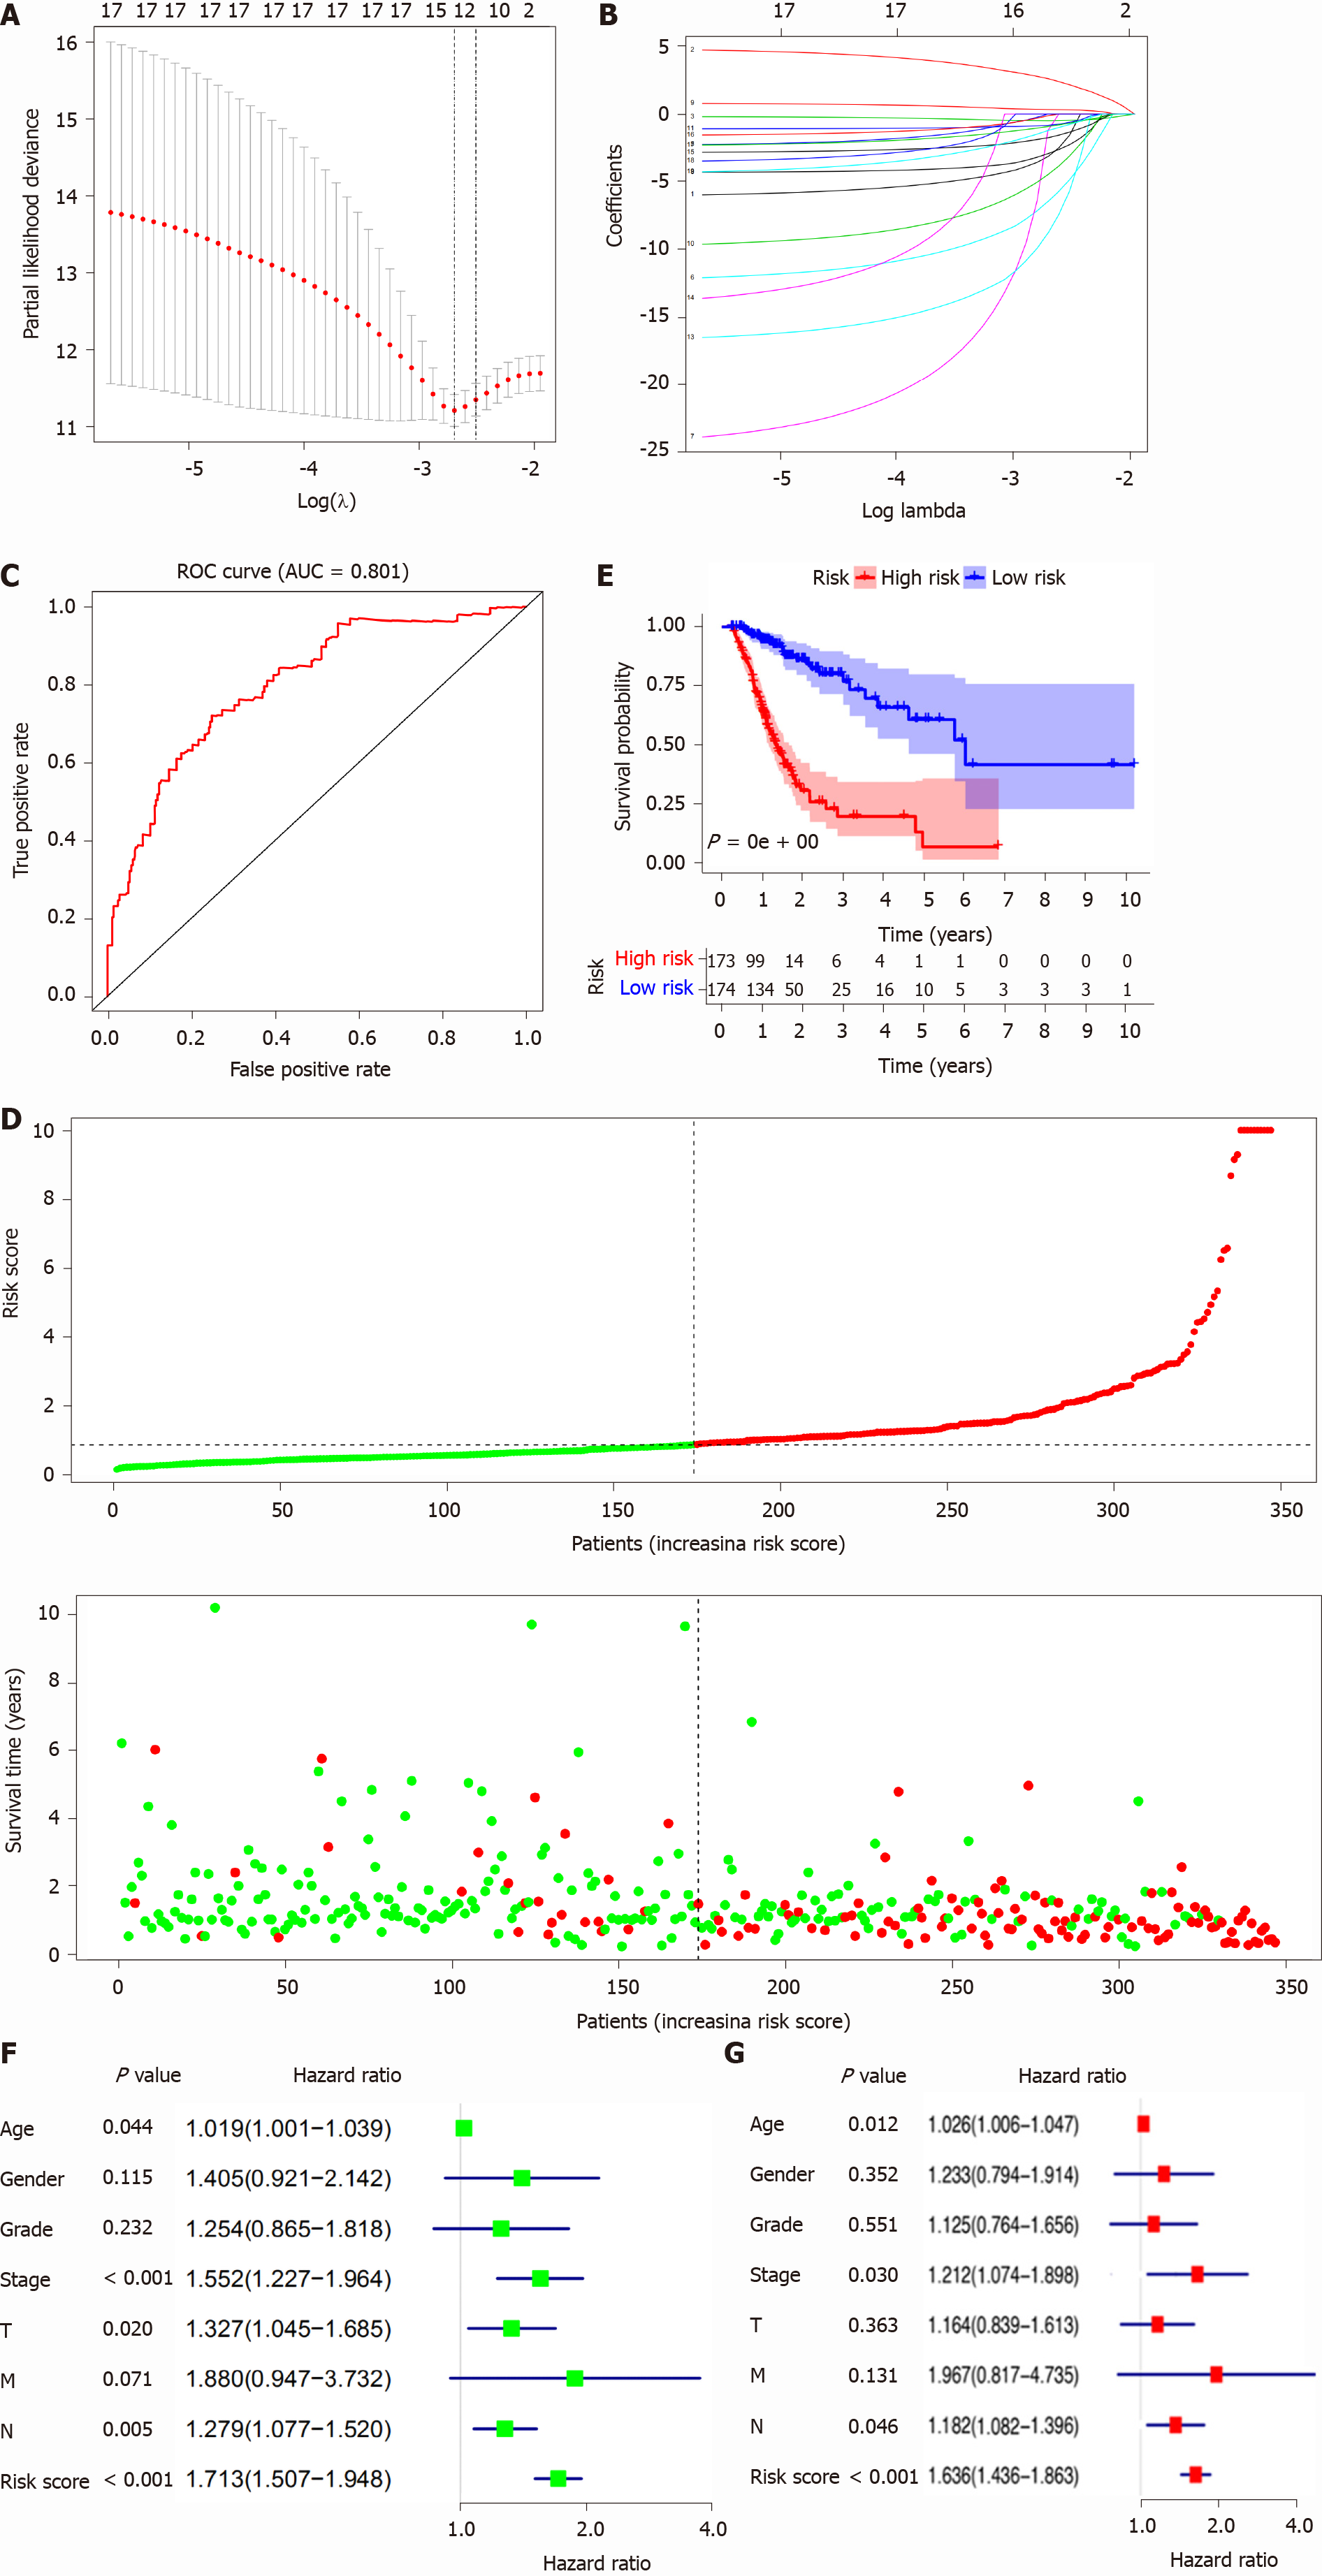
Figure 5 Lasso regression identified the prognostic model in stomach adenocarcinoma.
A and B: Lasso regression complexity was controlled by lambda using the glmnet R package; C: The receiver operating characteristic of risk score in stomach adenocarcinoma (STAD); D: Risk plot between the high- and low-risk-score groups; E: Overall survival analysis between the high- and low-risk-score groups; F: The univariate Cox regression analysis of risk factors in STAD; G: The multivariate Cox regression analysis of risk factors in STAD. ROC: Receiver operating characteristic; AUC: Area under the curve.
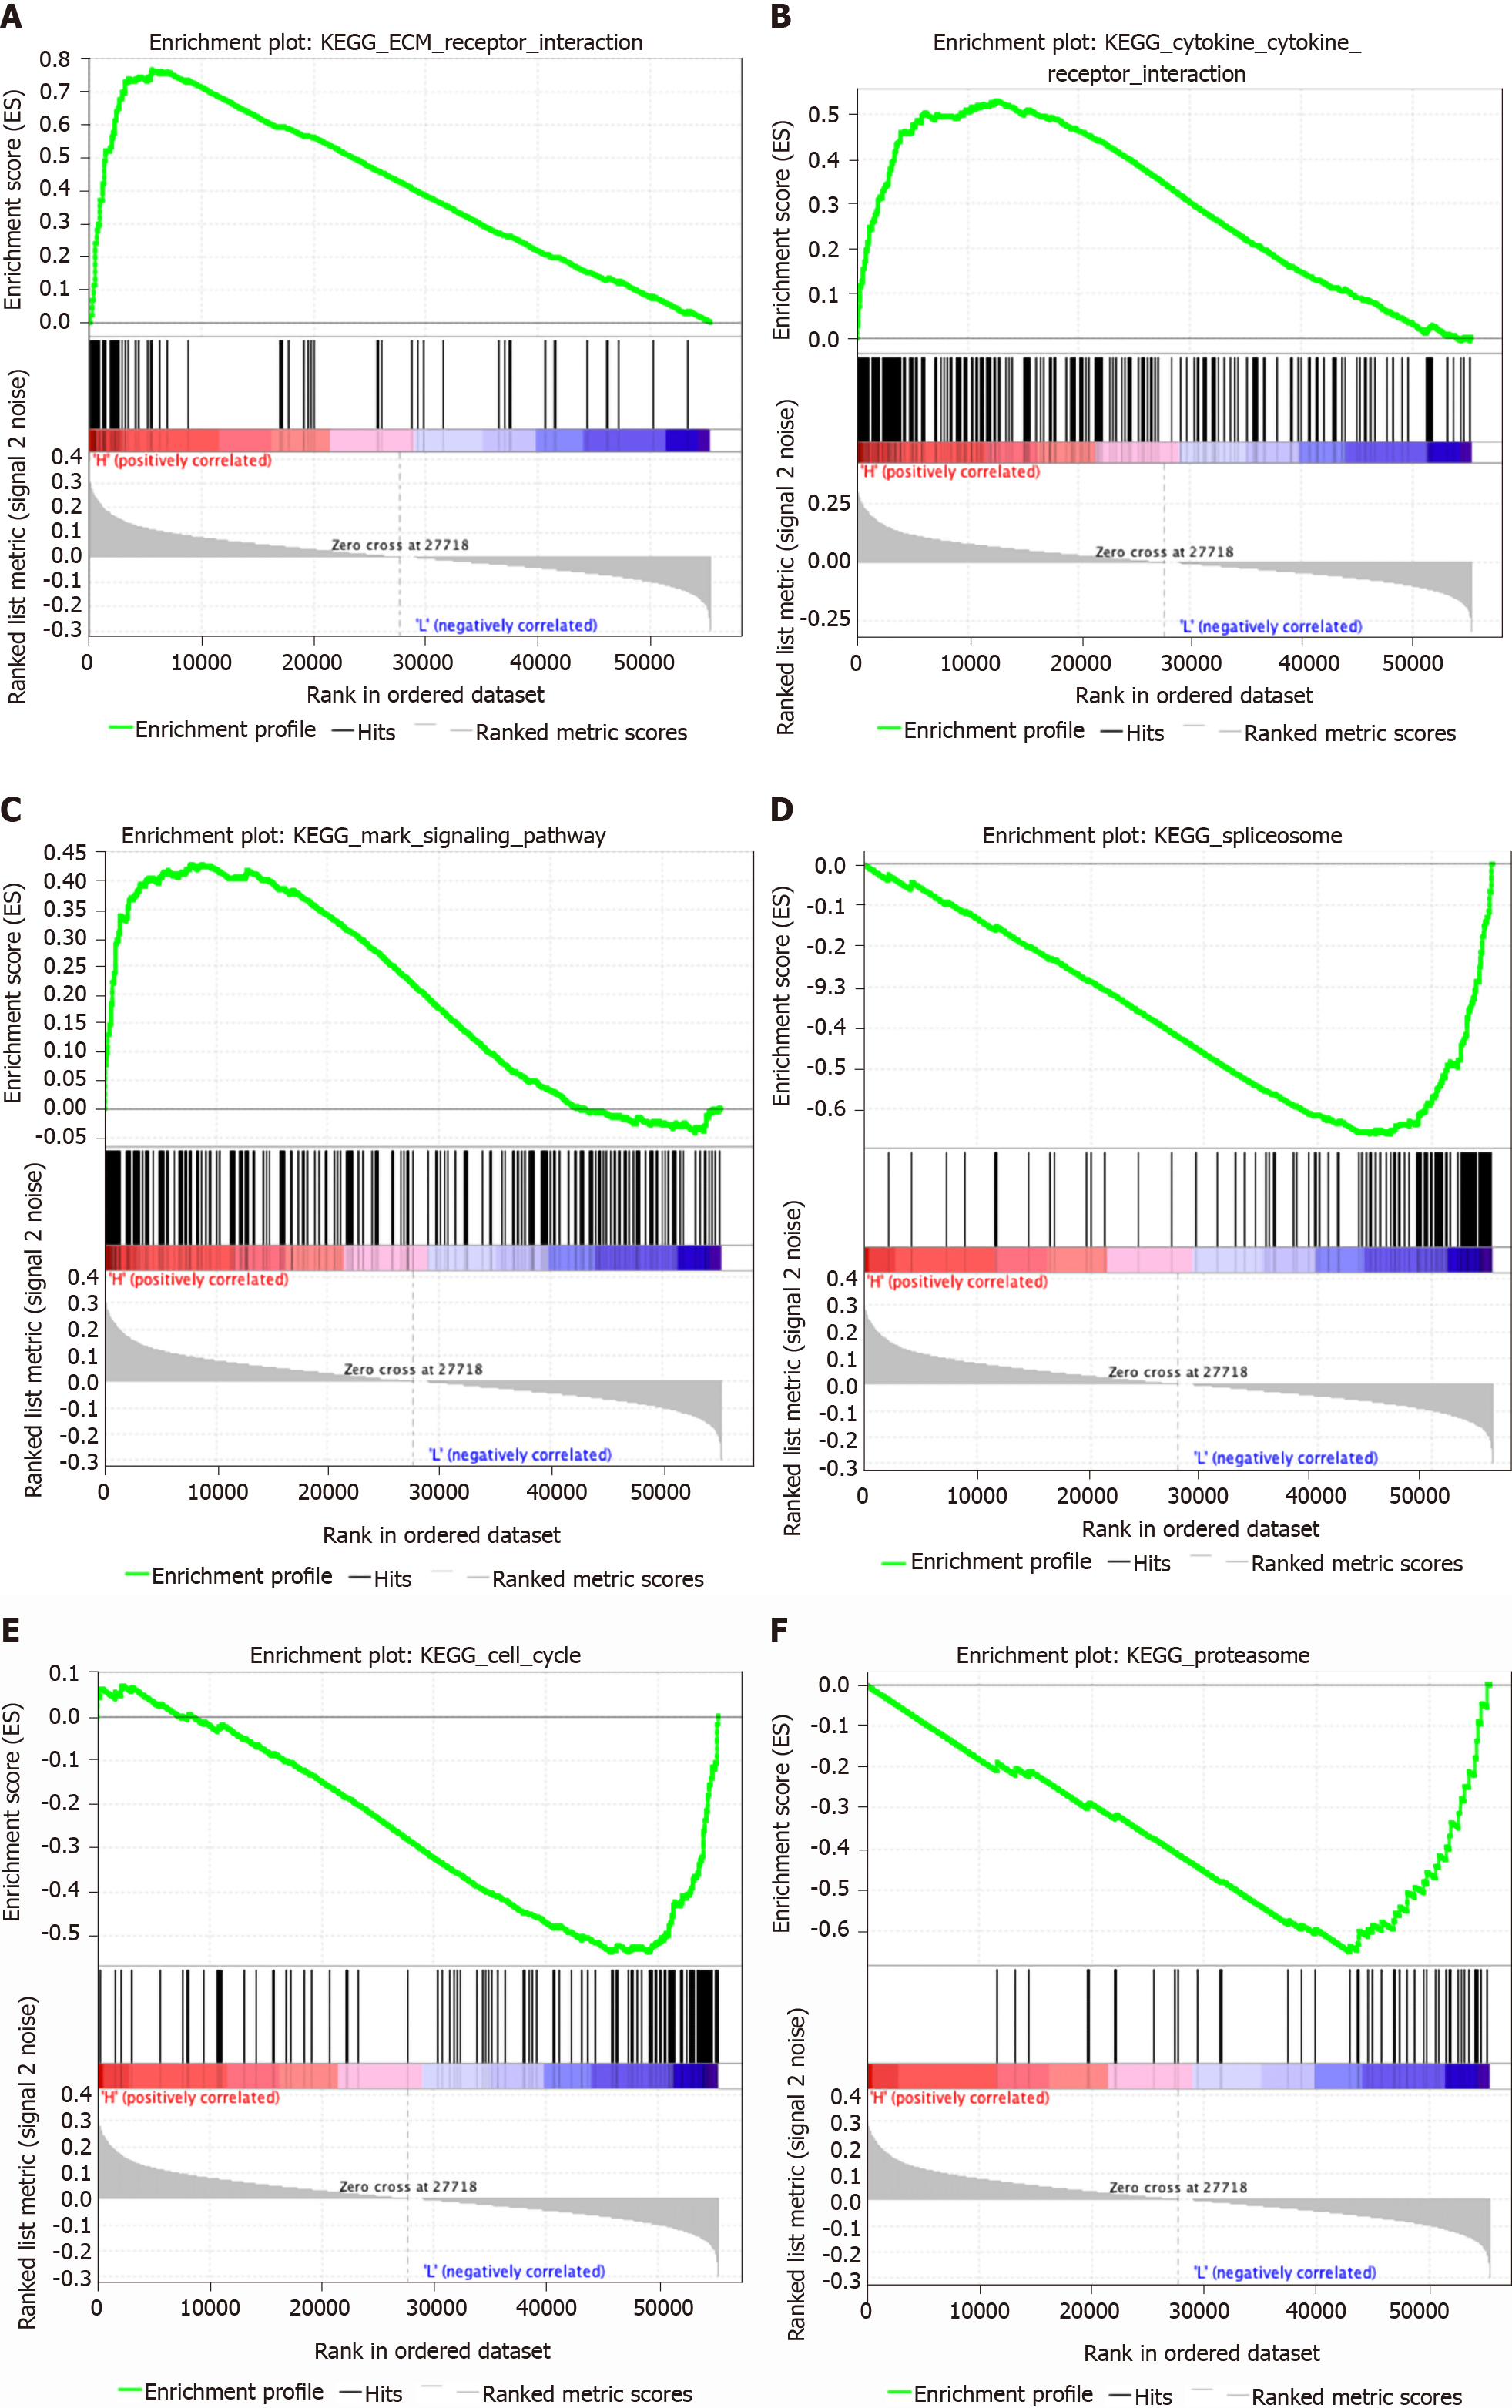
Figure 6 Gene set enrichment analysis identified gene sets that were different between the high-risk-score group and low-risk-score group in stomach adenocarcinoma.
A: The ECM receptor interaction pathway was significantly different between the high-risk-score group and low-risk-score group; B: The cytokine and cytokine receptor interaction pathway was significantly different between the high-risk-score group and low-risk-score group; C: The MAPK signaling pathway was significantly different between the high-risk-score group and low-risk-score group; D: The spliceosome pathway was significantly different between the high-risk-score group and low-risk-score group; E: The cell cycle pathway was significantly different between the high-risk-score group and low-risk-score group; F: The proteasome pathway was significantly different between the high-risk-score group and low-risk-score group.
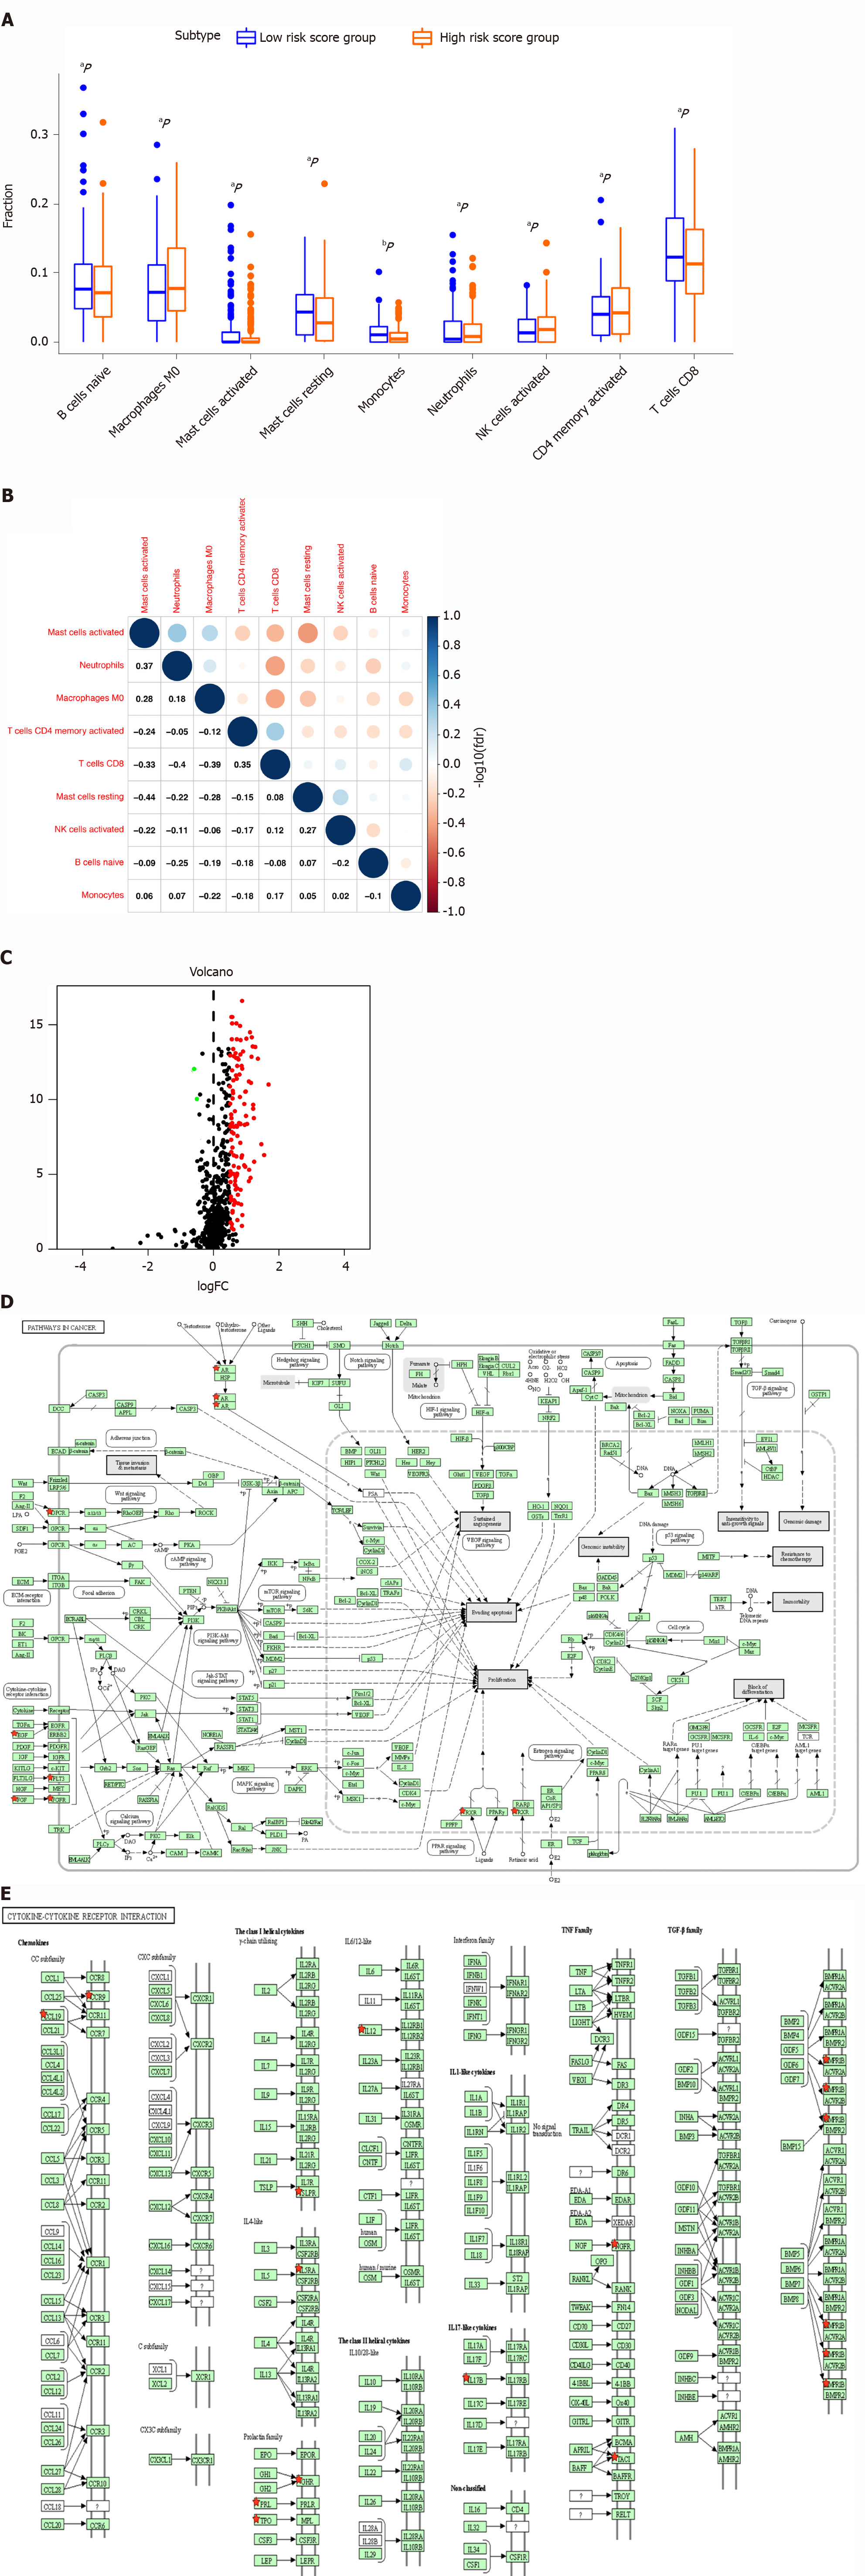
Figure 7 Difference in distribution of immune cells, expressed immune-related genes, and immune-related pathways between high- and low-risk score groups.
A: Boxplot shows the differences in the ratio of nine immune cells between the high- and low-risk-score groups in stomach adenocarcinoma (STAD); B: The correlation between those nine immune cells in STAD; C: Volcano plot of differentially expressed immune-related genes (DEIRGs) in STAD between the high- and low-risk-score groups. Upregulated DEIRGs are indicated in red points and downregulated DEIRGs in green points; D: The pathways in cancer was significantly enriched among DEIRGs in STAD (P < 0.05); E: The cytokine and cytokine receptor interaction pathway was significantly enriched among DEIRGs in STAD (P < 0.05). aP < 0.05, and bP < 0.01.
- Citation: Ye ZS, Zheng M, Liu QY, Zeng Y, Wei SH, Wang Y, Lin ZT, Shu C, Zheng QH, Chen LC. Survival-associated alternative splicing events interact with the immune microenvironment in stomach adenocarcinoma. World J Gastroenterol 2021; 27(21): 2871-2894
- URL: https://www.wjgnet.com/1007-9327/full/v27/i21/2871.htm
- DOI: https://dx.doi.org/10.3748/wjg.v27.i21.2871


