Copyright
©The Author(s) 2021.
World J Gastroenterol. Jun 7, 2021; 27(21): 2850-2870
Published online Jun 7, 2021. doi: 10.3748/wjg.v27.i21.2850
Published online Jun 7, 2021. doi: 10.3748/wjg.v27.i21.2850
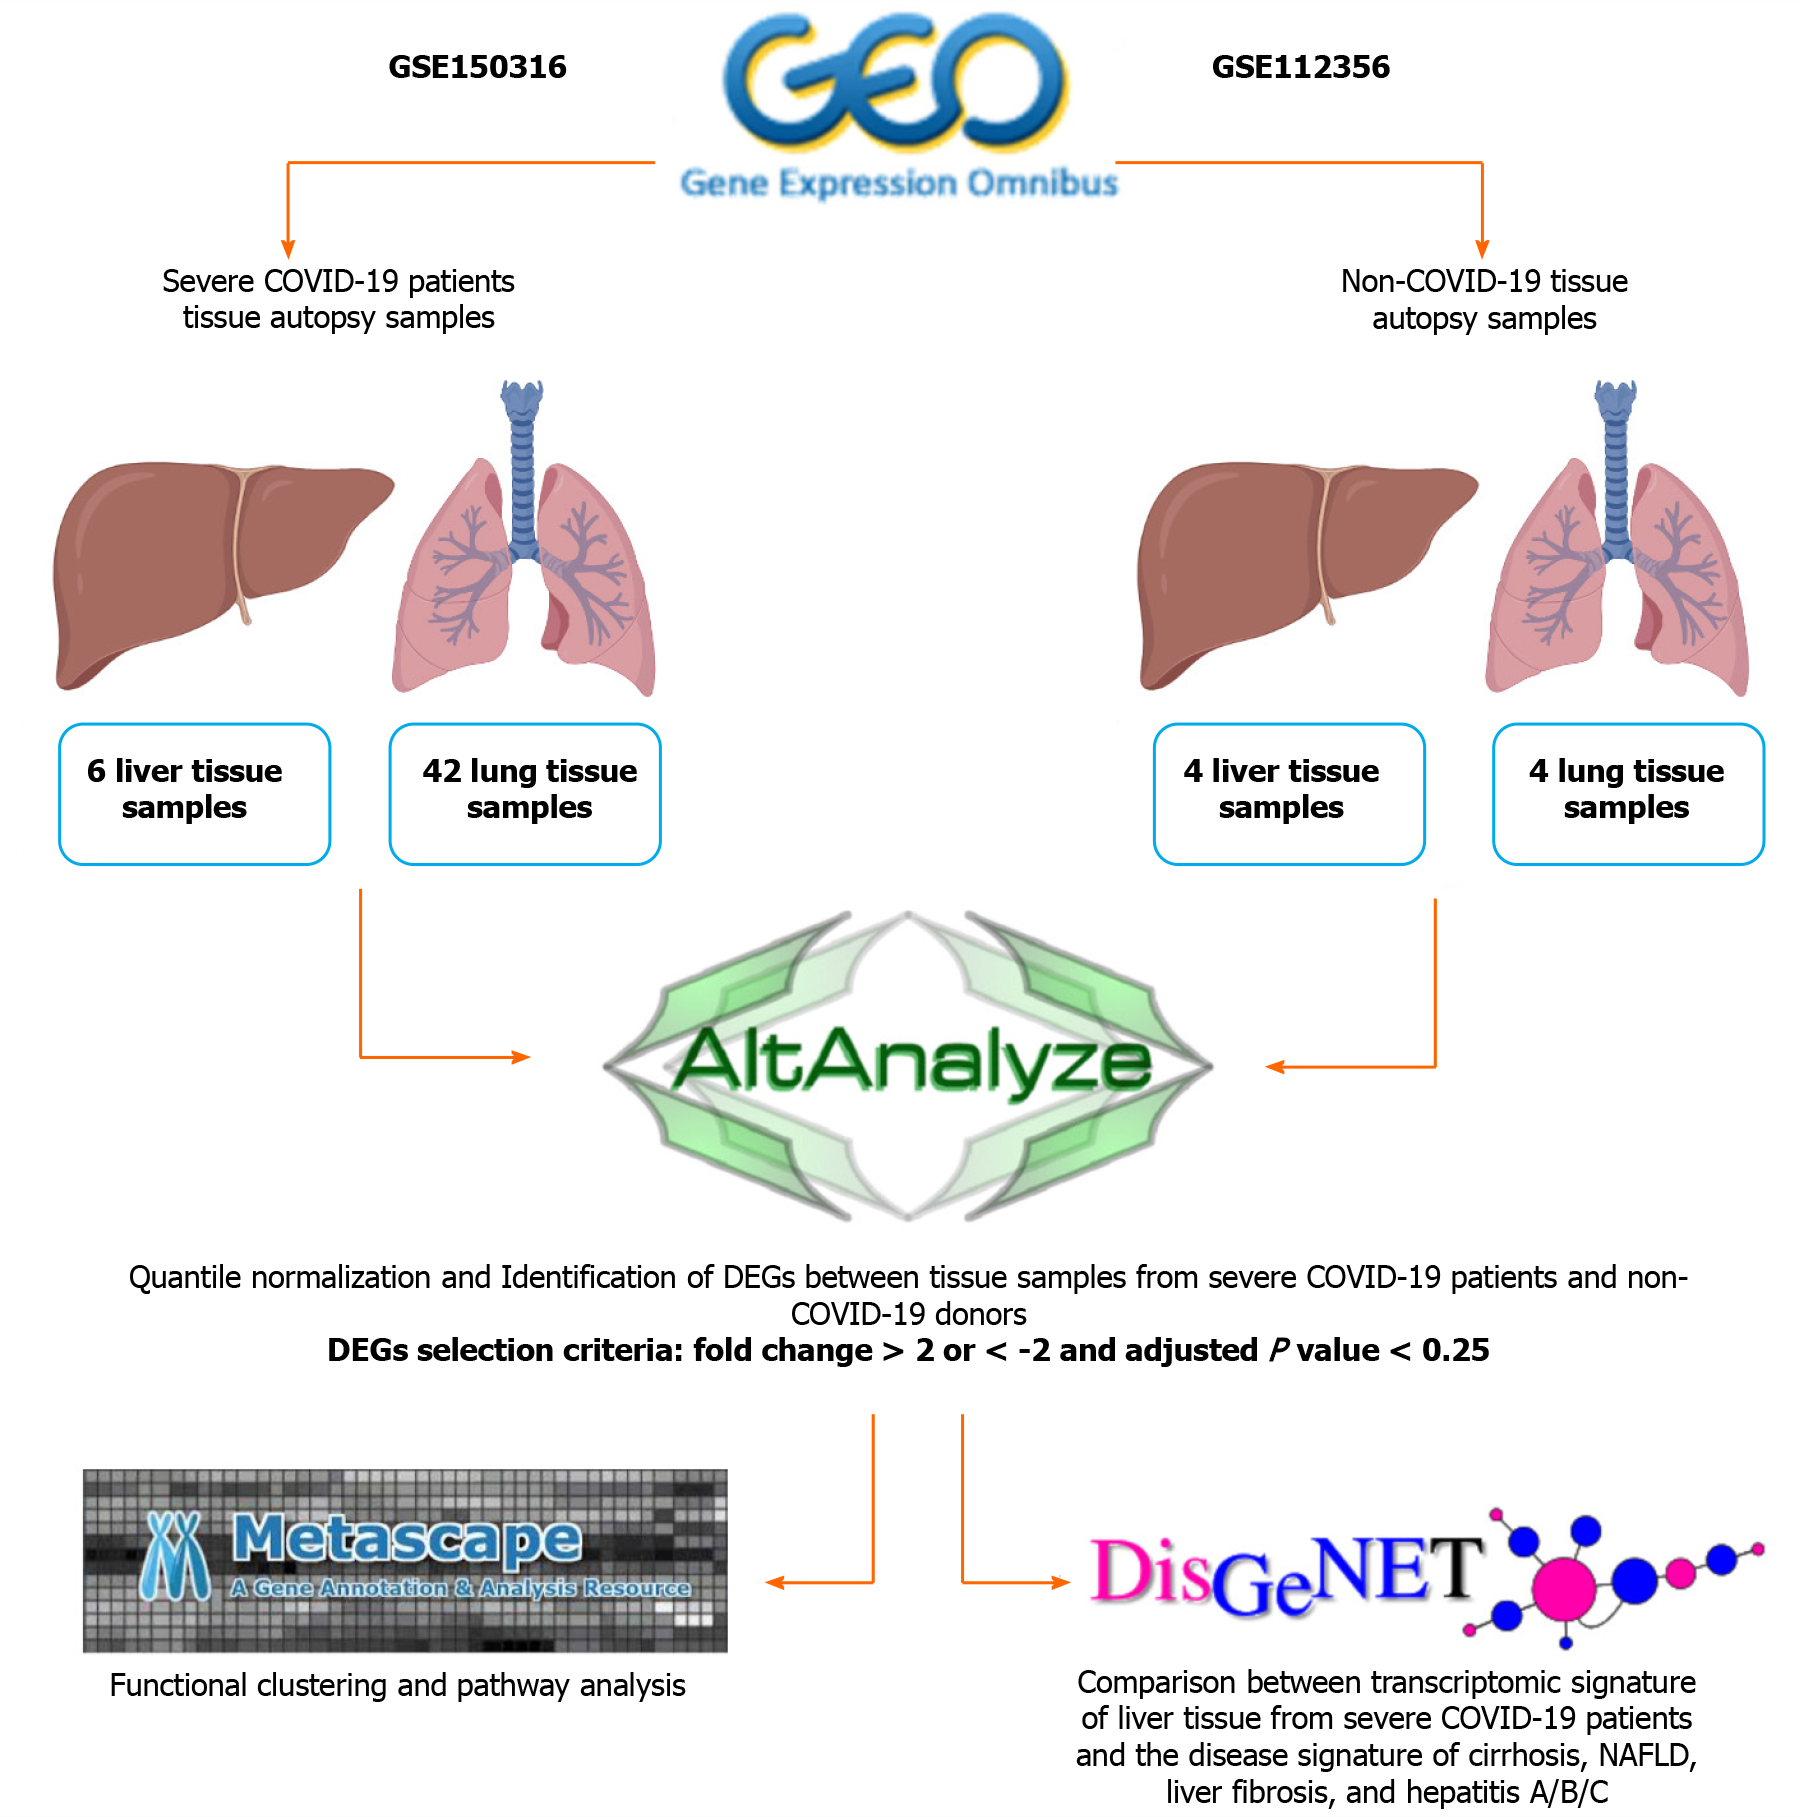
Figure 1 General Workflow of the in-silico analysis of the coronavirus disease 2019 and healthy tissue autopsy samples RNA-seq data.
Figure was created with BioRender.com. DEGs: Differentially expressed genes; DisGeNET: Disease Gene Network; NAFLD: Non-alcoholic fatty liver disease.
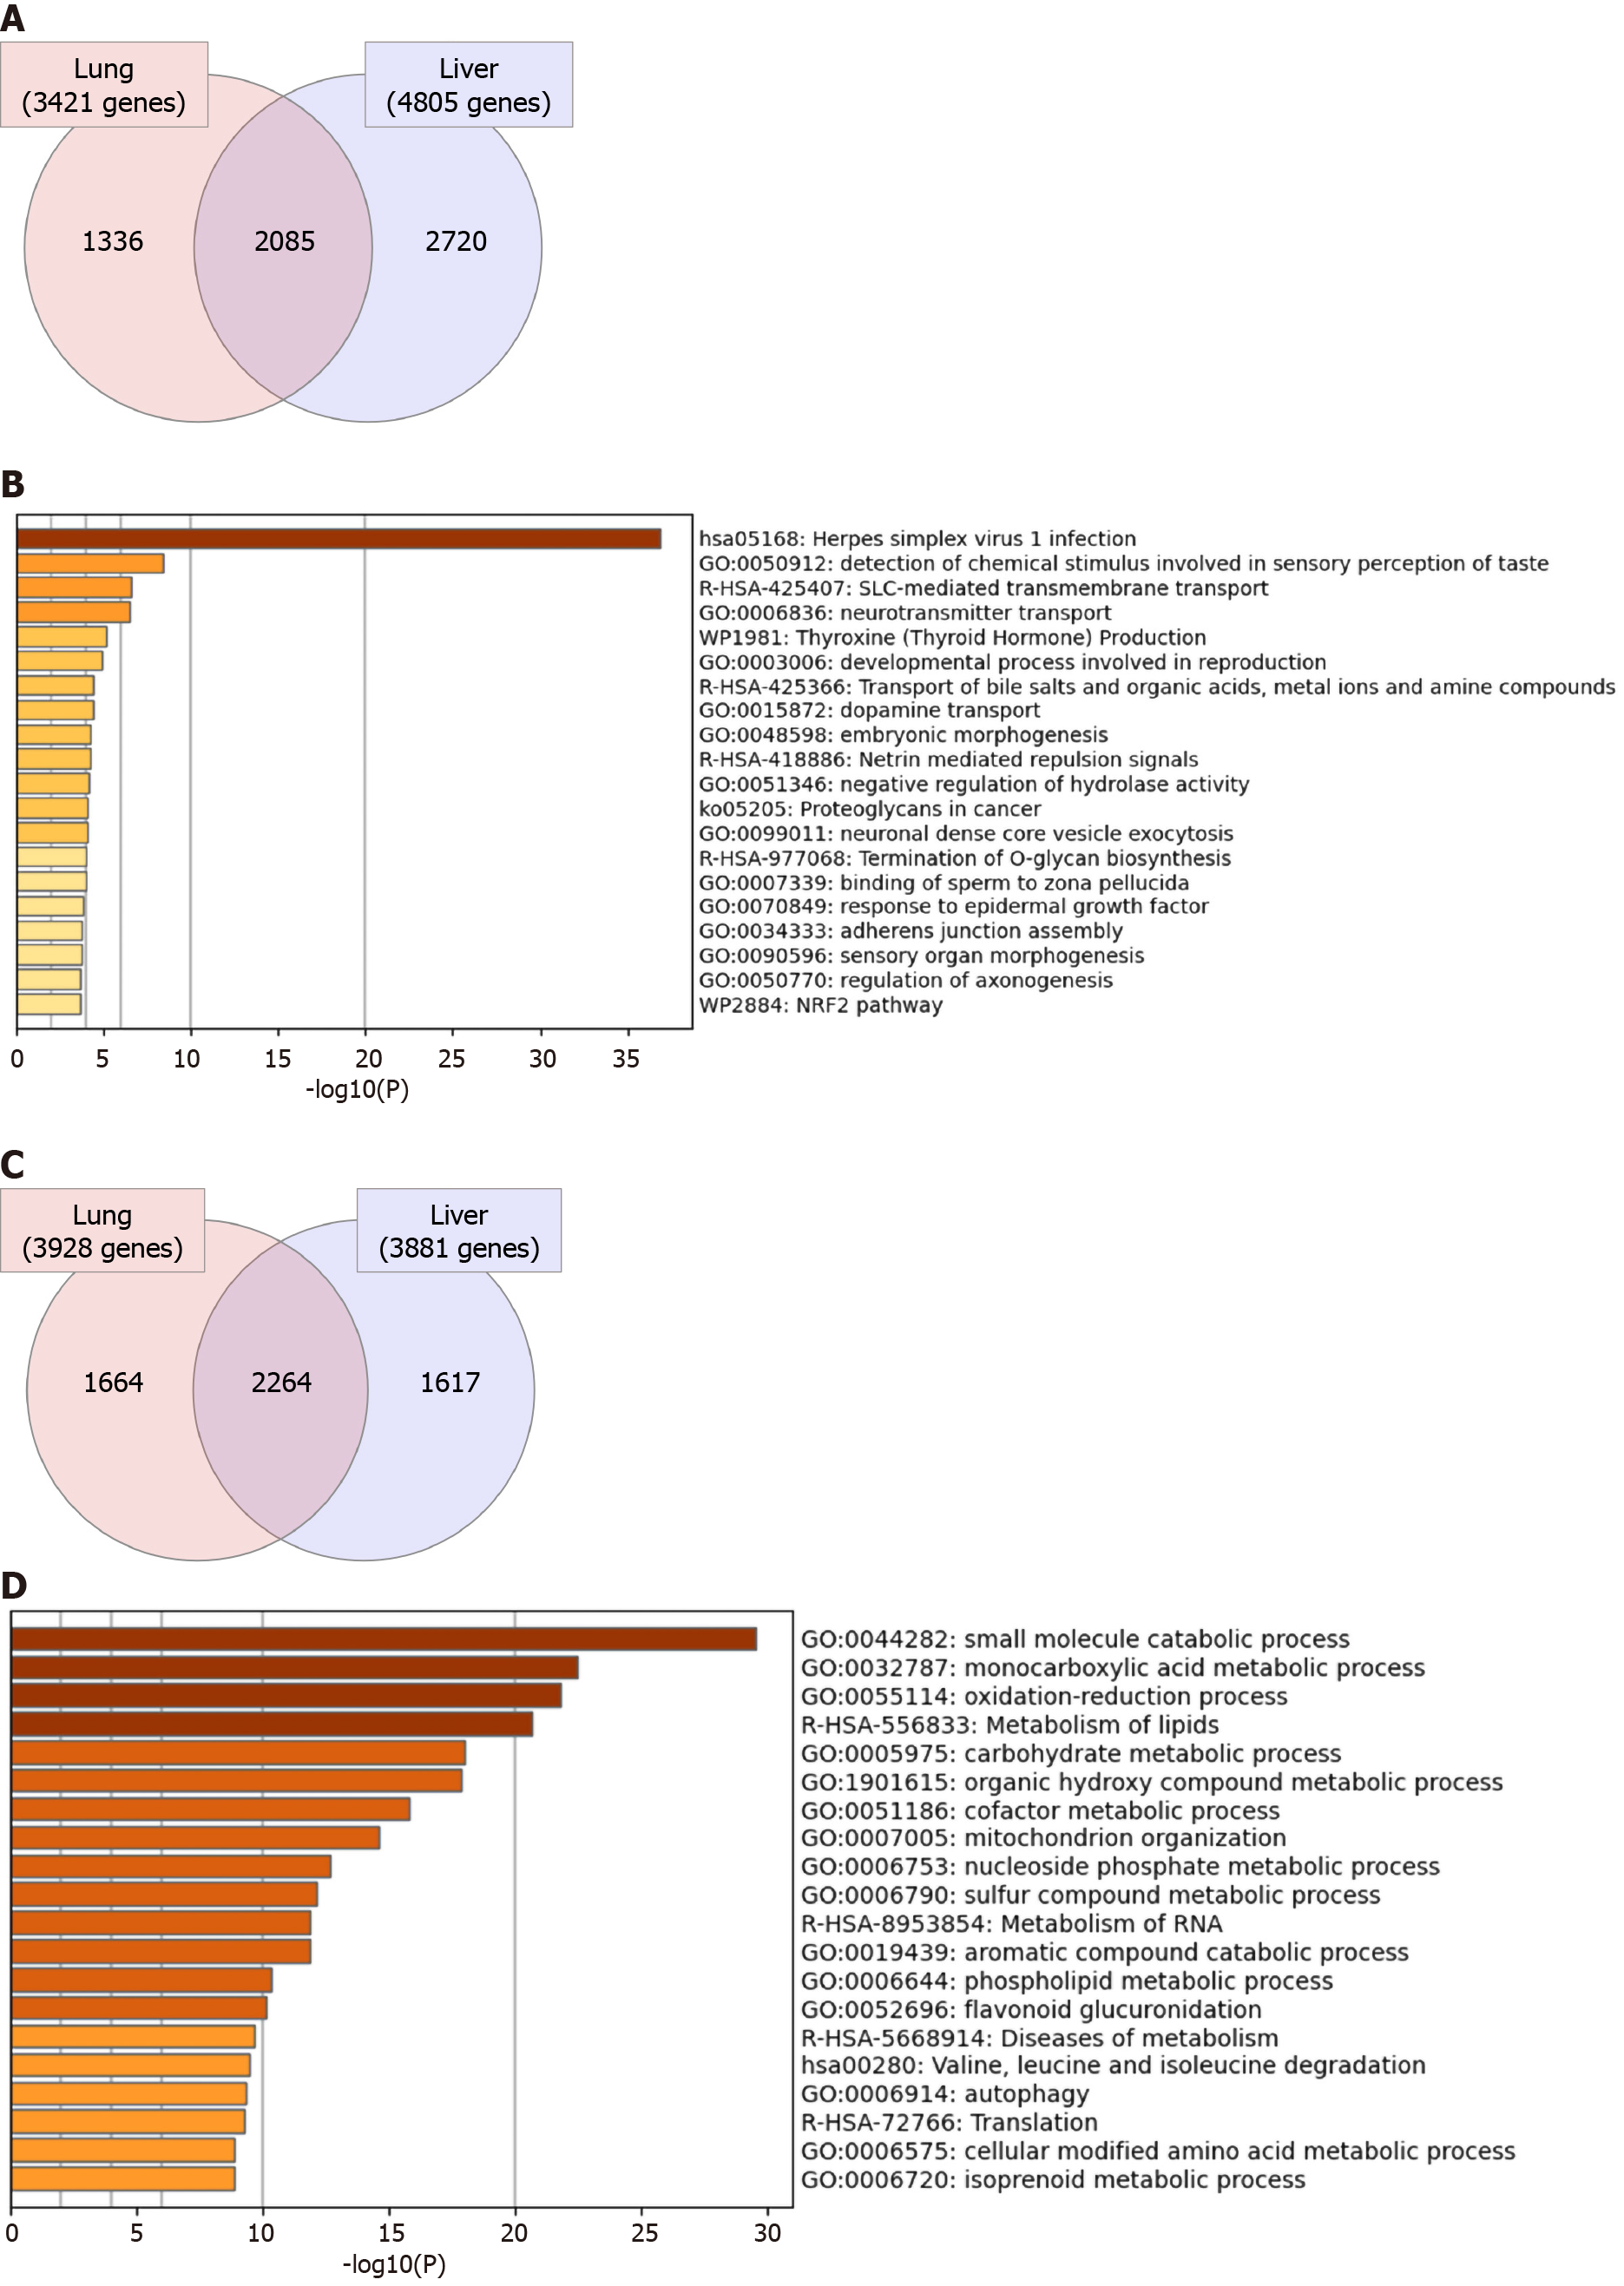
Figure 2 General overview of the commonly dysregulated transcriptome in lung and liver tissues in severe coronavirus disease 2019 patients.
A and B: Venn diagram representation of the overlapping (A) upregulated and (C) downregulated genes in response to severe acute respiratory syndrome coronavirus 2 (SARS-CoV2) infection in lung and liver tissues; C and D: Top 20 pathways and functional clusters enriched in the commonly (B) upregulated and (D) downregulated genes in SARS-CoV-2 infected lung and liver tissues.
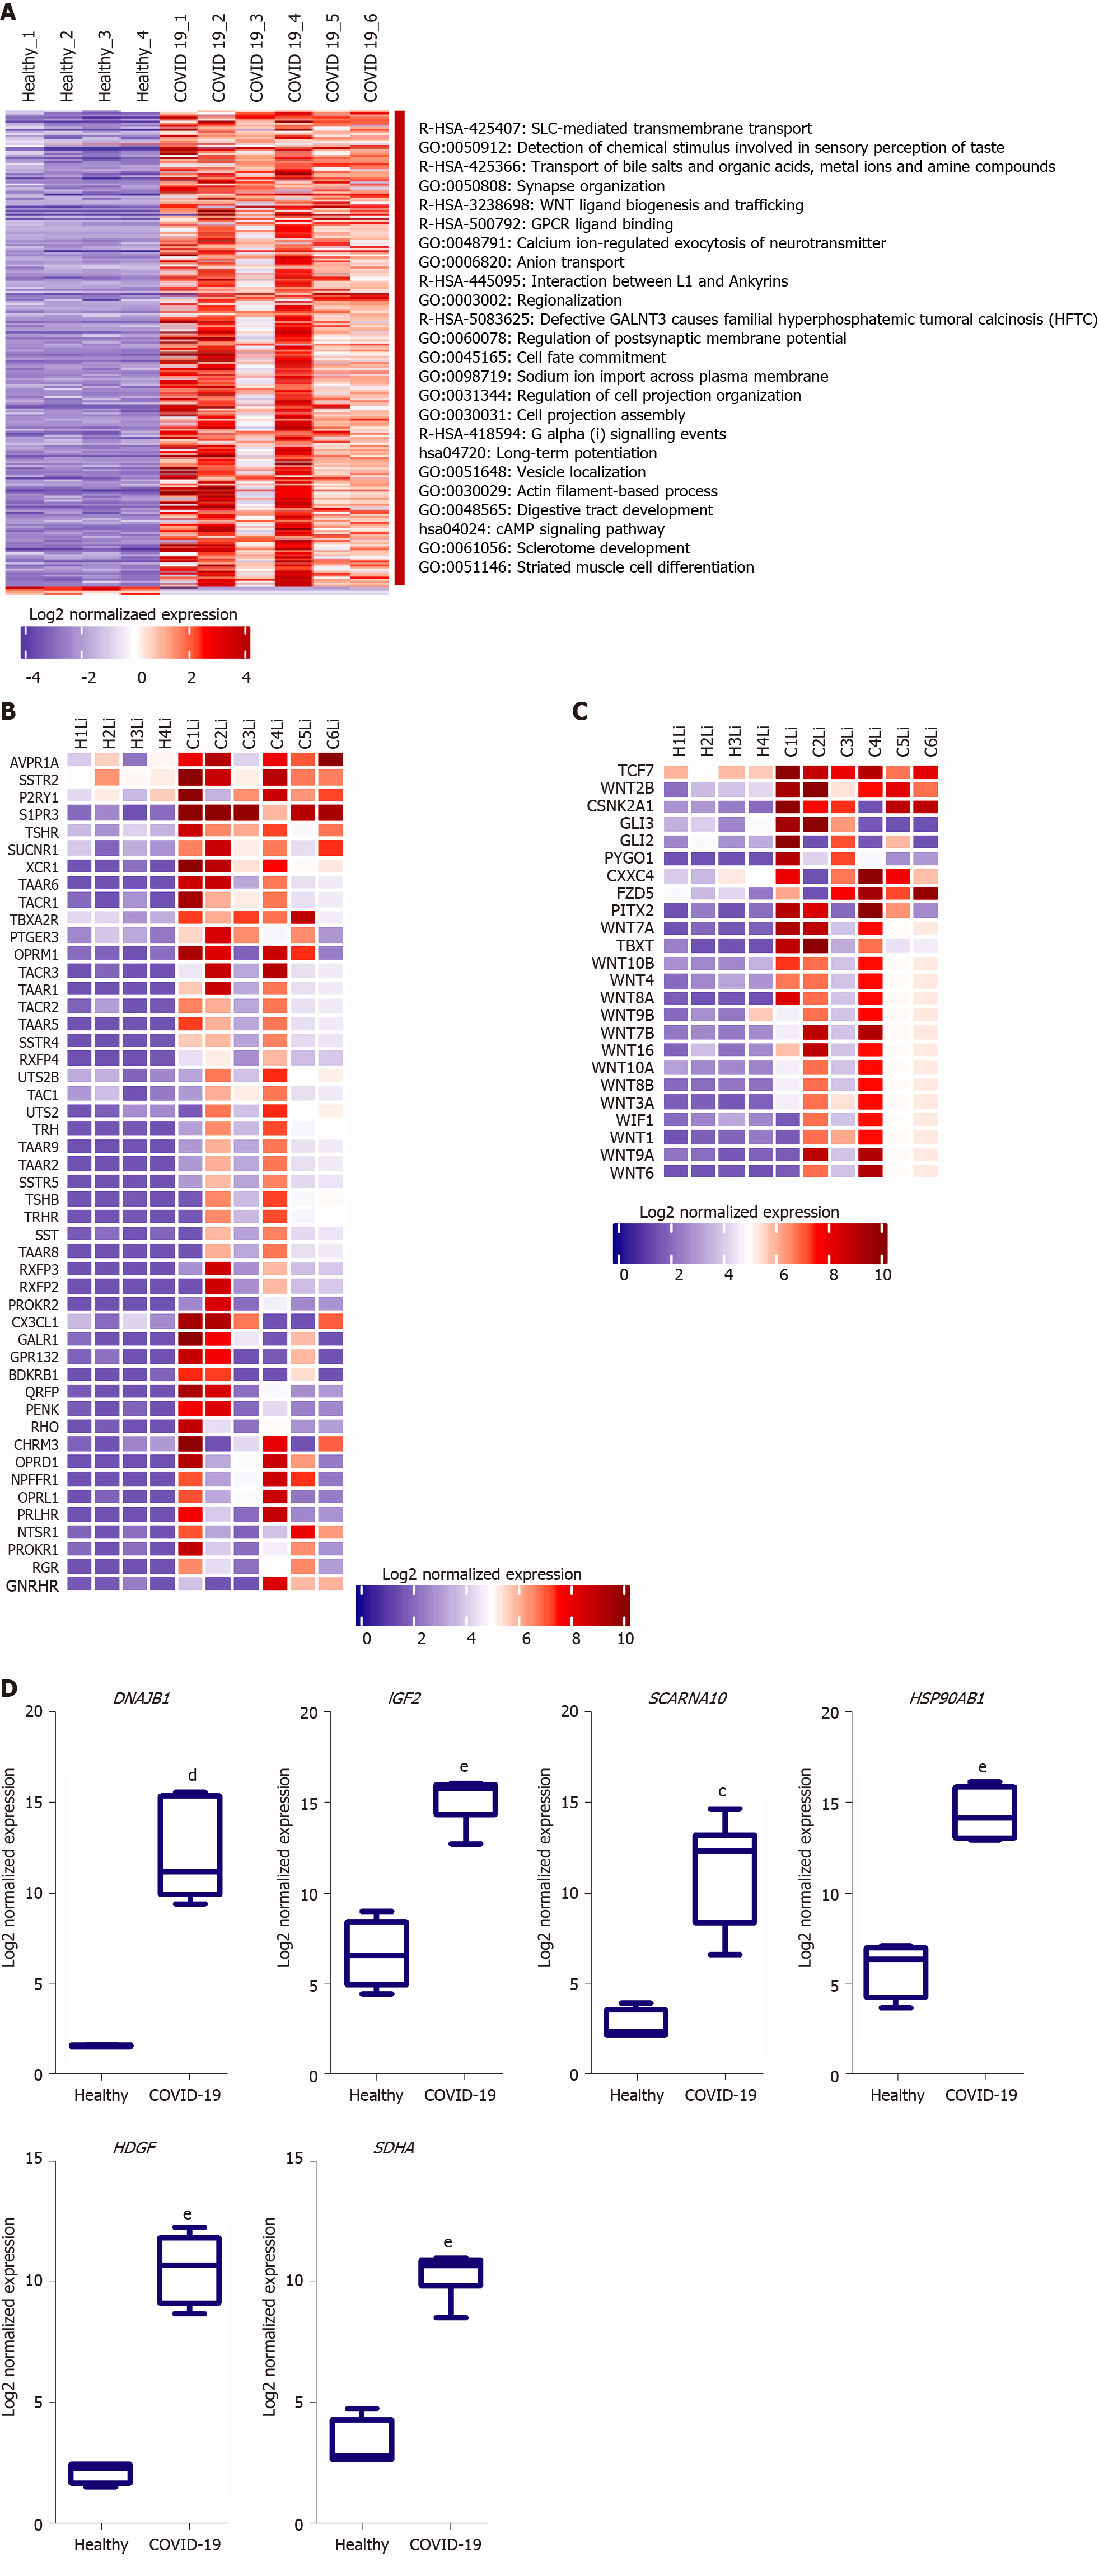
Figure 3 functional clustering analysis of the upregulated transcriptome of severe coronavirus disease 2019 patients liver autopsy tissues.
A: Heatmap representation of the differentially upregulated genes and subsequently enriched pathways and functional clusters in severe acute respiratory syndrome coronavirus 2 (SARS-CoV2) infected liver samples in comparison to baseline expression in healthy tissue samples; B and C: Heatmap representation of the log2 of normalized expression of transcripts implicated signaling through (B) Class A-rhodopsin-like receptors and (C) Class F-frizzled and smoothened receptors; D: Box plot representation of some of the top upregulated transcripts in SARS-CoV-2 infected liver tissue samples. Data presented as mean ± SE; aP < 0.05, bP < 0.01, cP < 0.001, dP < 0.0005, eP < 0.0001 coronavirus disease 2019 (COVID-19) vs Healthy. DNAJB1: DnaJ heat shock protein family (hsp40) member b1; IGF2: Insulin growth factor 2; SCARNA10: Small cajal body-specific rna 10; HSP90AB1: Heat shock protein 90 alpha family class B member 1; HDGF: Hepatoma-derived growth factor; SDHA: Succinate dehydrogenase complex flavoprotein subunit A.
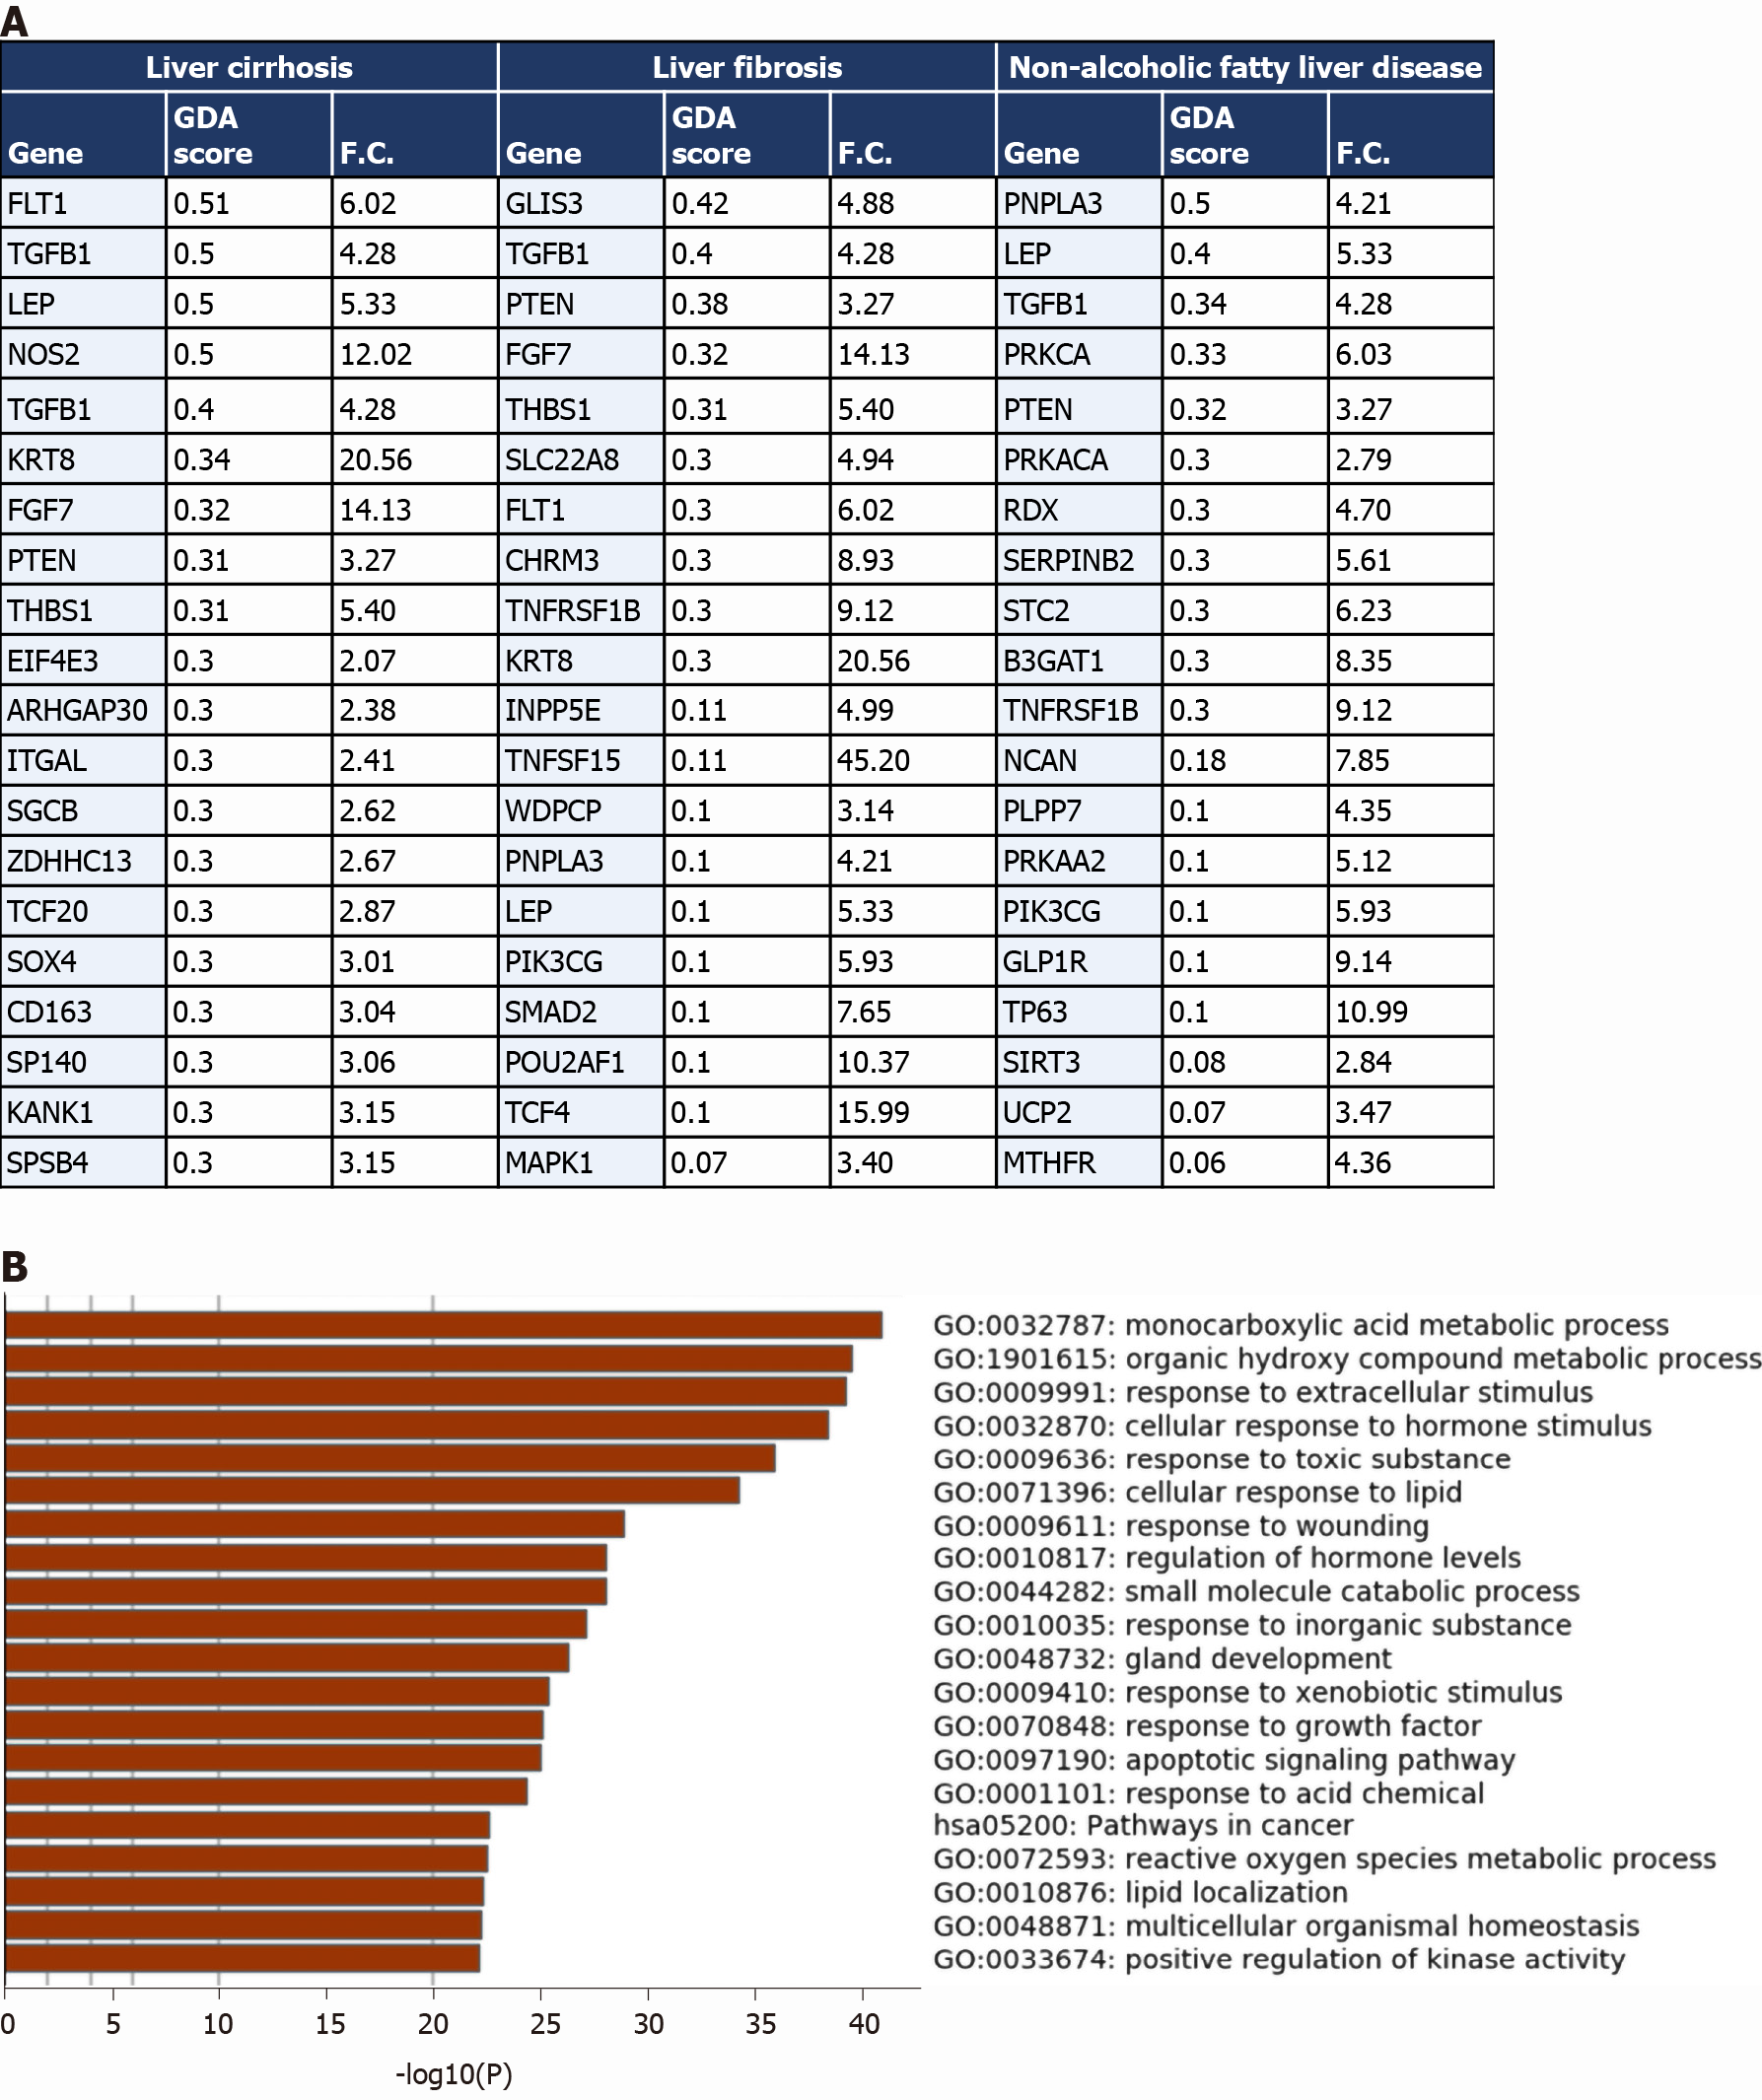
Figure 4 Comparative analysis of the overlapping transcriptomes mapping to severe coronavirus disease 2019 liver tissue, liver cirrhosis, liver fibrosis, and non-alcoholic fatty liver disease.
A: Top 20 Genes overlapping between the upregulated transcriptome of severe coronavirus disease 2019 (COVID-19) patients’ liver tissue samples and the signatures of liver cirrhosis, liver fibrosis, and non-alcoholic fatty liver disease retrieved from DisGeNET; gene disease association score was retrieved from DisGeNET and fold change is calculated using AltAnalyze to represent the difference in expression in COVID-19 liver tissue samples vs non-COVID-19 liver samples; B: functional clustering and pathway analysis of the overlapping transcriptome (upregulated and downregulated) of the severe COVID-19 patients’ liver tissues with the disease signature of liver cirrhosis, liver fibrosis, and non-alcoholic fatty liver disease analyzed using Metascape. GDA score: Gene disease association score; F.C.: Fold change.
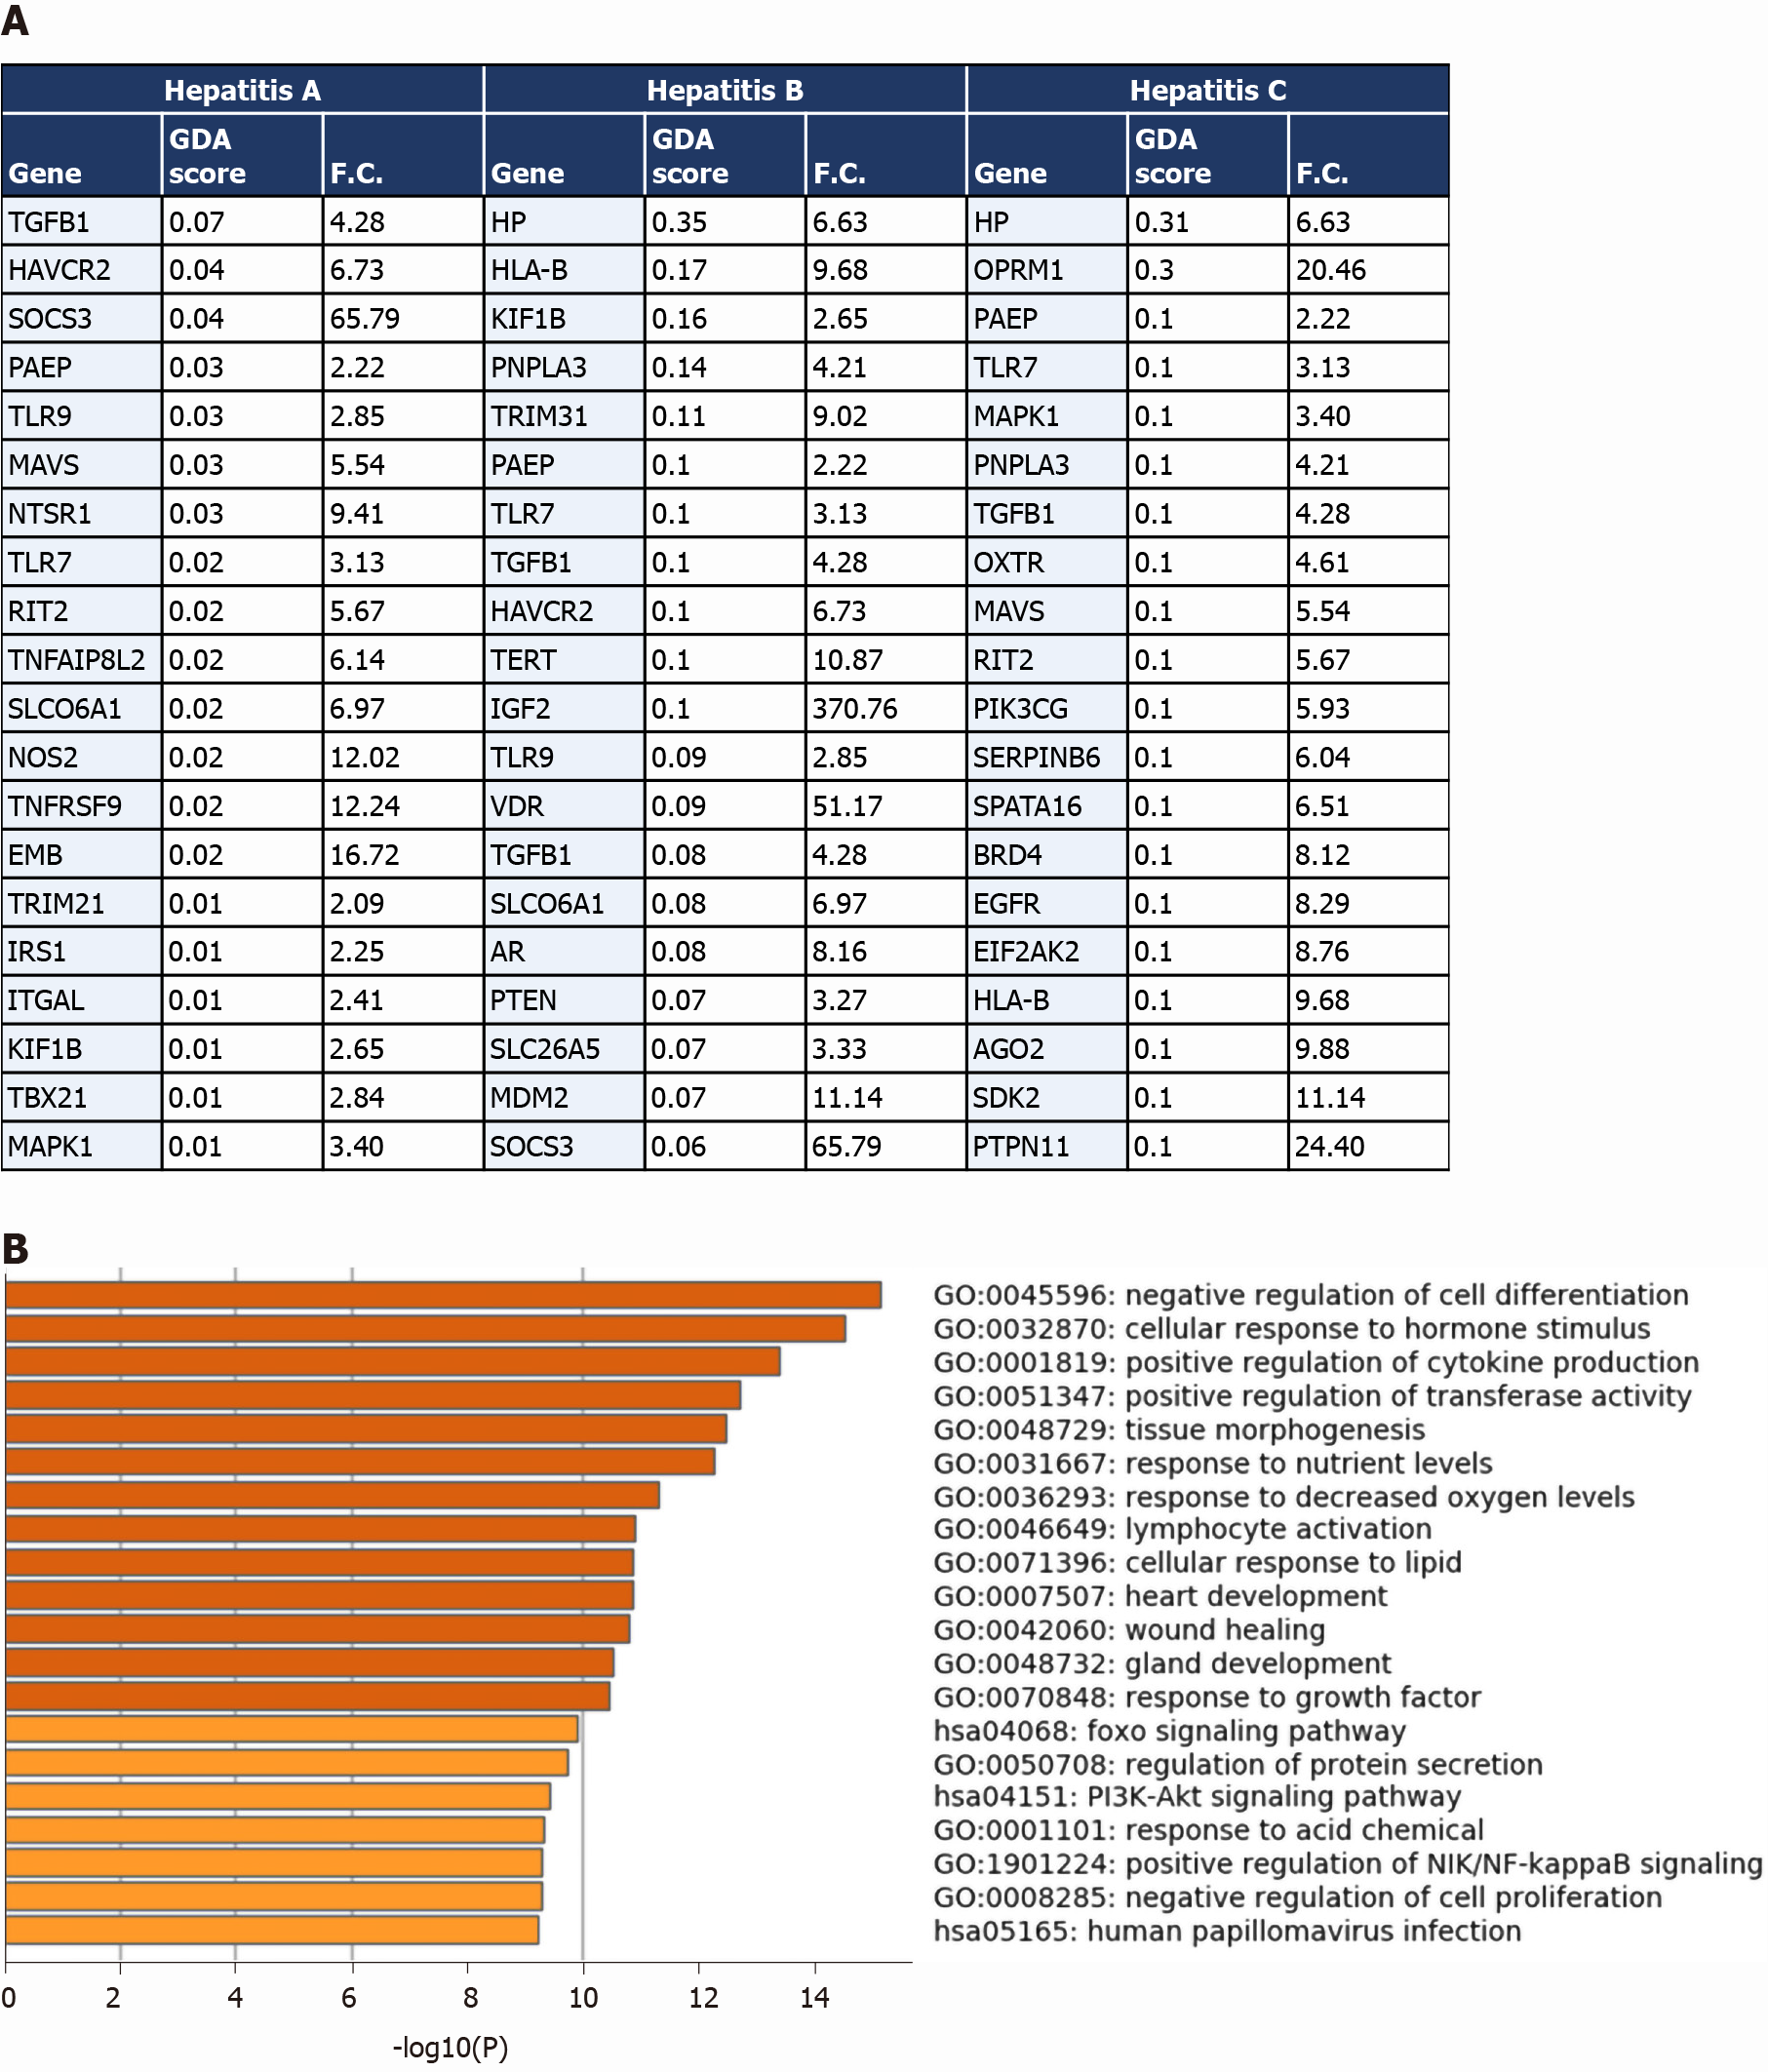
Figure 5 Comparative analysis of the overlapping transcriptomes mapping to severe coronavirus disease 2019 liver tissue, hepatitis A, hepatitis B, and hepatitis C.
A: Table representing the genes overlapping between the upregulated signature of severe acute respiratory syndrome coronavirus 2 (SARS-CoV2) infected liver tissue samples and the signatures of hepatitis A, B, and C retrieved from DisGeNET; gene disease association score was retrieved from DisGeNET and fold change is calculated using AltAnalyze to represent the difference in expression in COVID-19 liver tissue samples vs non-COVID-19 liver samples; B: Top 20 pathways and functional clusters enriched in the commonly upregulated genes between SARS-CoV-2 infected liver tissues and hepatitis A, B, and C disease signatures analyzed using Metascape. GDA score: Gene disease association score; F.C.: Fold change.
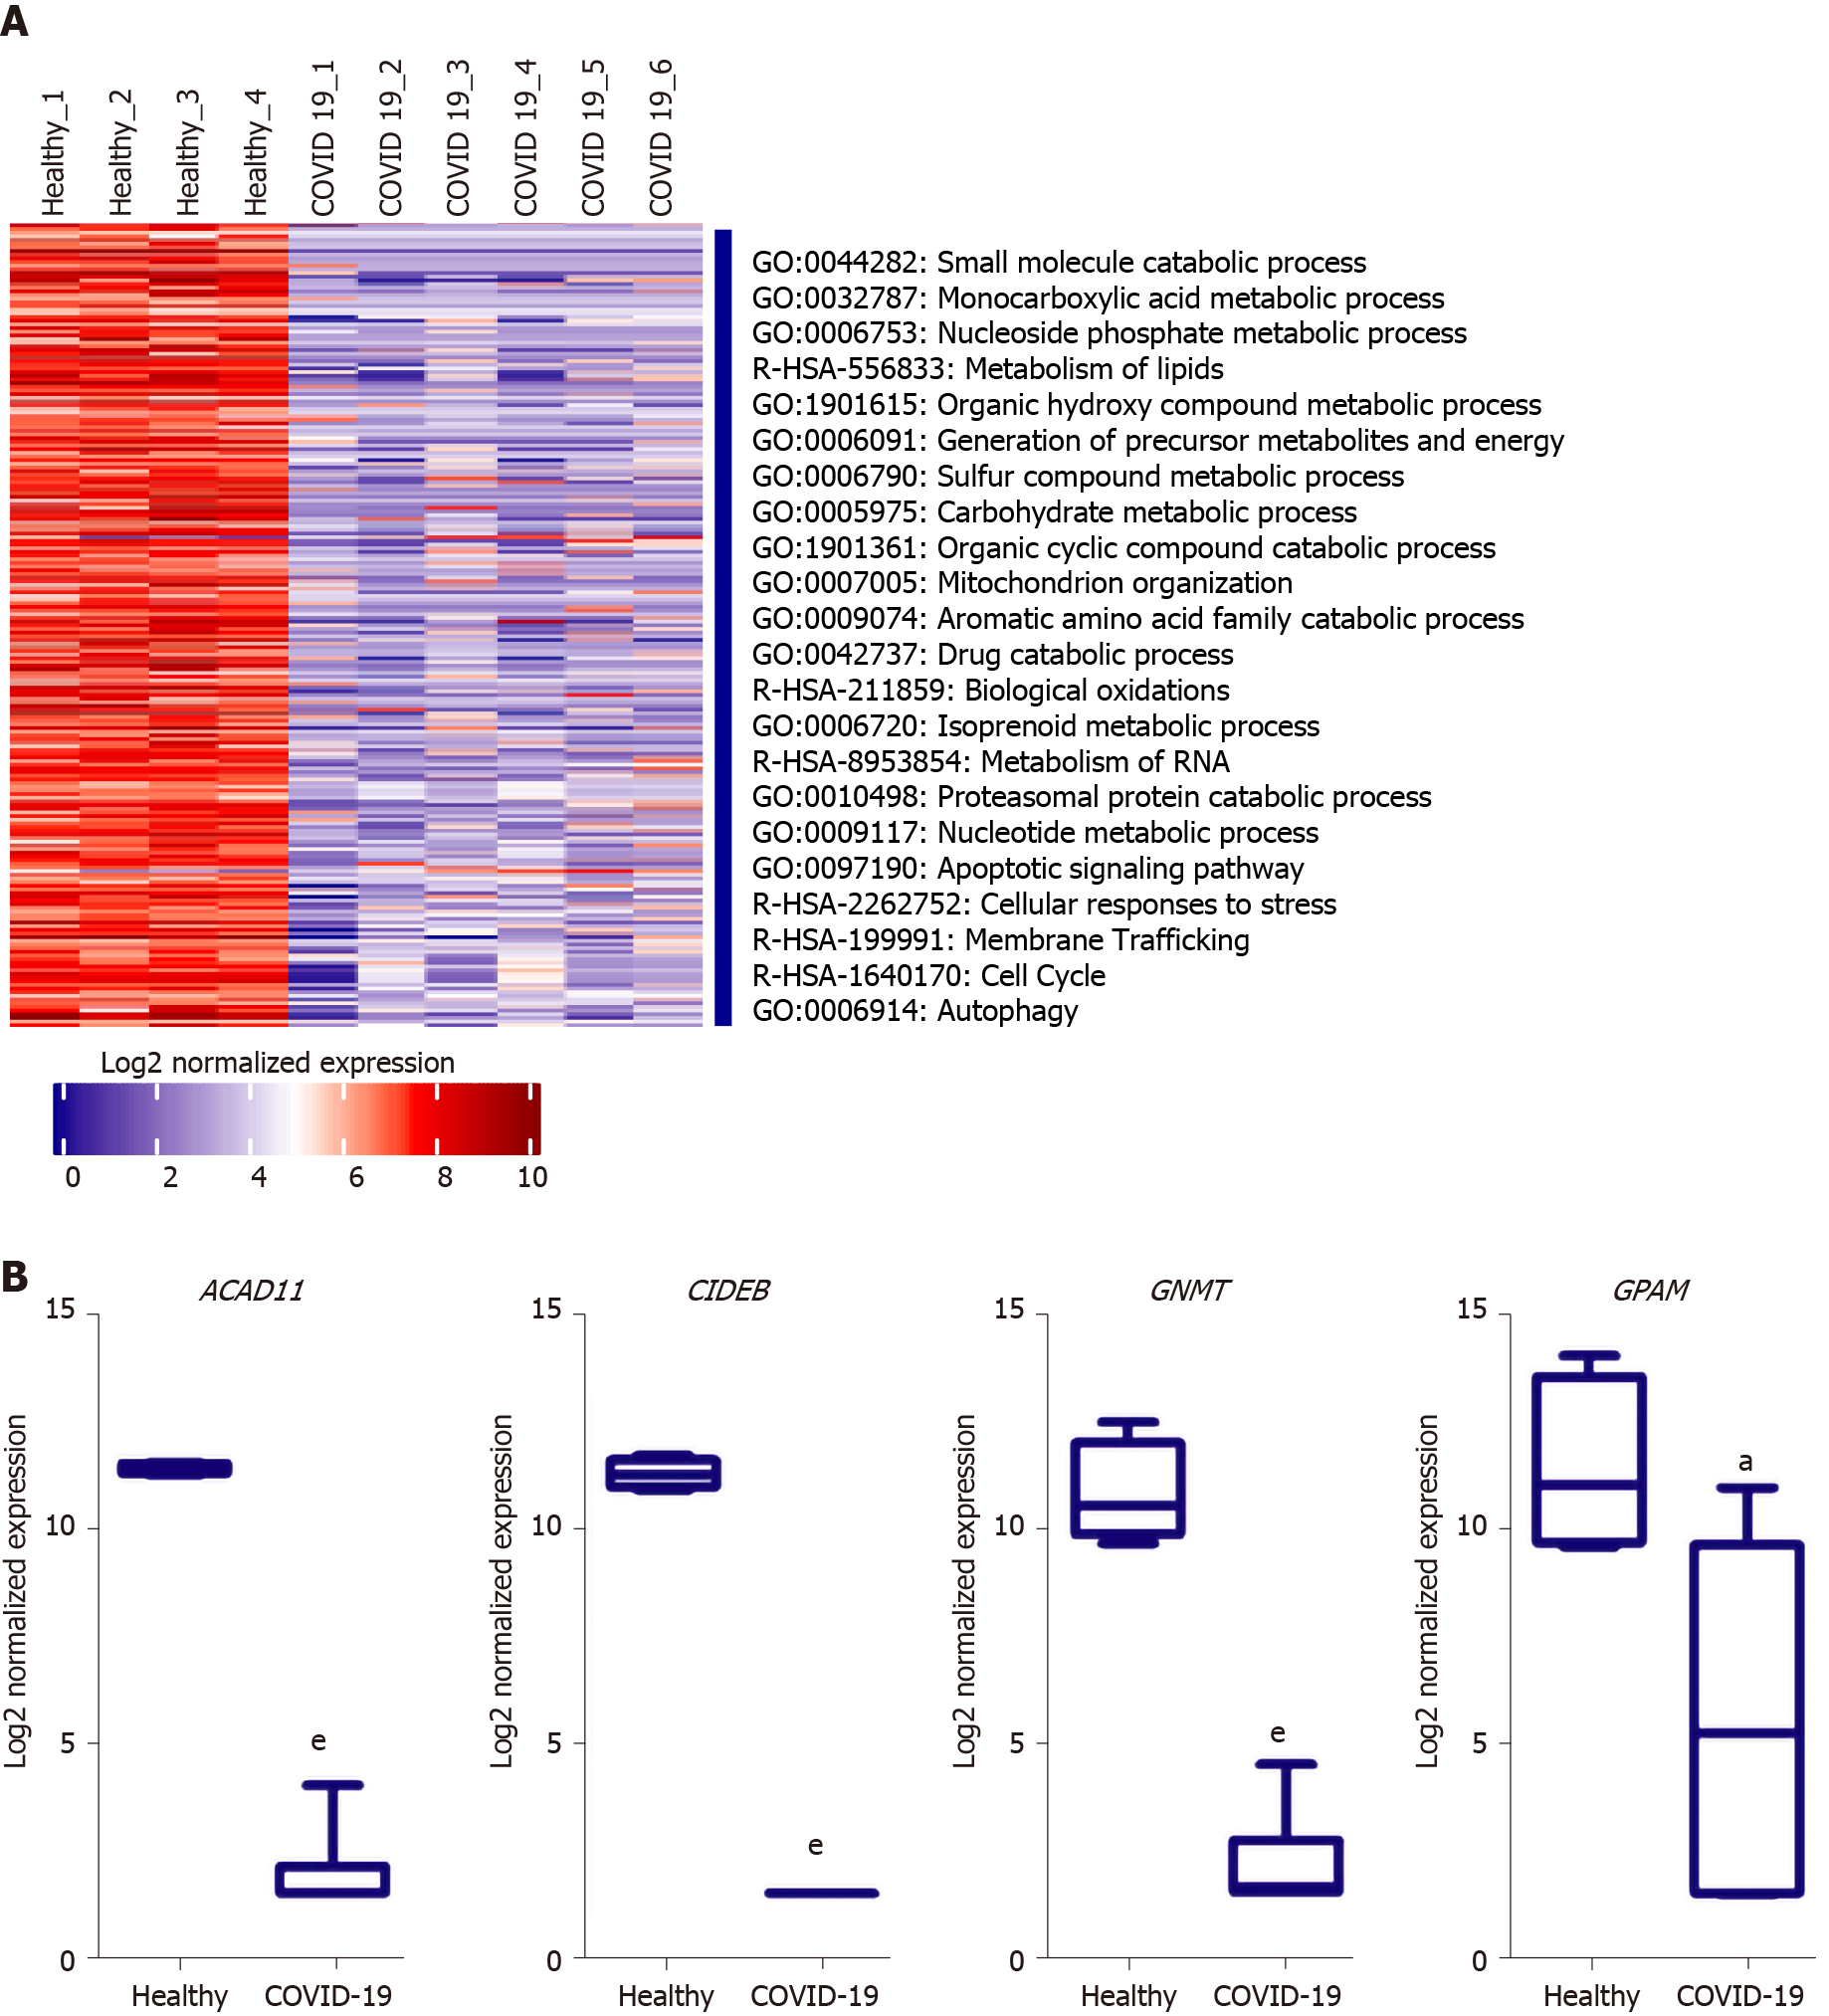
Figure 6 functional clustering analysis of the downregulated transcriptome of severe coronavirus disease 2019 patients liver autopsy tissues.
A: Heatmap representation of the differentially downregulated genes and subsequently enriched pathways and functional clusters in severe acute respiratory syndrome coronavirus 2 (SARS-CoV2) infected liver samples in comparison to baseline expression in healthy tissue samples; B: box plot representation of some of the top downregulated transcripts in SARS-CoV-2 infected liver tissue samples. Data presented as mean ± SE; aP < 0.05, bP < 0.01, cP < 0.001, dP < 0.0005, eP < 0.0001 COVID-19 vs Healthy. ACAD11: acyl-CoA dehydrogenases 11; CIDEB: cell death-inducing DNA fragmentation factor alpha-like effector B; GNMT: glycine N-methyltransferase; GPAM: glycerol-3-phosphate acyltransferase and metabolism.
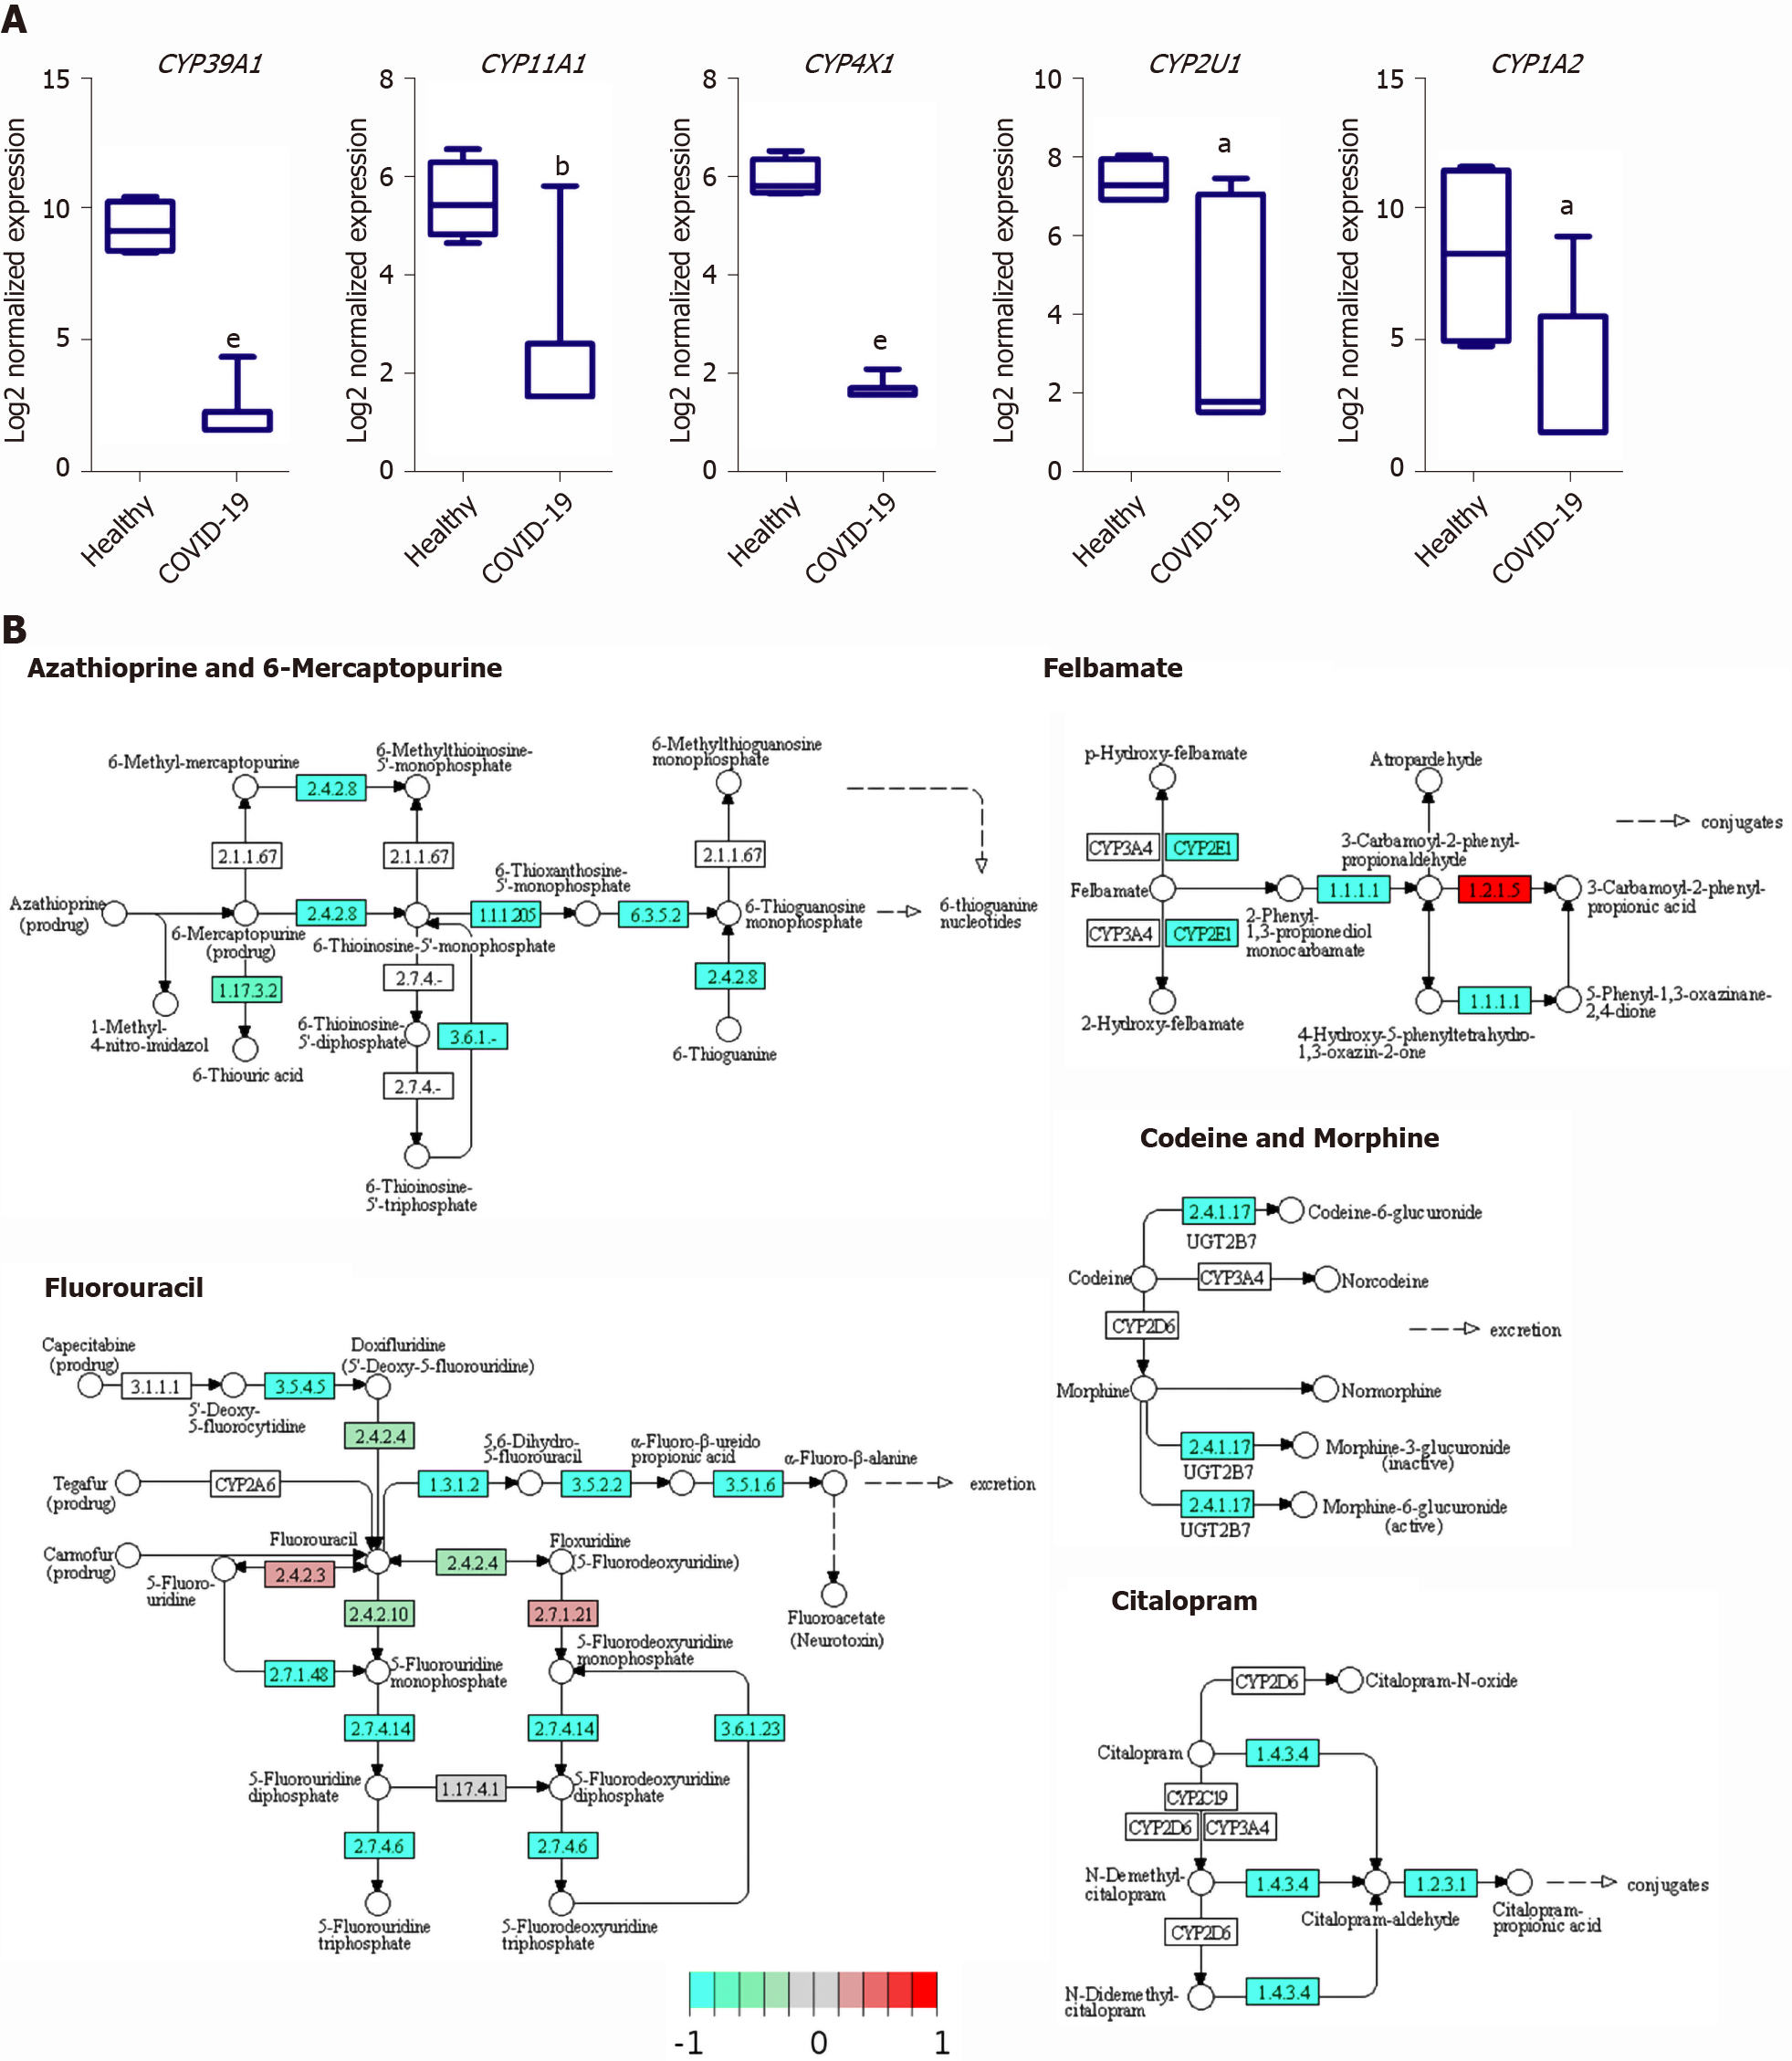
Figure 7 Enrichment of cytochromes P450 family members involved in drug and xenobiotics metabolism in the downregulated transcriptome of severe coronavirus disease 2019 patients liver tissues.
A: Box plot representation of some of the significantly downregulated cytochrome P450 family members; B: Kegg pathway representations of the suppressive effect of severe acute respiratory syndrome coronavirus 2 infection in liver on xenobiotic and drug metabolism through cytochrome P450 and other enzymes. Data presented as mean ± SE; aP < 0.05, bP < 0.01, cP < 0.001, dP < 0.0005, eP < 0.0001 coronavirus disease 2019 (COVID-19) vs Healthy. CYP39A1: Cytochrome P450 family 39 subfamily A member 1; CYP11A1: Cytochrome P450 family 11 subfamily A member 1; CYP4X1: Cytochrome P450 family 4 subfamily X member 1; CYP2U1: Cytochrome P450 family 2 subfamily U member 1; CYP1A2: Cytochrome P450 family 1 subfamily A member 2.
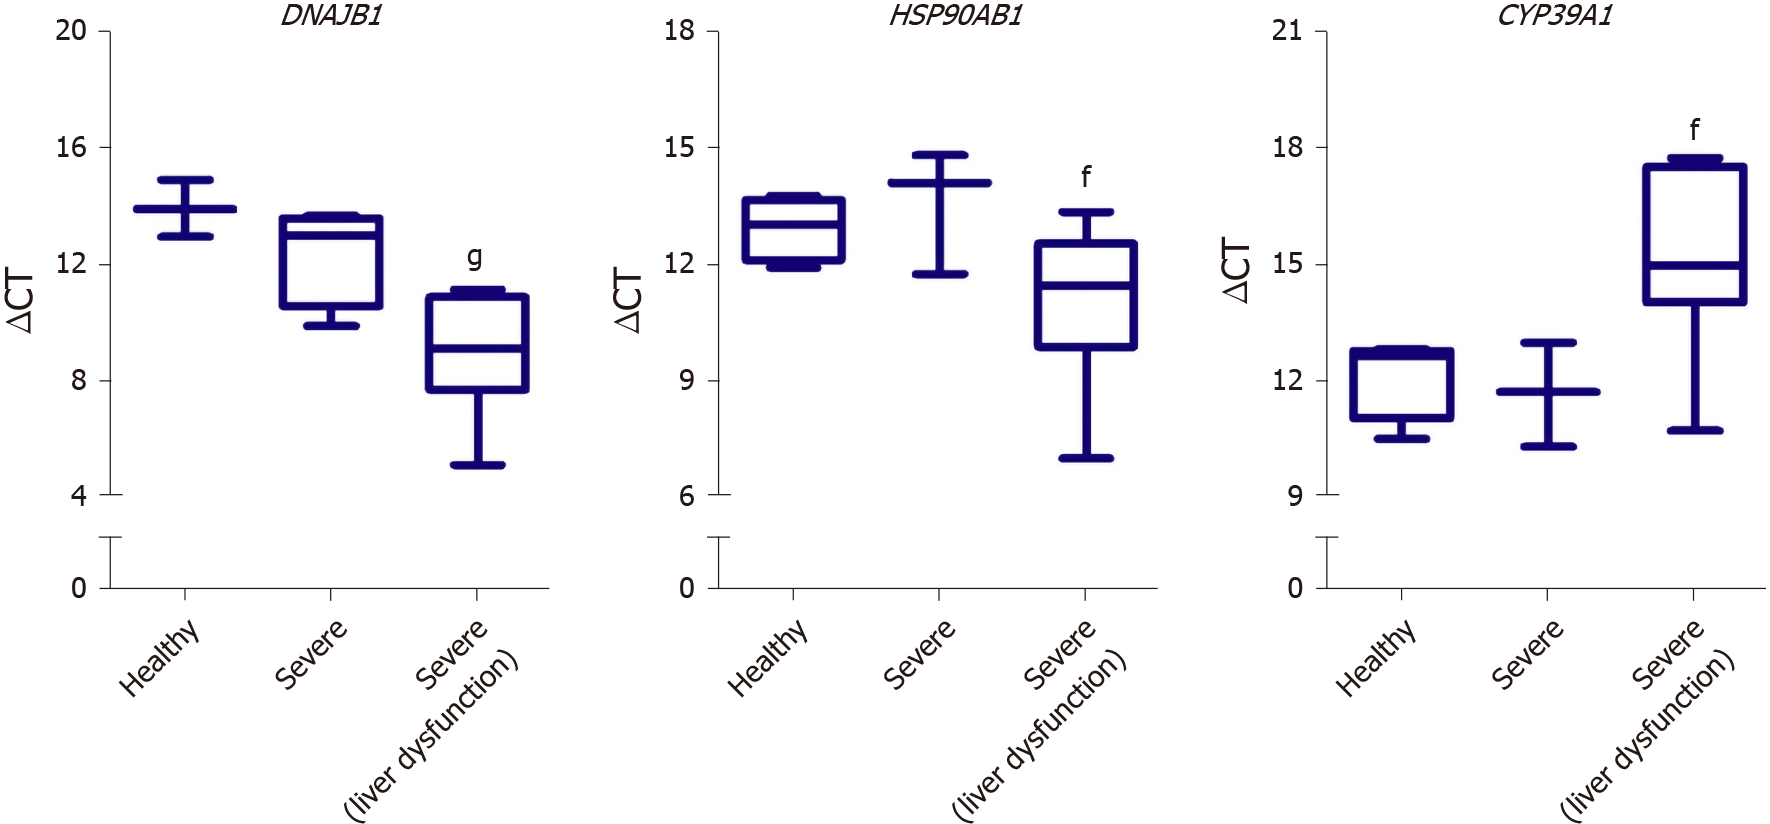
Figure 8 Validation of differentially expressed genes identified from the RNA-seq analysis of the severe coronavirus disease 2019 patients liver samples using blood plasma samples of severe coronavirus disease 2019 patients.
Box plot representation of the gene expression of DNAJB1, HSP90AB1, and CYP39A1 in the blood plasma of severe coronavirus disease 2019 (COVID-19) patients without liver dysfunction (Severe) or with liver dysfunction (Severe (liver dysfunction)) in comparison to non-COVID-19 controls (Healthy); The expression was detected in 4 healthy samples (DNAJB1 expression was only detected in 3 samples), 4 severe COVID-19 samples, and 9 severe COVID-19 samples with liver dysfunction (CYP39A1 expression was only detected in 8 samples); Data presented as mean ± SE; fP < 0.05, gP < 0.001 Severe with liver dysfunction vs Healthy. DNAJB1: DnaJ heat shock protein family (Hsp40) member B1; HSP90AB1: Heat shock protein 90 alpha family class B member 1; CYP39A1: Cytochrome P450 family 39 subfamily A member 1.
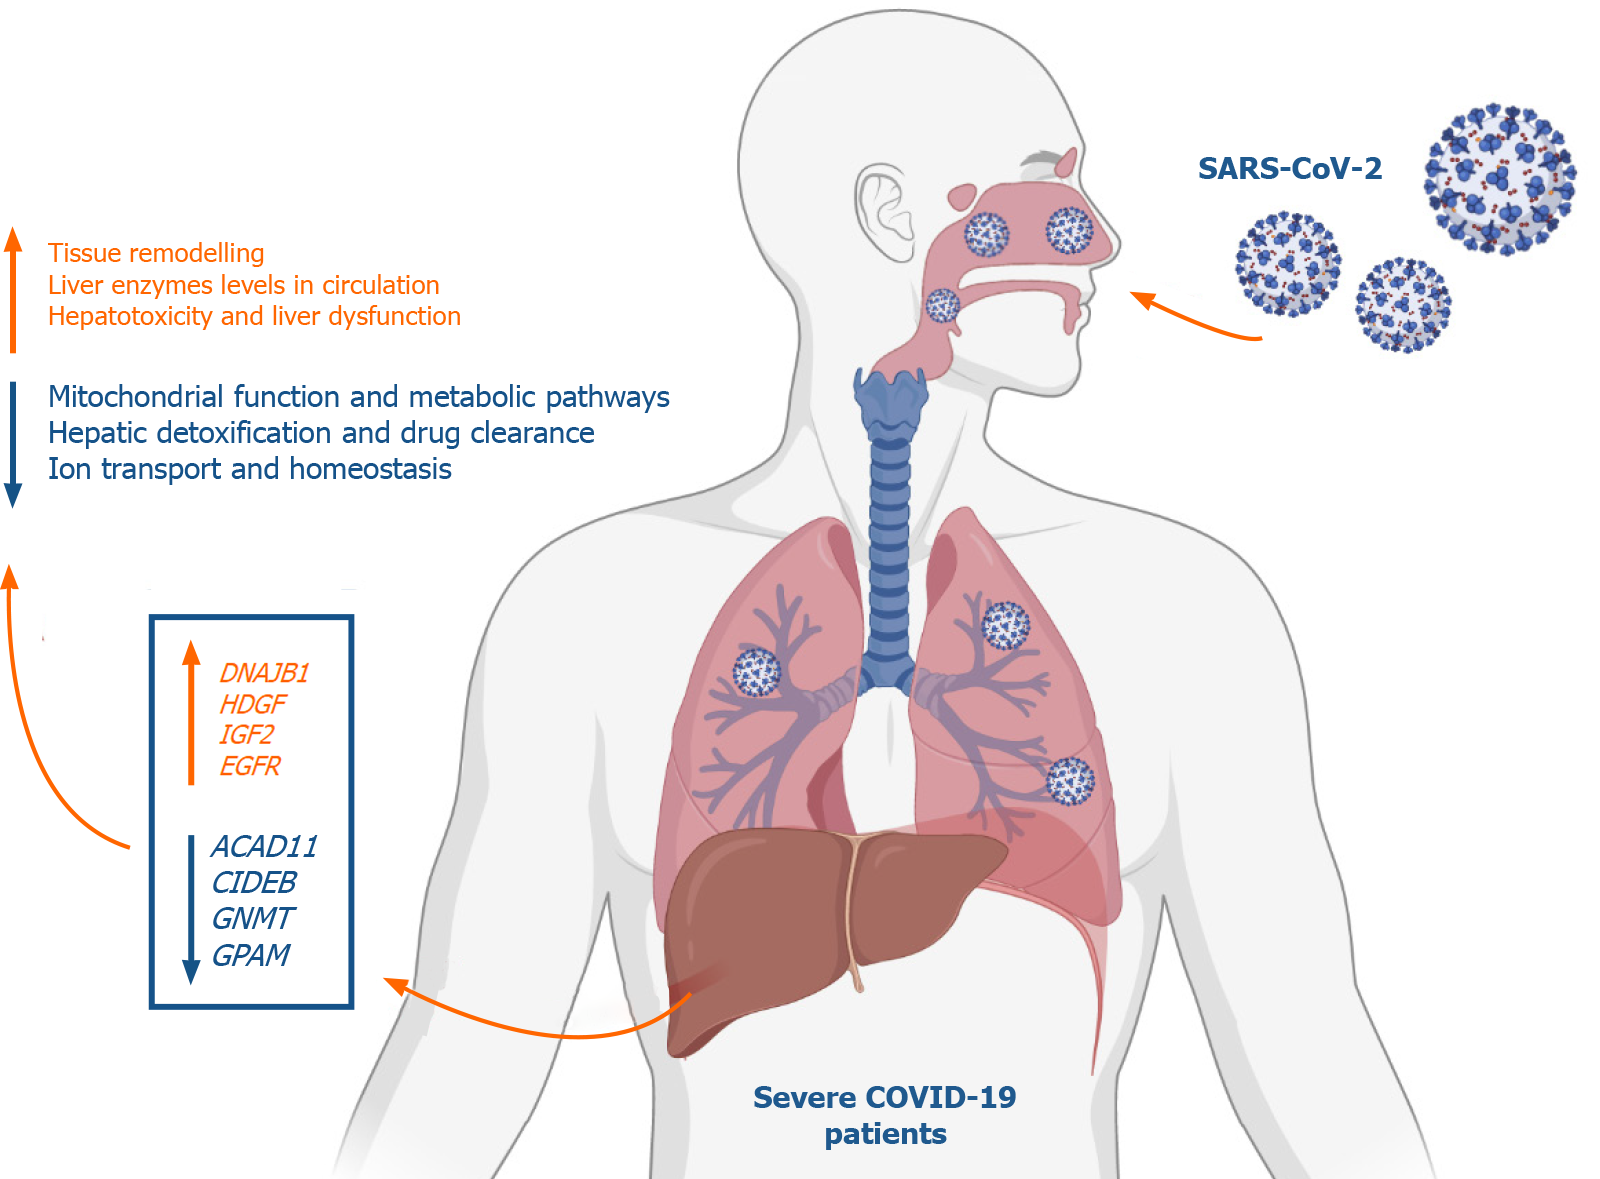
Figure 9 Summary of the study findings.
At advanced stages, severe acute respiratory syndrome coronavirus 2 infection appears to elicit transcriptional shifts in liver tissue resulting in increased G-coupled protein receptors signaling, tissue remodeling, transmembrane transport, vesicle formation and cell projections morphogenesis. On the other hand, metabolic and biosynthetic pathways including metabolism of drugs and xenobiotics as well as mitochondrial processes and ions homeostasis regulatory mechanisms appear to be suppressed in coronavirus disease 2019 (COVID-19) patients. In response to these transcriptional shifts, we speculate that severe COVID-19 patients would be subjected to hepatic injury and tissue remodeling which may results in the clinically observed liver dysfunction, low liver detoxification capacity and increased liver enzymes. Figure was created with BioRender.com. DNAJB1: DnaJ heat shock protein family (Hsp40) member B1; HDGF: Hepatoma-derived growth factor; IGF2: Insulin growth factor 2; EGFR: Epidermal growth factor receptor; ACAD11: Acyl-CoA dehydrogenases 11; CIDEB: Cell death-inducing DNA fragmentation factor alpha-like effector B; GNMT: Glycine N-methyltransferase; GPAM: Glycerol-3-phosphate acyltransferase and metabolism.
- Citation: Hammoudeh SM, Hammoudeh AM, Bhamidimarri PM, Mahboub B, Halwani R, Hamid Q, Rahmani M, Hamoudi R. Insight into molecular mechanisms underlying hepatic dysfunction in severe COVID-19 patients using systems biology. World J Gastroenterol 2021; 27(21): 2850-2870
- URL: https://www.wjgnet.com/1007-9327/full/v27/i21/2850.htm
- DOI: https://dx.doi.org/10.3748/wjg.v27.i21.2850


