Copyright
©The Author(s) 2021.
World J Gastroenterol. May 21, 2021; 27(19): 2415-2433
Published online May 21, 2021. doi: 10.3748/wjg.v27.i19.2415
Published online May 21, 2021. doi: 10.3748/wjg.v27.i19.2415
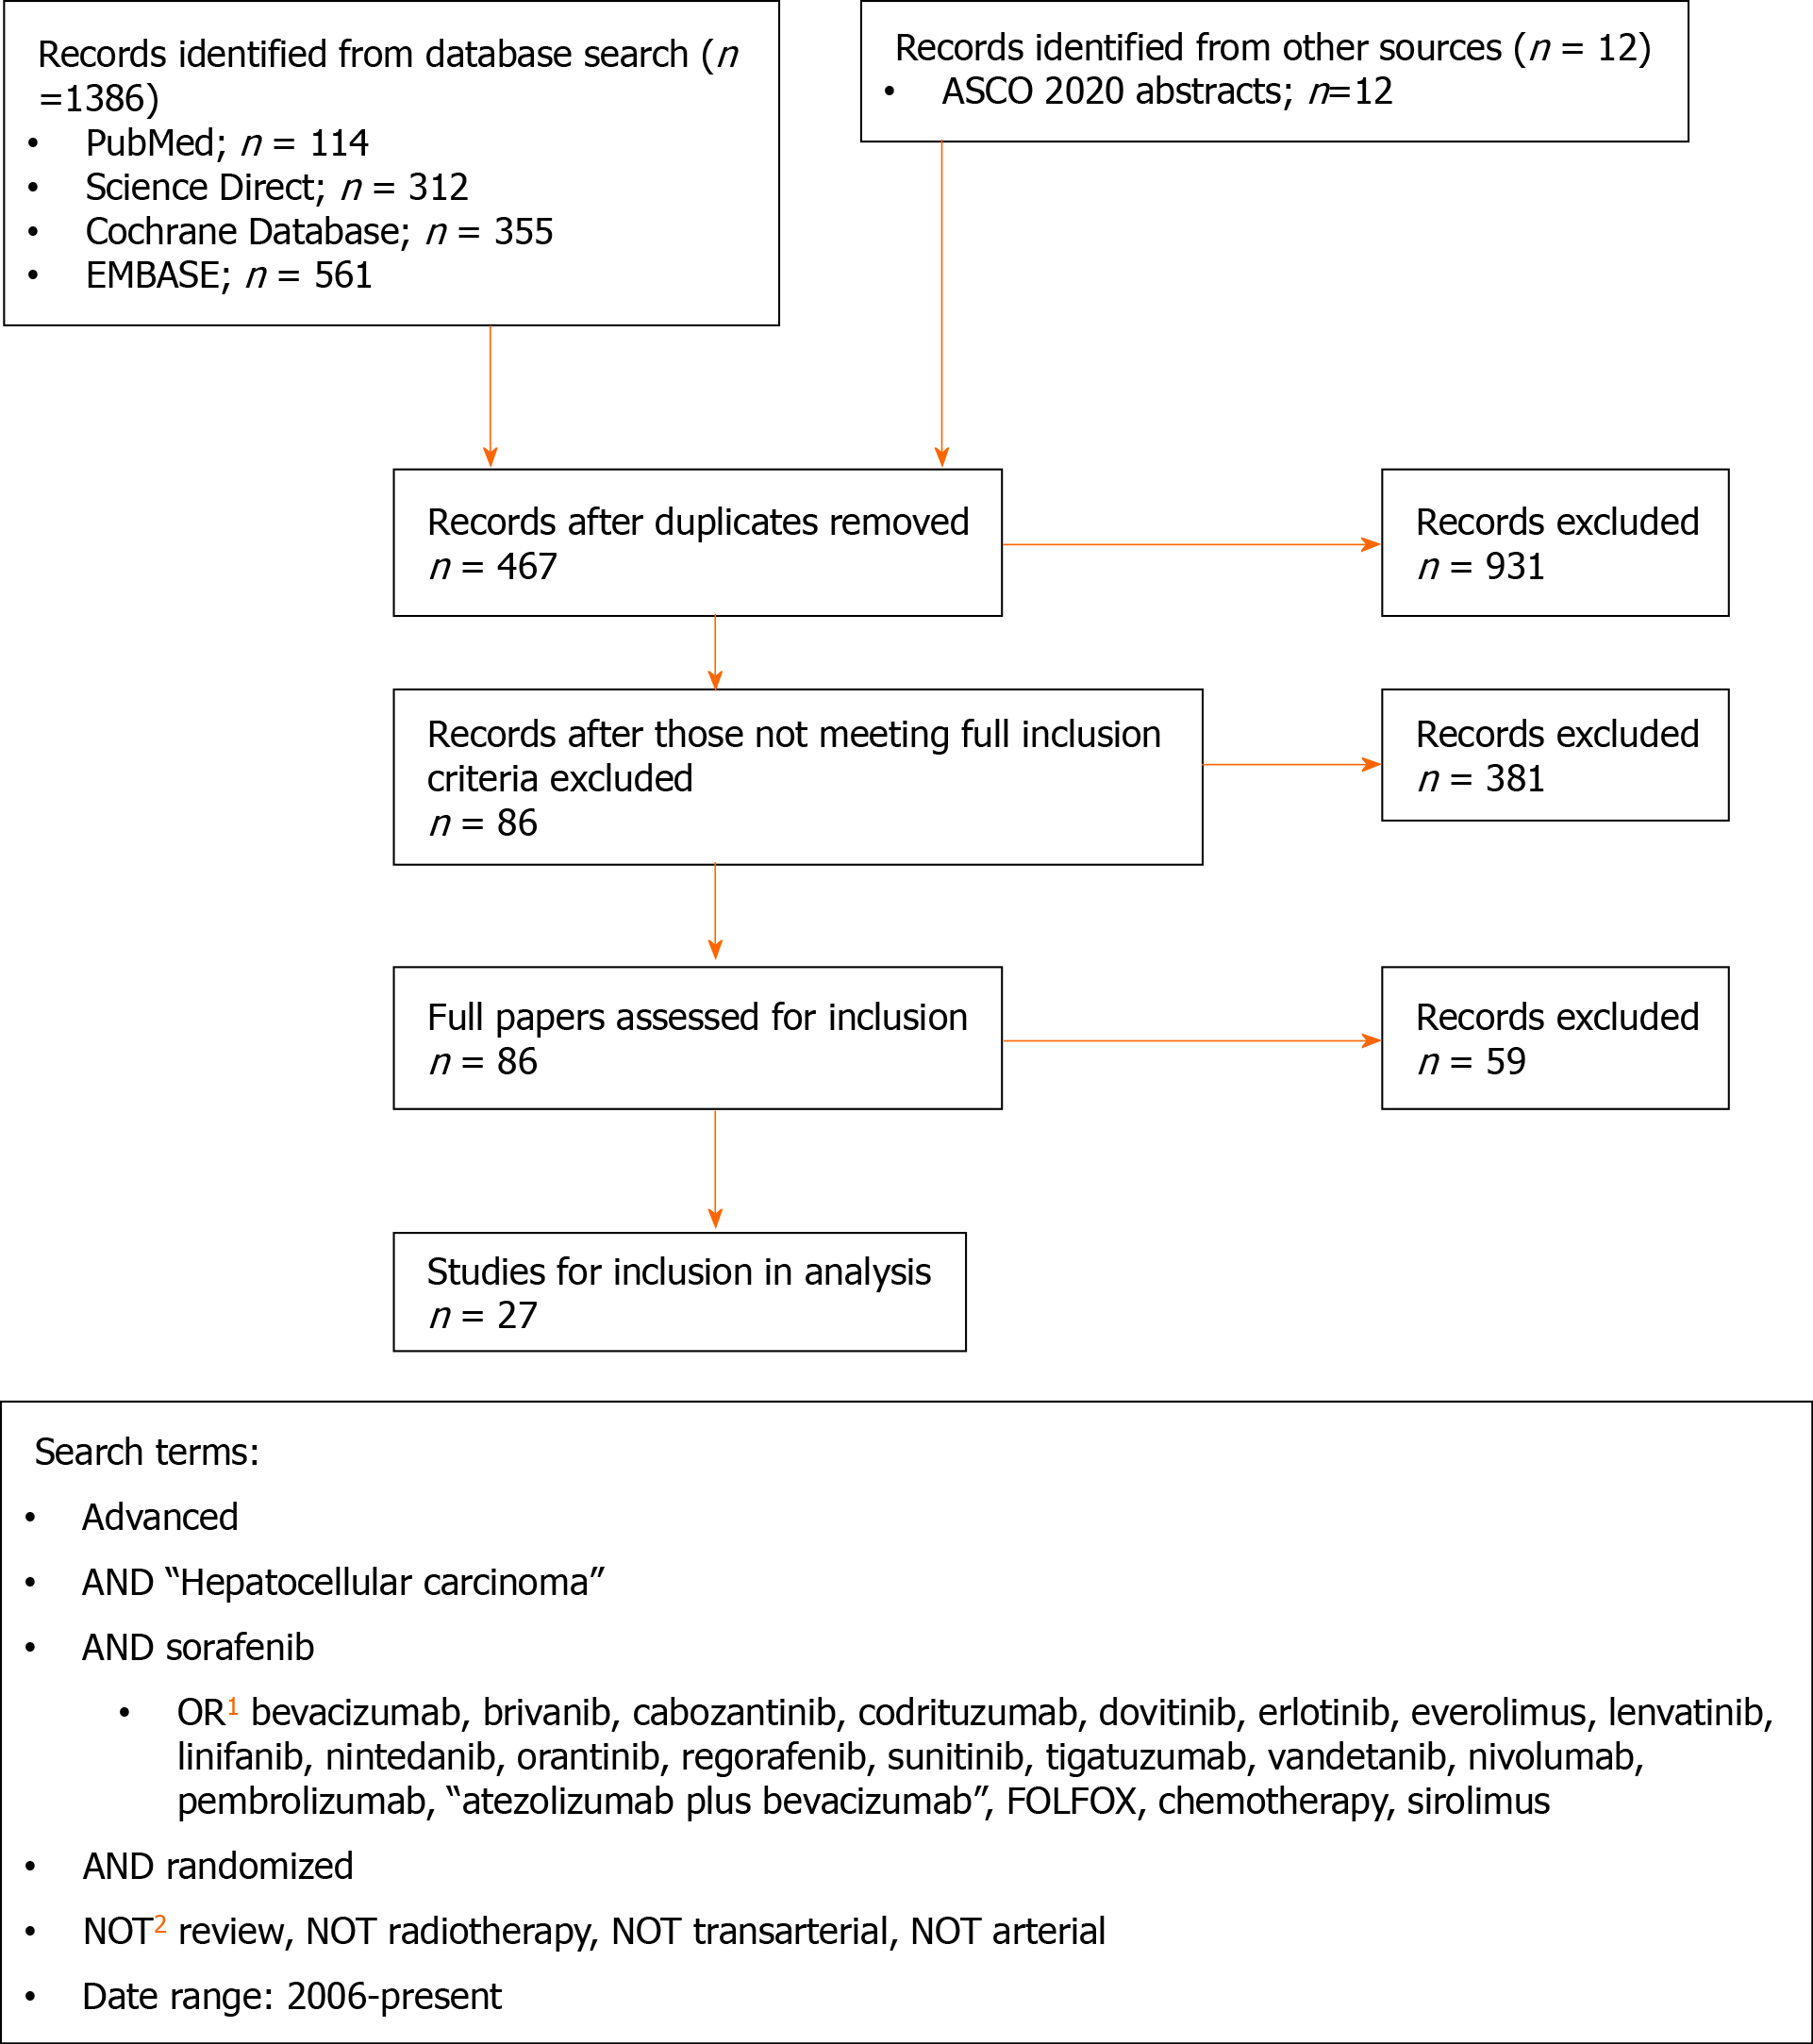
Figure 1 Flow chart of study selection and search terms.
Different therapeutics were searched for using individual searches to allow easier processing of the results; NOT was used for databases allowing use of this operator. ASCO: American Society of Clinical Oncology.
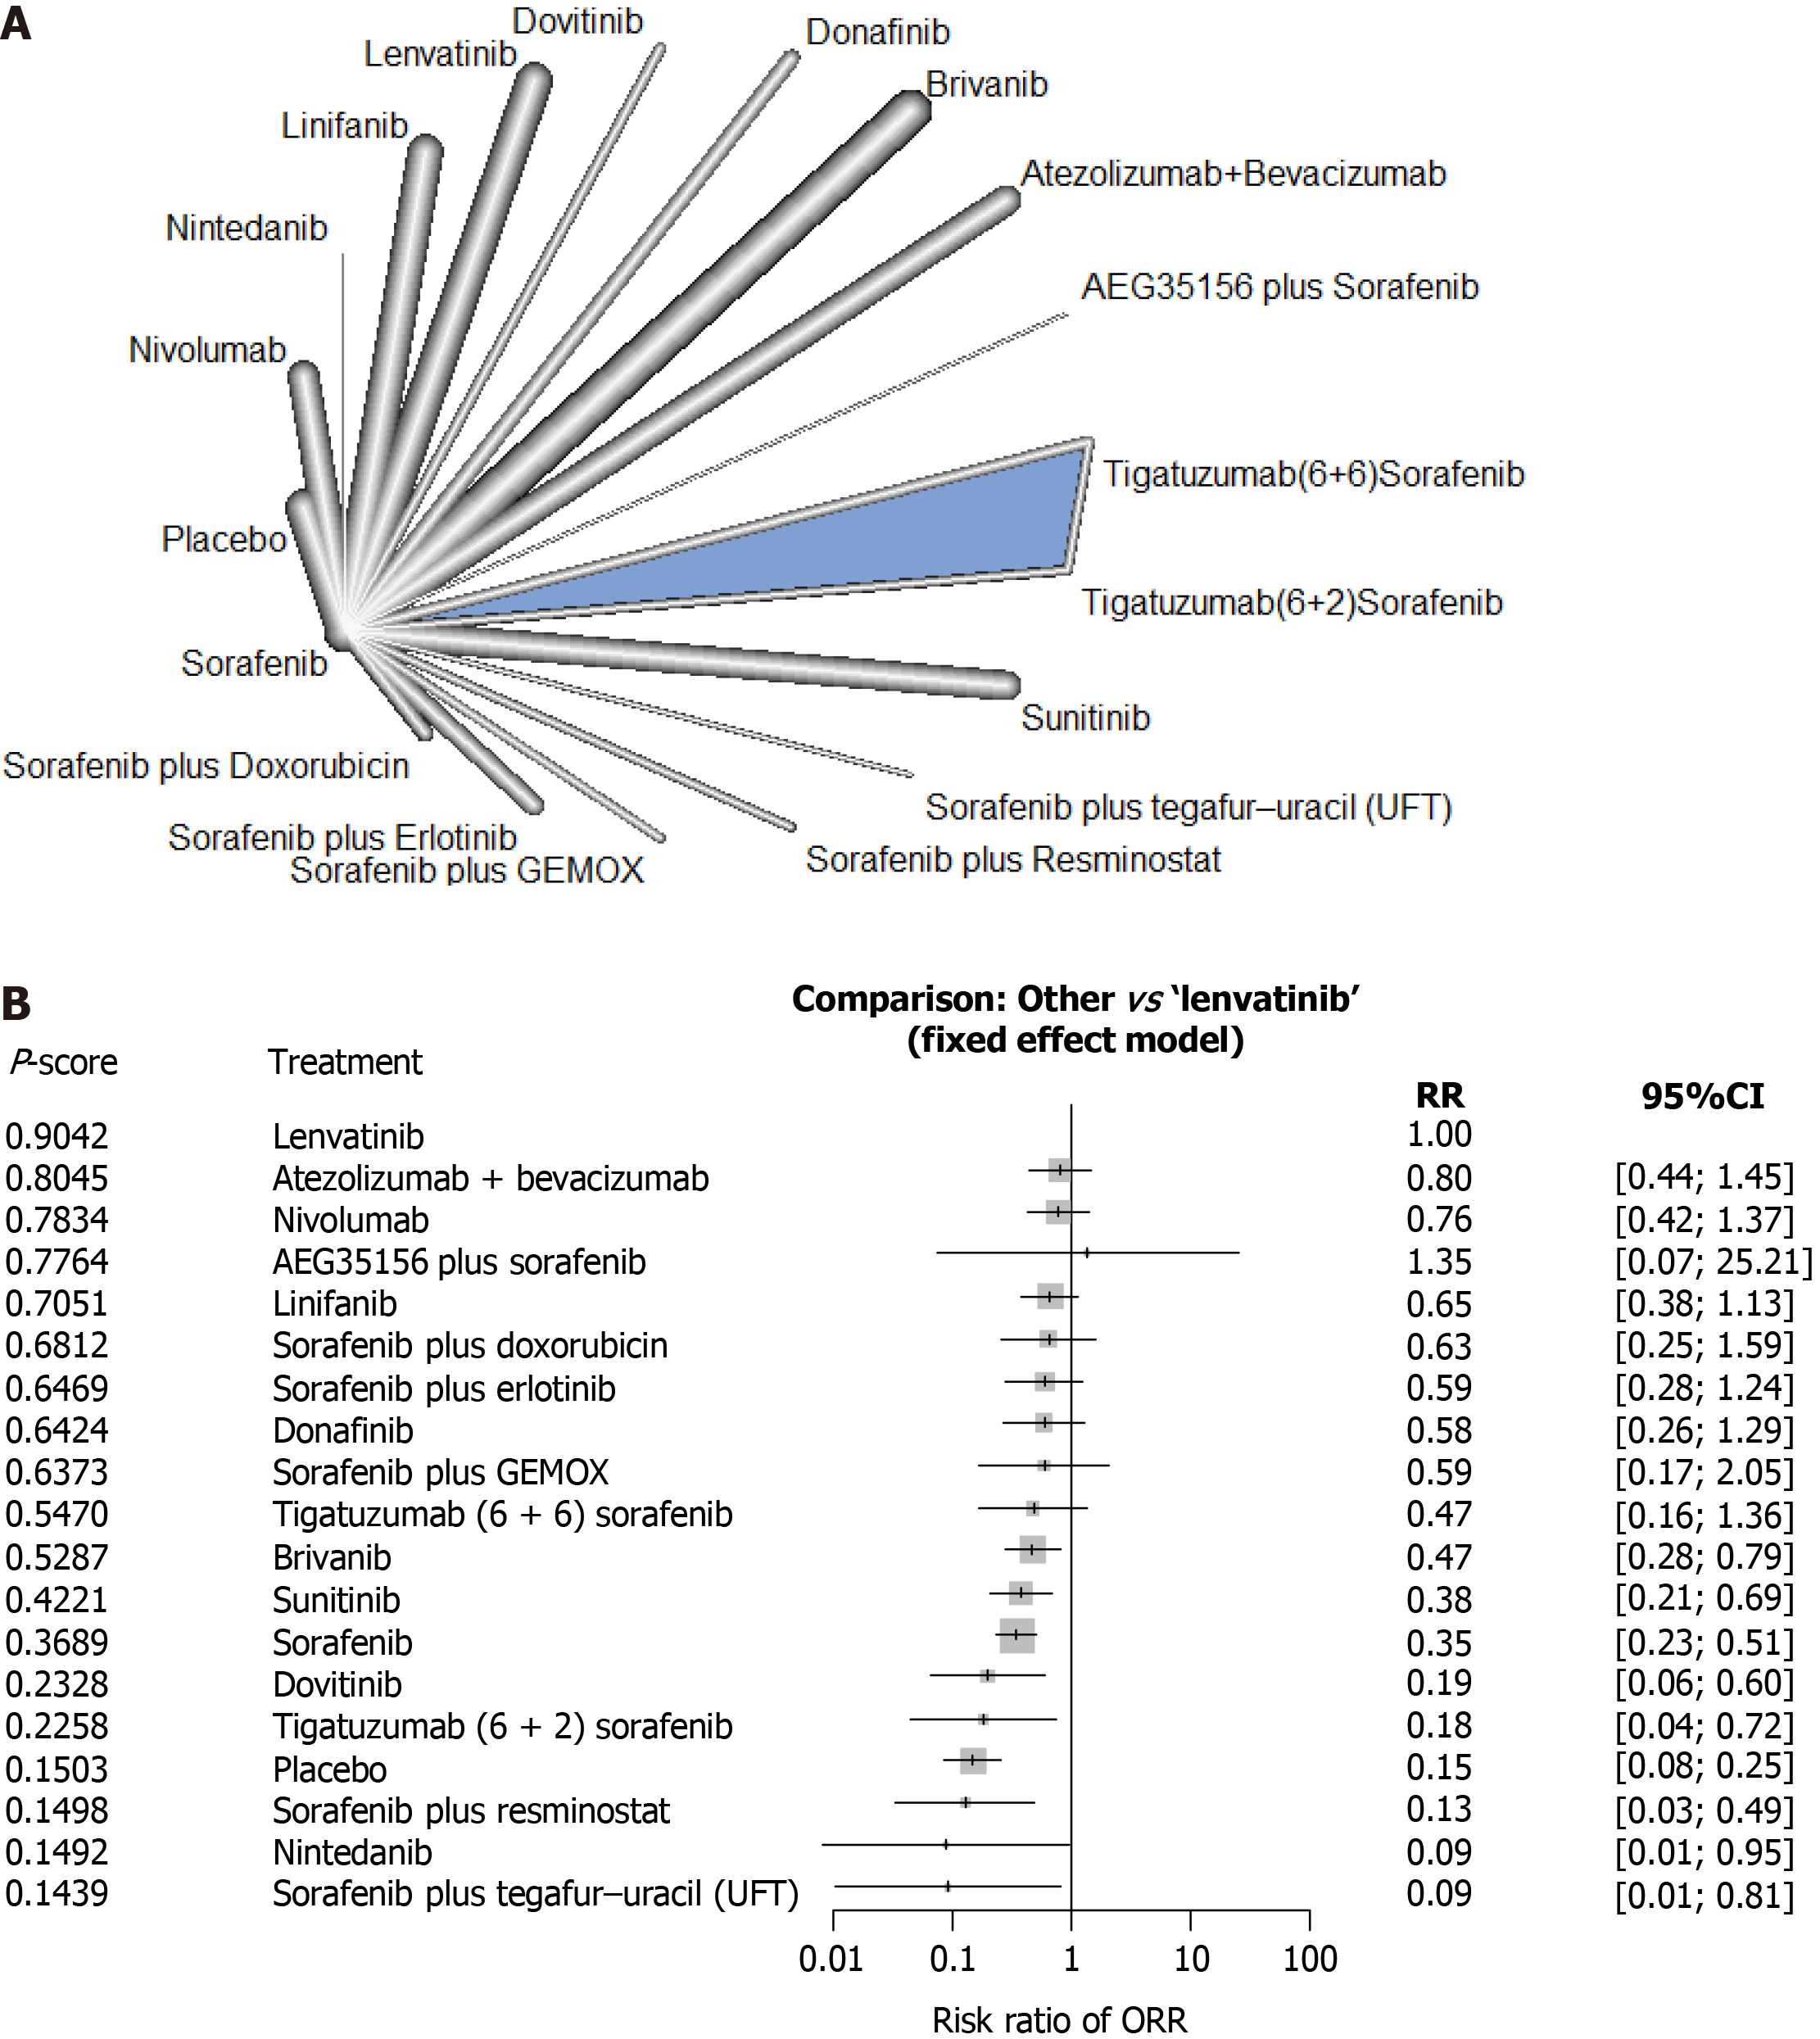
Figure 2 Response rates of first-line systemic therapy in patients with advanced hepatocellular carcinoma.
A: Network diagram; B: Interventions ranked by P value with risk ratios and 95% confidence interval for overall response rate for each treatment vs lenvatinib. CI: Confidence interval; GEMOX: Gemcitabine and oxaliplatin; ORR: Overall response rate; RR: Risk ratio.
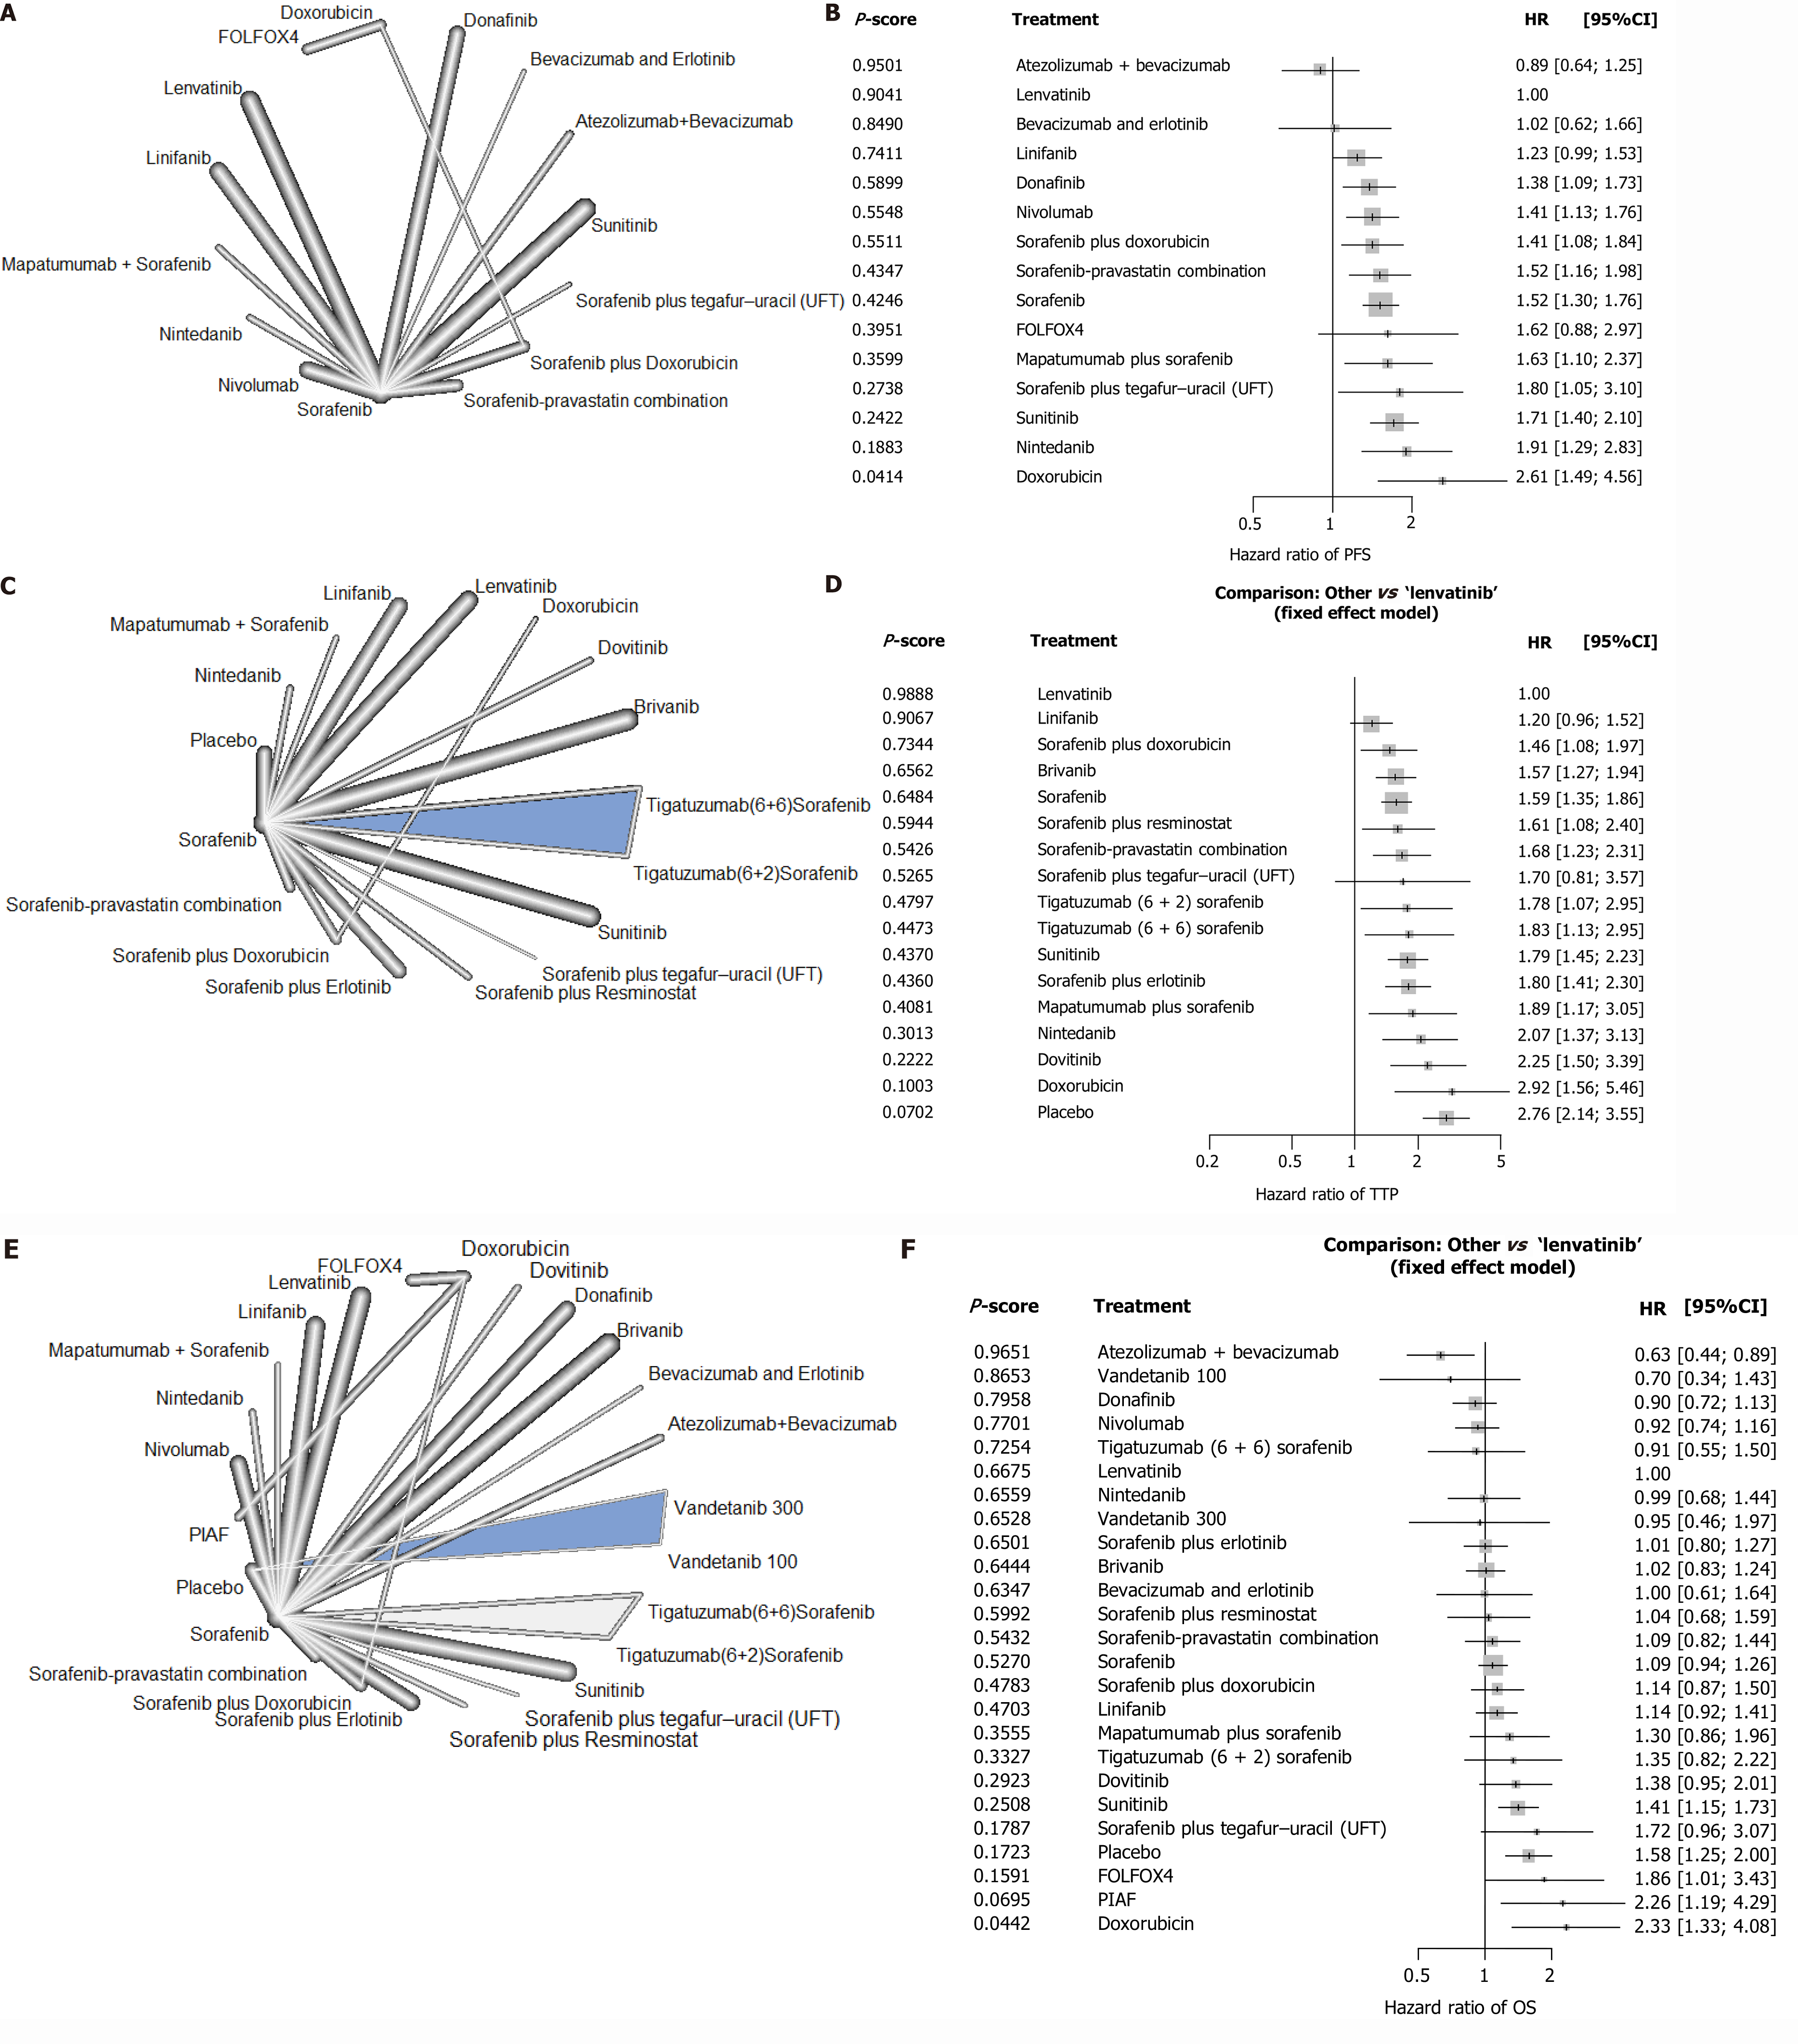
Figure 3 Survival outcomes in patients with advanced hepatocellular carcinoma following first-line systemic therapy.
A, C, and E: Network diagrams; B: Interventions ranked by P value with hazard ratios for progression-free survival, D: Time to progression and F: overall survival for each treatment vs lenvatinib. CI: Confidence interval; FOLFOX4: Oxaliplatin/folinic acid/5-fluorouracil; HCC: Hepatocellular carcinoma; HR: Hazard ratio; OS: Overall survival; PIAF: Cisplatin/interferon α-2b/doxorubicin/5-fluorouracil; TTP: Time to progression.
- Citation: Han Y, Zhi WH, Xu F, Zhang CB, Huang XQ, Luo JF. Selection of first-line systemic therapies for advanced hepatocellular carcinoma: A network meta-analysis of randomized controlled trials. World J Gastroenterol 2021; 27(19): 2415-2433
- URL: https://www.wjgnet.com/1007-9327/full/v27/i19/2415.htm
- DOI: https://dx.doi.org/10.3748/wjg.v27.i19.2415


