Copyright
©The Author(s) 2021.
World J Gastroenterol. May 21, 2021; 27(19): 2394-2414
Published online May 21, 2021. doi: 10.3748/wjg.v27.i19.2394
Published online May 21, 2021. doi: 10.3748/wjg.v27.i19.2394
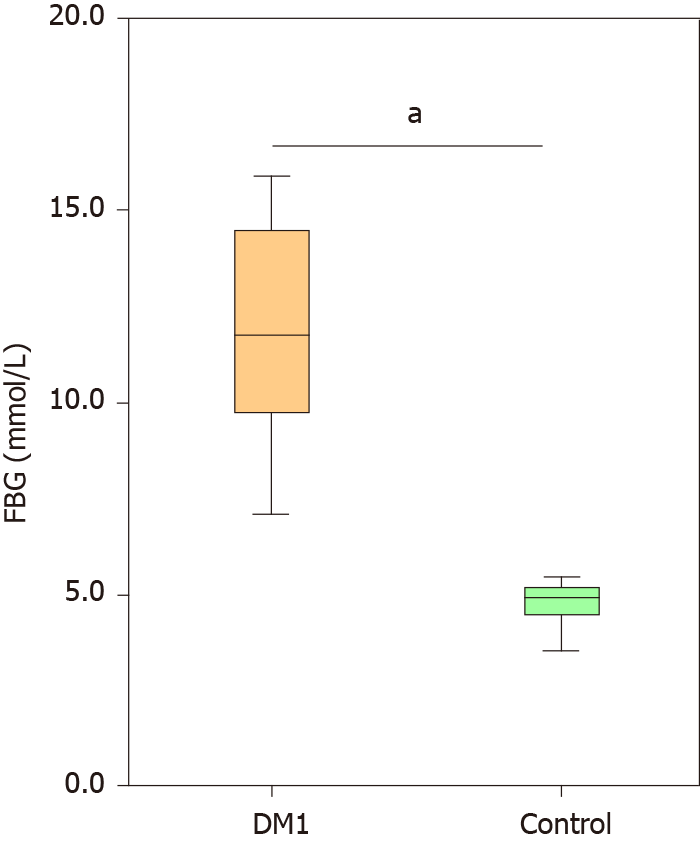
Figure 1 Comparison of the levels of fasting blood glucose between Chinese children with type 1 diabetes mellitus and healthy controls.
Data are presented as the mean ± SD. aP < 0.05, compared with control group. FBG: Fasting blood glucose; DM1: Type 1 diabetes mellitus.
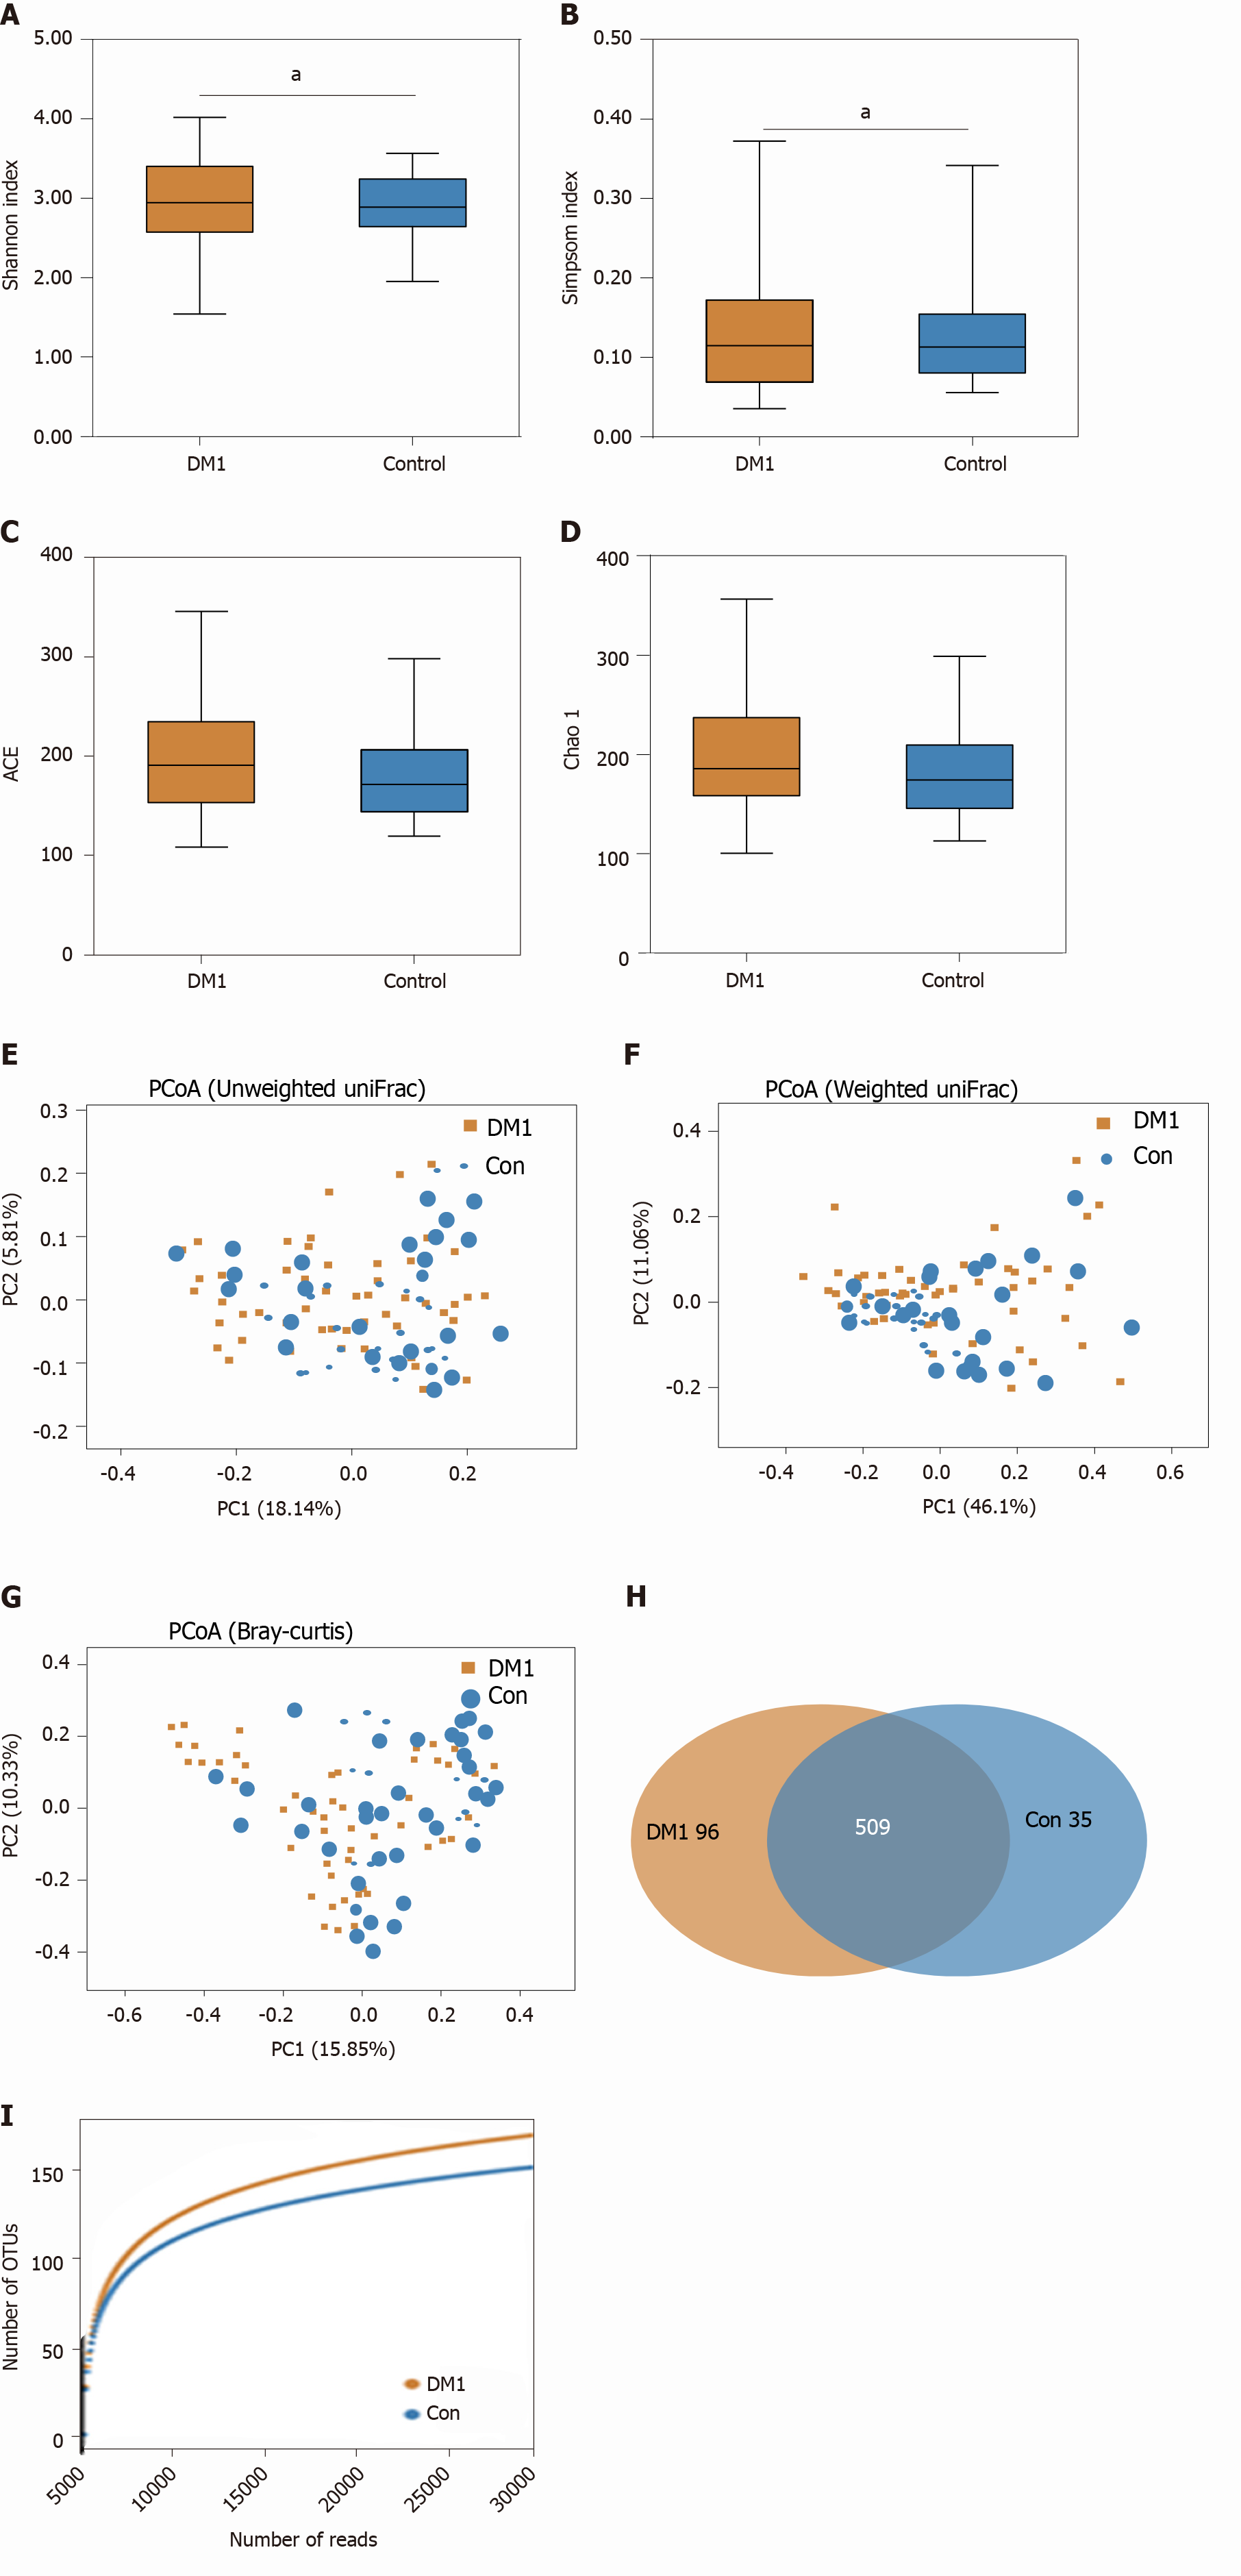
Figure 2 Altered bacterial diversity and richness of the fecal microbiota in Chinese children with type 1 diabetes mellitus.
A-D: The diversity indices, such as Shannon (A), and Simpson (B), and the richness indices, such as the abundance-based coverage estimator (C), and Chao1 (D), were used to evaluate the overall structure of the fecal microbiota in patients with type 1 diabetes mellitus (T1DM) and healthy controls. Data are presented as the mean ± SD. Unpaired t-tests (two-tailed) were used to analyze variation between the two groups; E-G: Principal coordinate analysis plots of individual fecal microbiota based on unweighted (E) and weighted (F) UniFrac distance, and Bray–Curtis dissimilarity (G) in patients with T1DM and healthy controls. Each symbol represents a single sample; H: Venn diagram illustrating the overlap of operational taxonomic units (OTUs) in T1DM-associated fecal microbiota between the two groups; I: Rarefaction curves used to estimate the richness (at a 97% level of similarity) of T1DM-associated fecal microbiota between the two groups. The vertical axis shows the expected number of OTUs after sampling the number of tags or sequences shown on the horizontal axis. aP < 0.05. OTUs: Operational taxonomic units; ACE: Abundance-based coverage estimator; PCoA: Principal coordinate analysis; Con: Control; DM1: Type 1 diabetes mellitus.
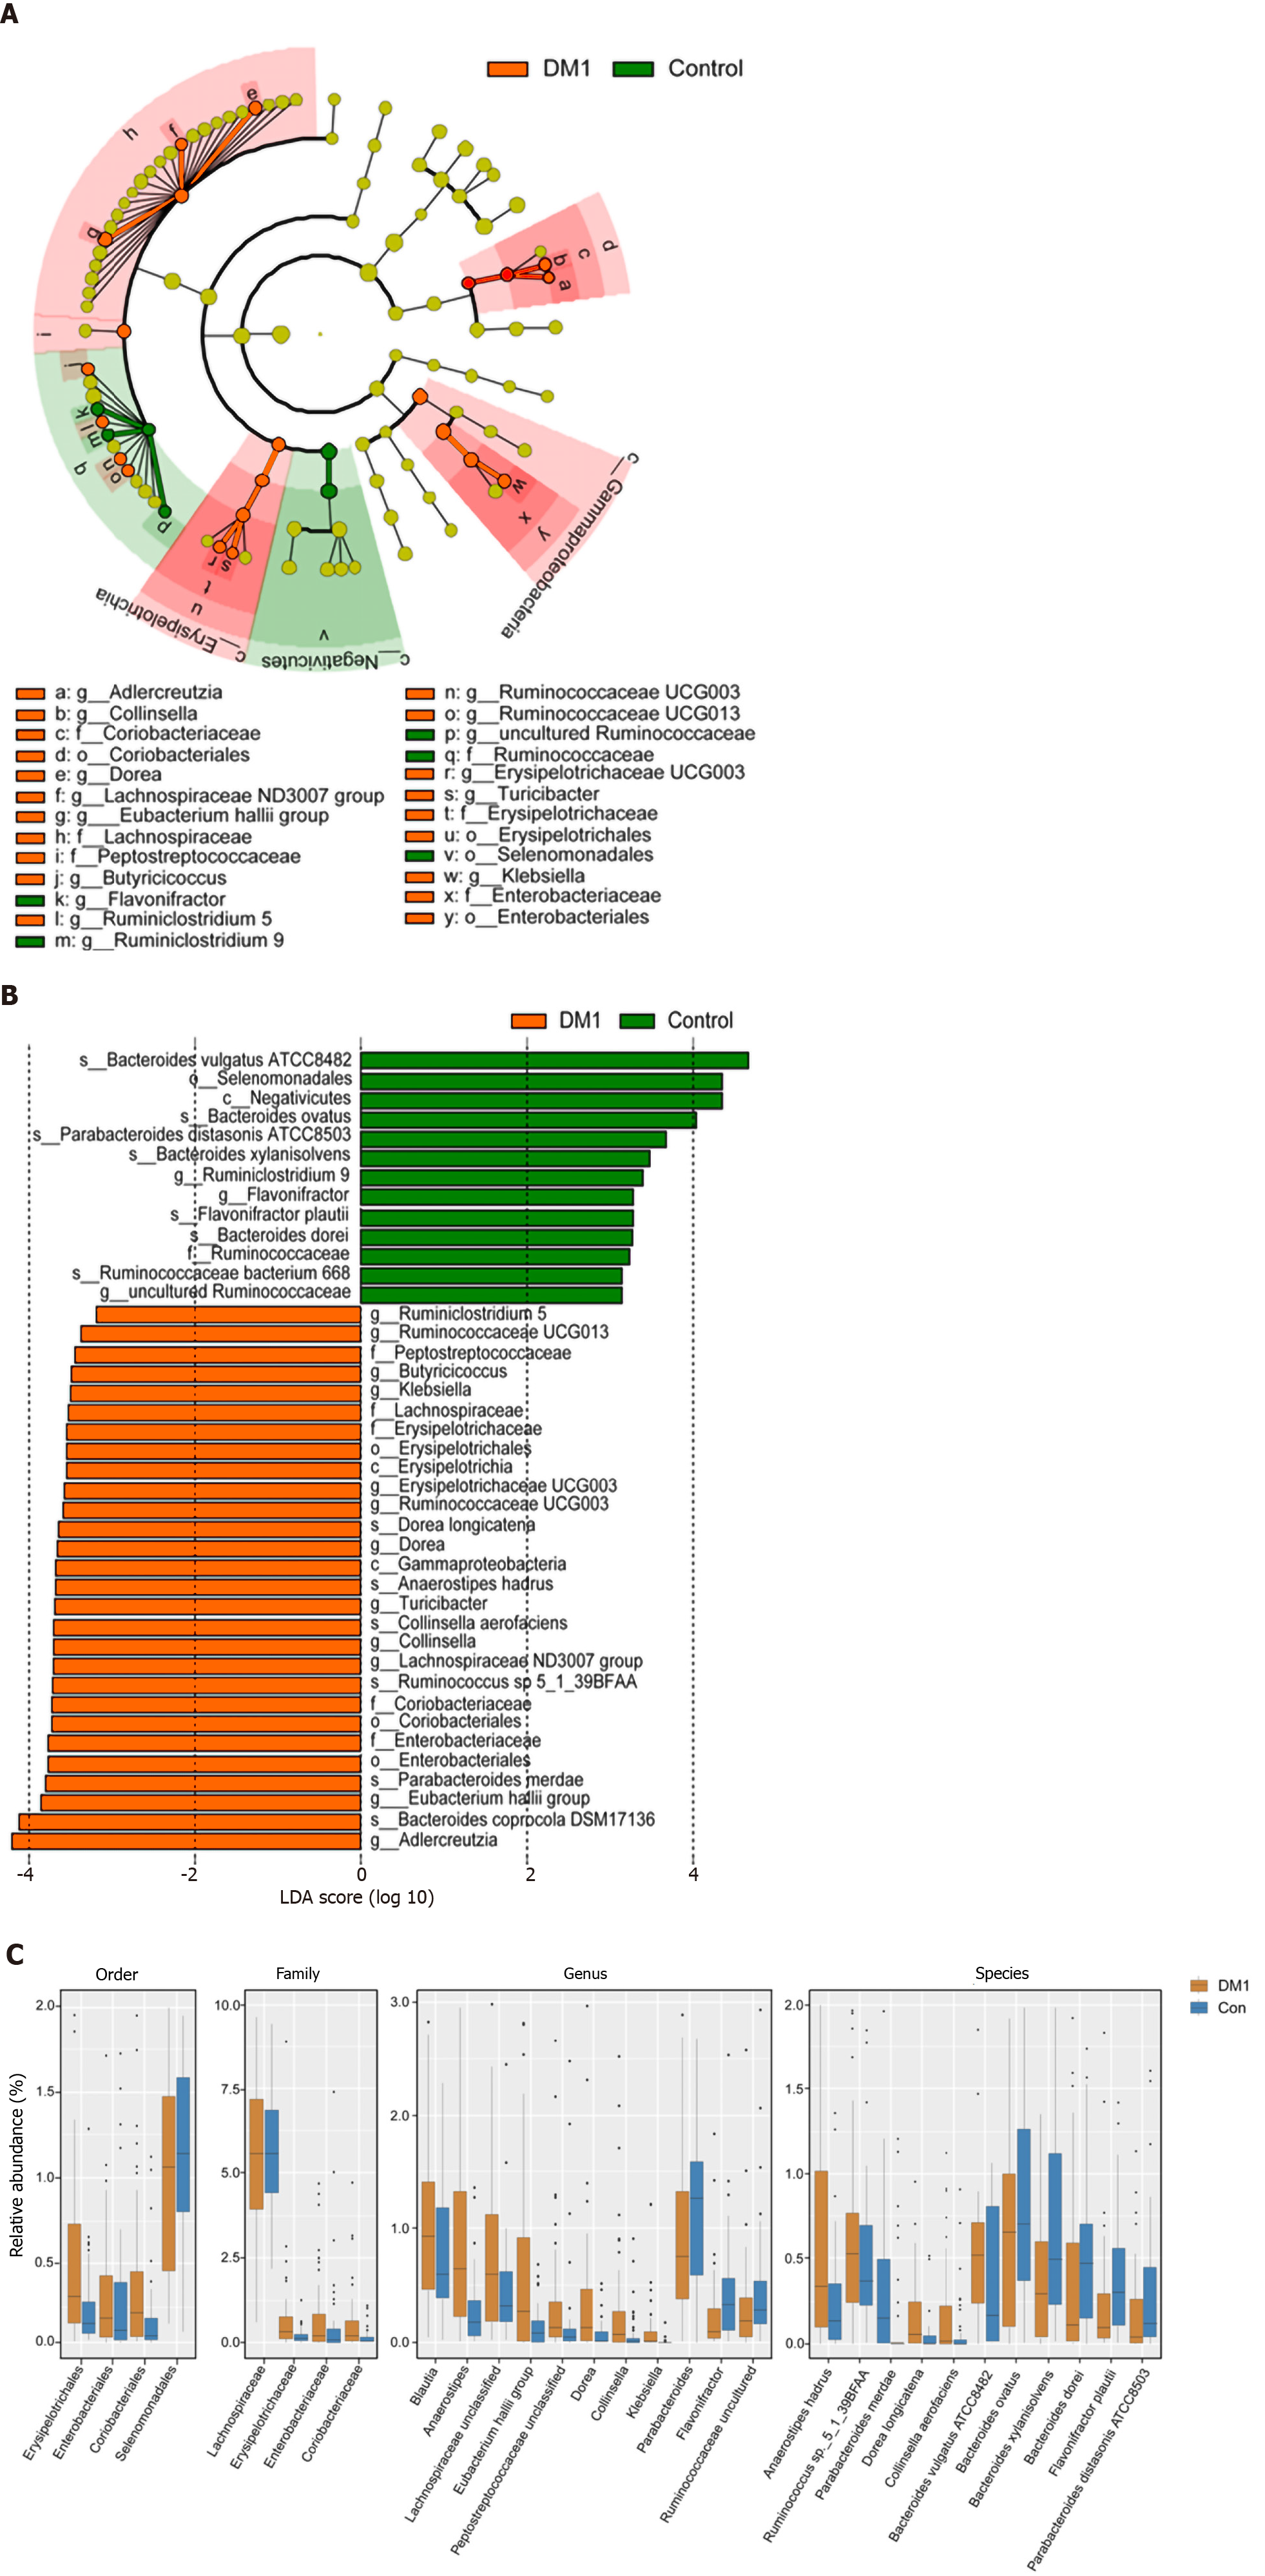
Figure 3 Differential bacterial taxa between Chinese children with type 1 diabetes mellitus and healthy controls.
The linear discriminant analysis effect size identifies the taxa with the greatest differences in abundance between children with type 1 diabetes mellitus (T1DM) and healthy controls. A and B: Only the taxa meeting a significant linear discriminant analysis threshold value of > 2 are shown; C: Comparisons of the relative abundance of abundant bacterial taxa at the levels of the order, family, genus, and species. Data are presented as the mean ± SD. Mann–Whitney U-tests were used to analyze variation between children with T1DM and healthy controls. Con: Control; DM1: Type 1 diabetes mellitus.
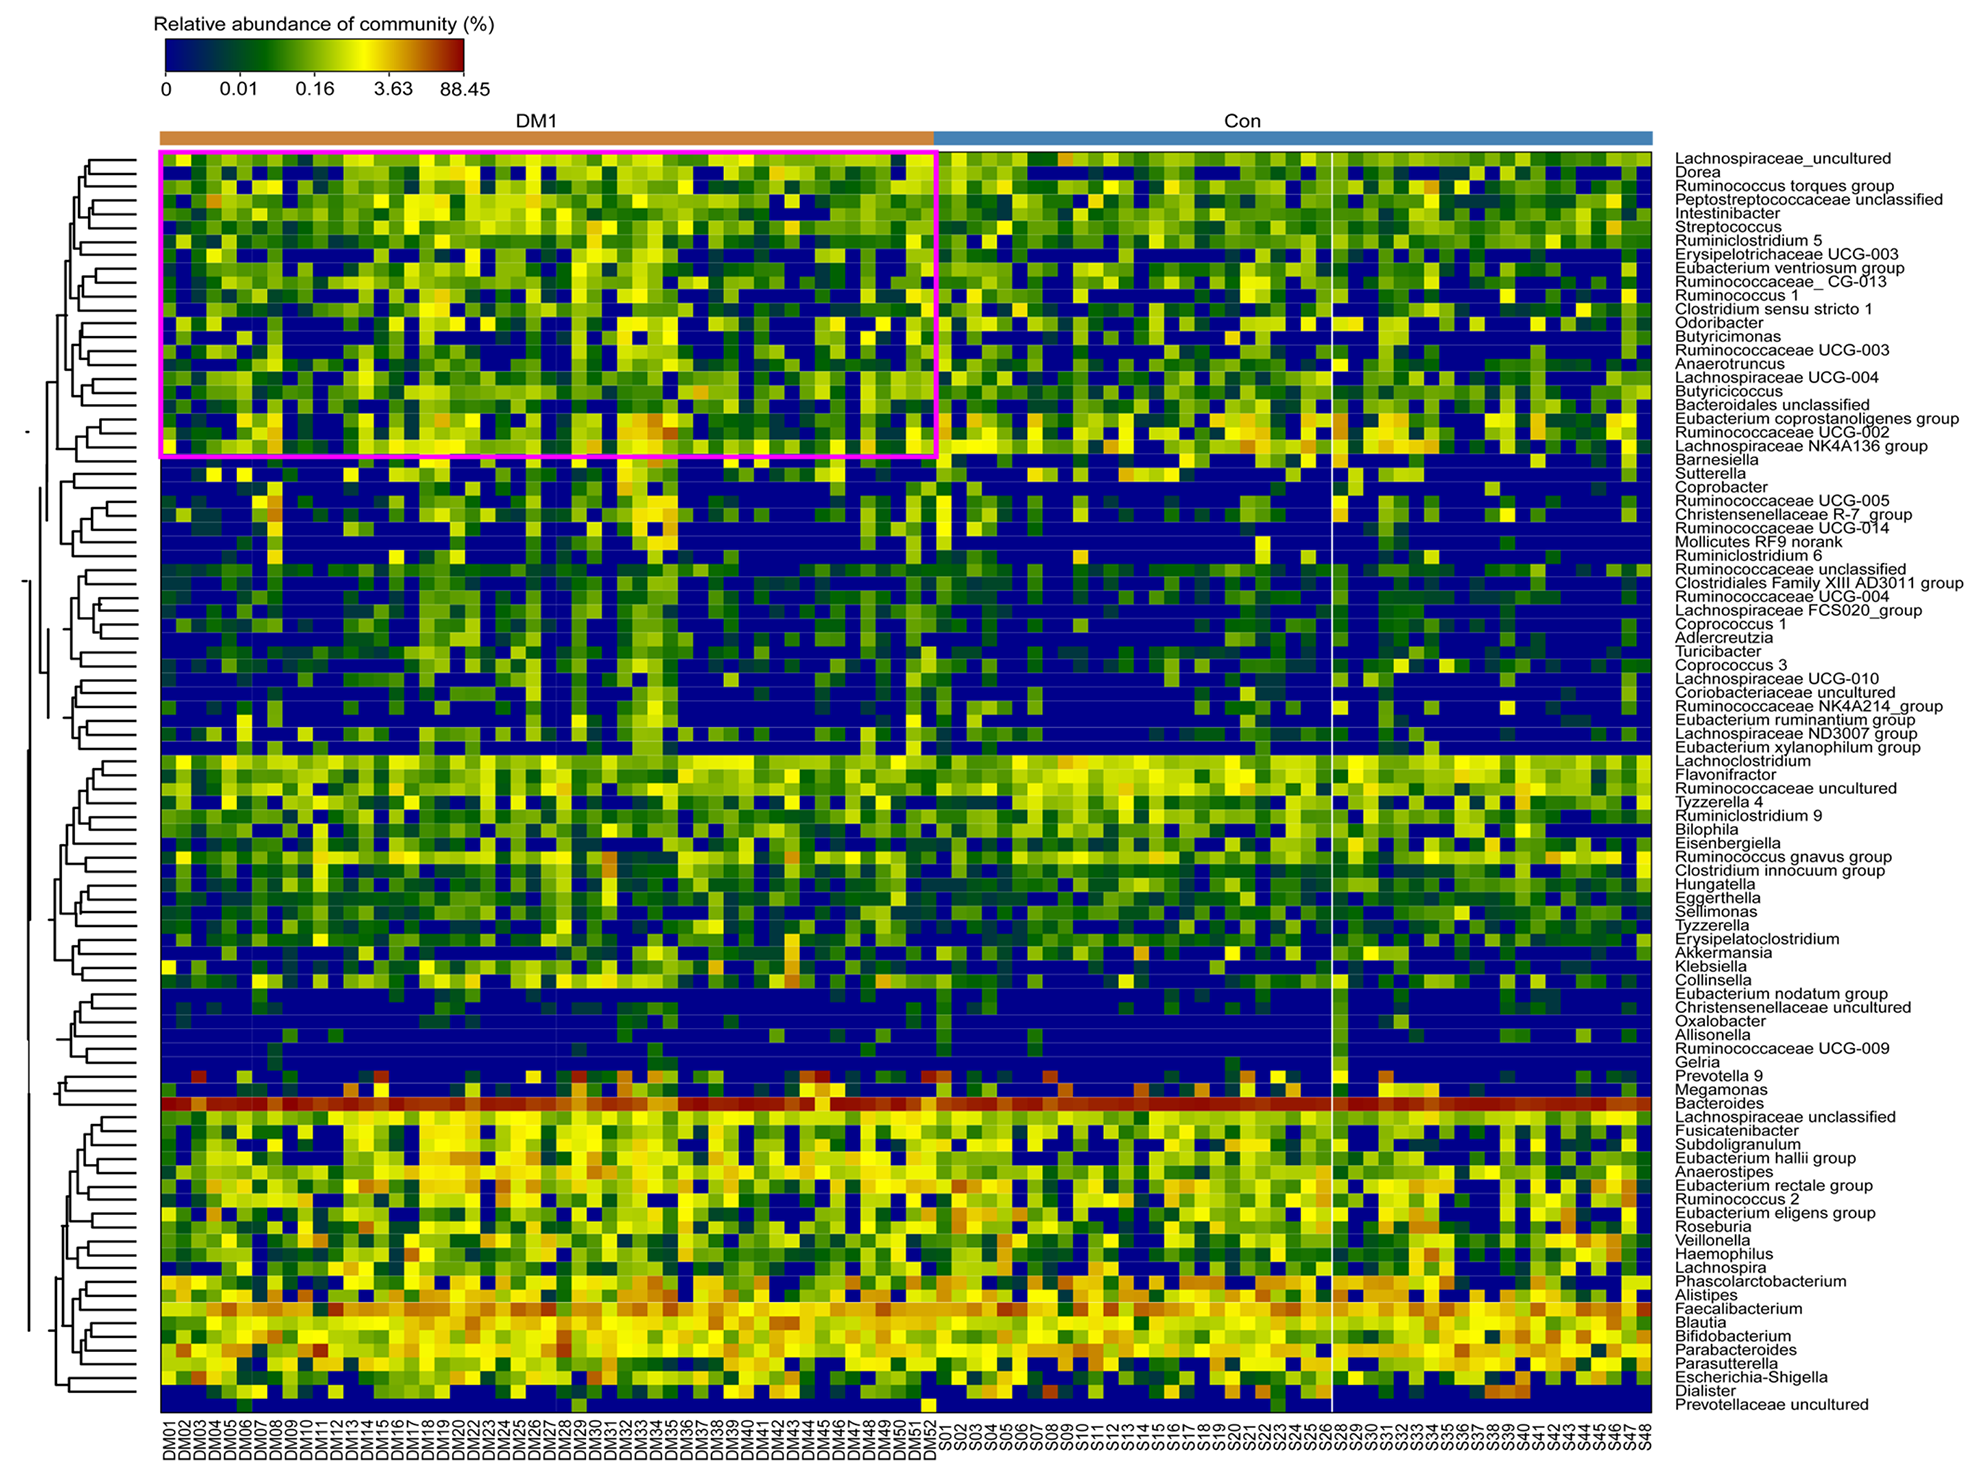
Figure 4 Heatmap of the type 1 diabetes mellitus-associated fecal microbiota at the genus level.
The color of the spots in the panel represents the relative abundance (normalized and log10-transformed) of the genus in each sample. Relative abundance of the bacteria in each genus is indicated by a gradient of color from blue (low abundance) to red (high abundance). Genera were organized according to Spearman’s correlation analysis, based on their relative abundances. Taxonomic classifications of the genus are shown on the right.
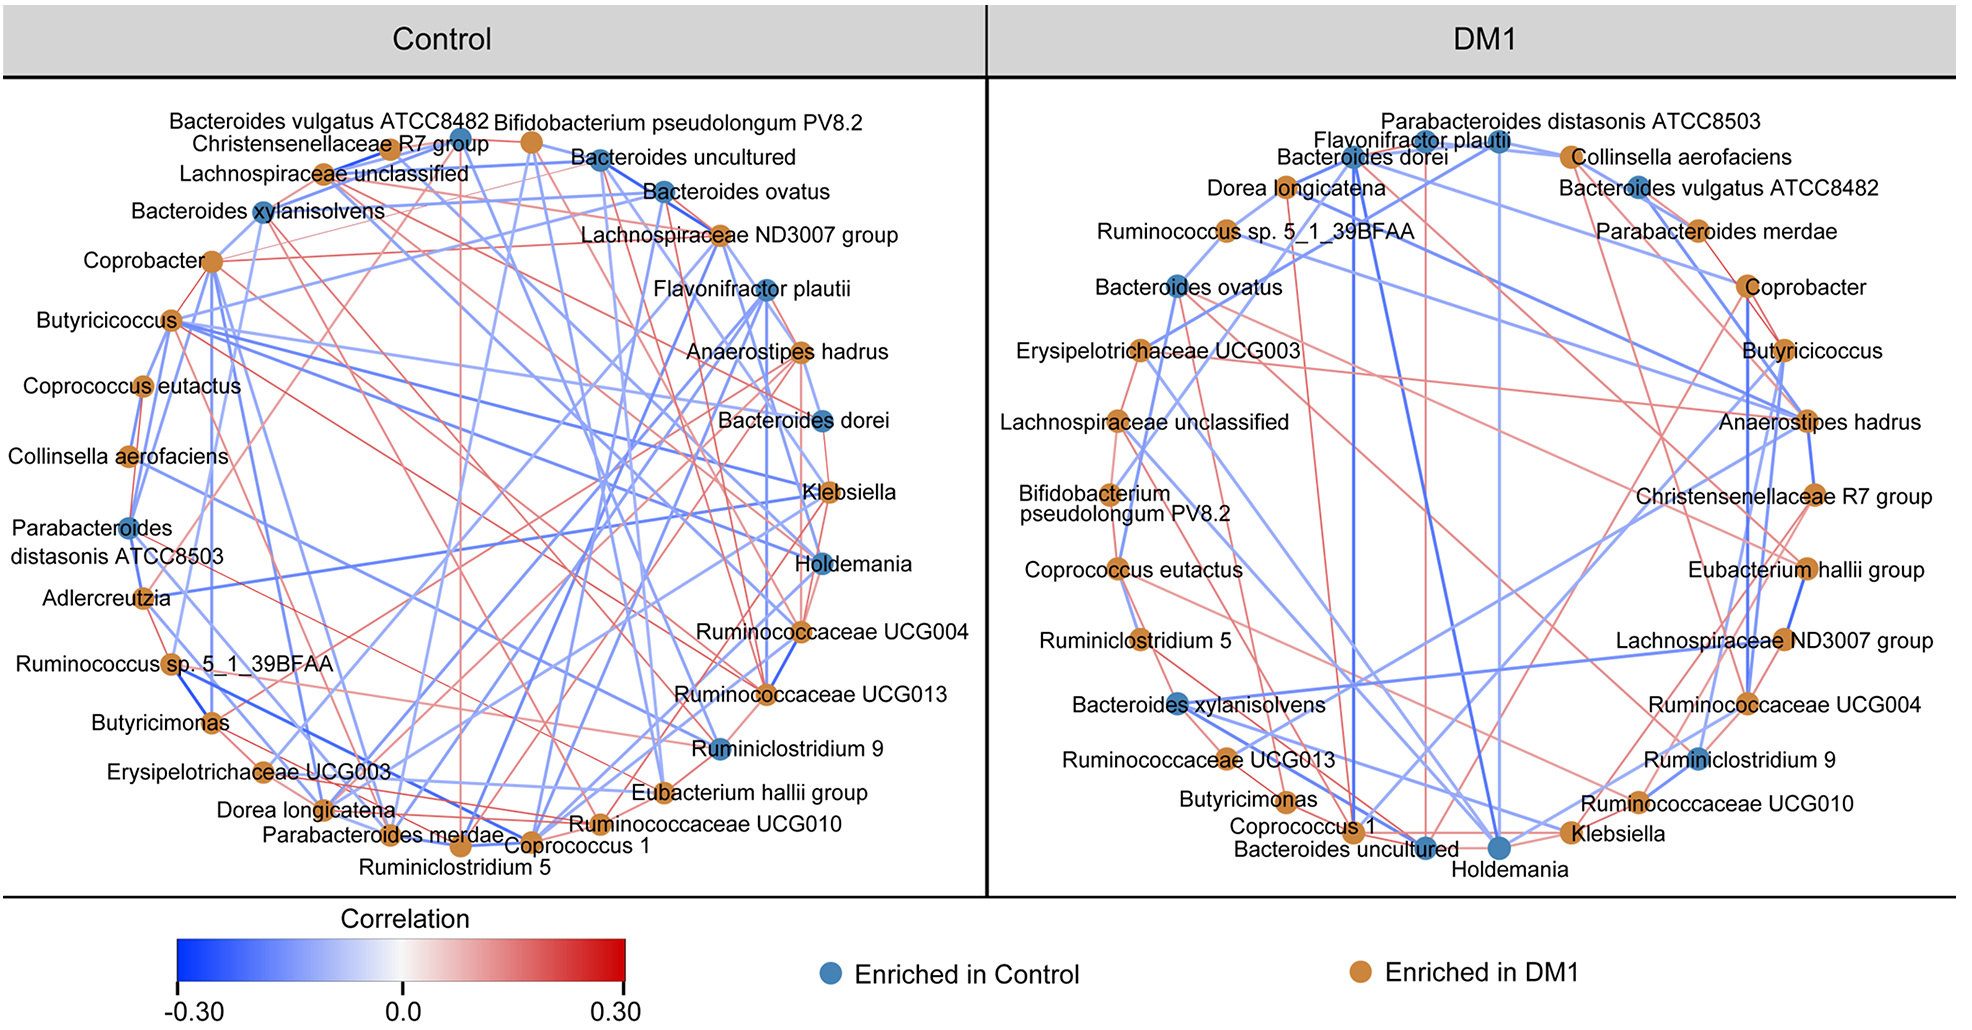
Figure 5 Correlation strengths of the abundant fecal microbiota in Chinese children with type 1 diabetes mellitus and healthy controls.
Correlation network of the abundant fecal microbiota in healthy controls and children with type 1 diabetes mellitus (T1DM) is shown. Correlation coefficients were calculated with the sparse correlation for compositional data algorithm. The Cytoscape version 3.4.0 software was used for network construction. Red and blue lines represent positive and negative correlations, respectively. The correlation network became simpler in T1DM. DM1: Type 1 diabetes mellitus.
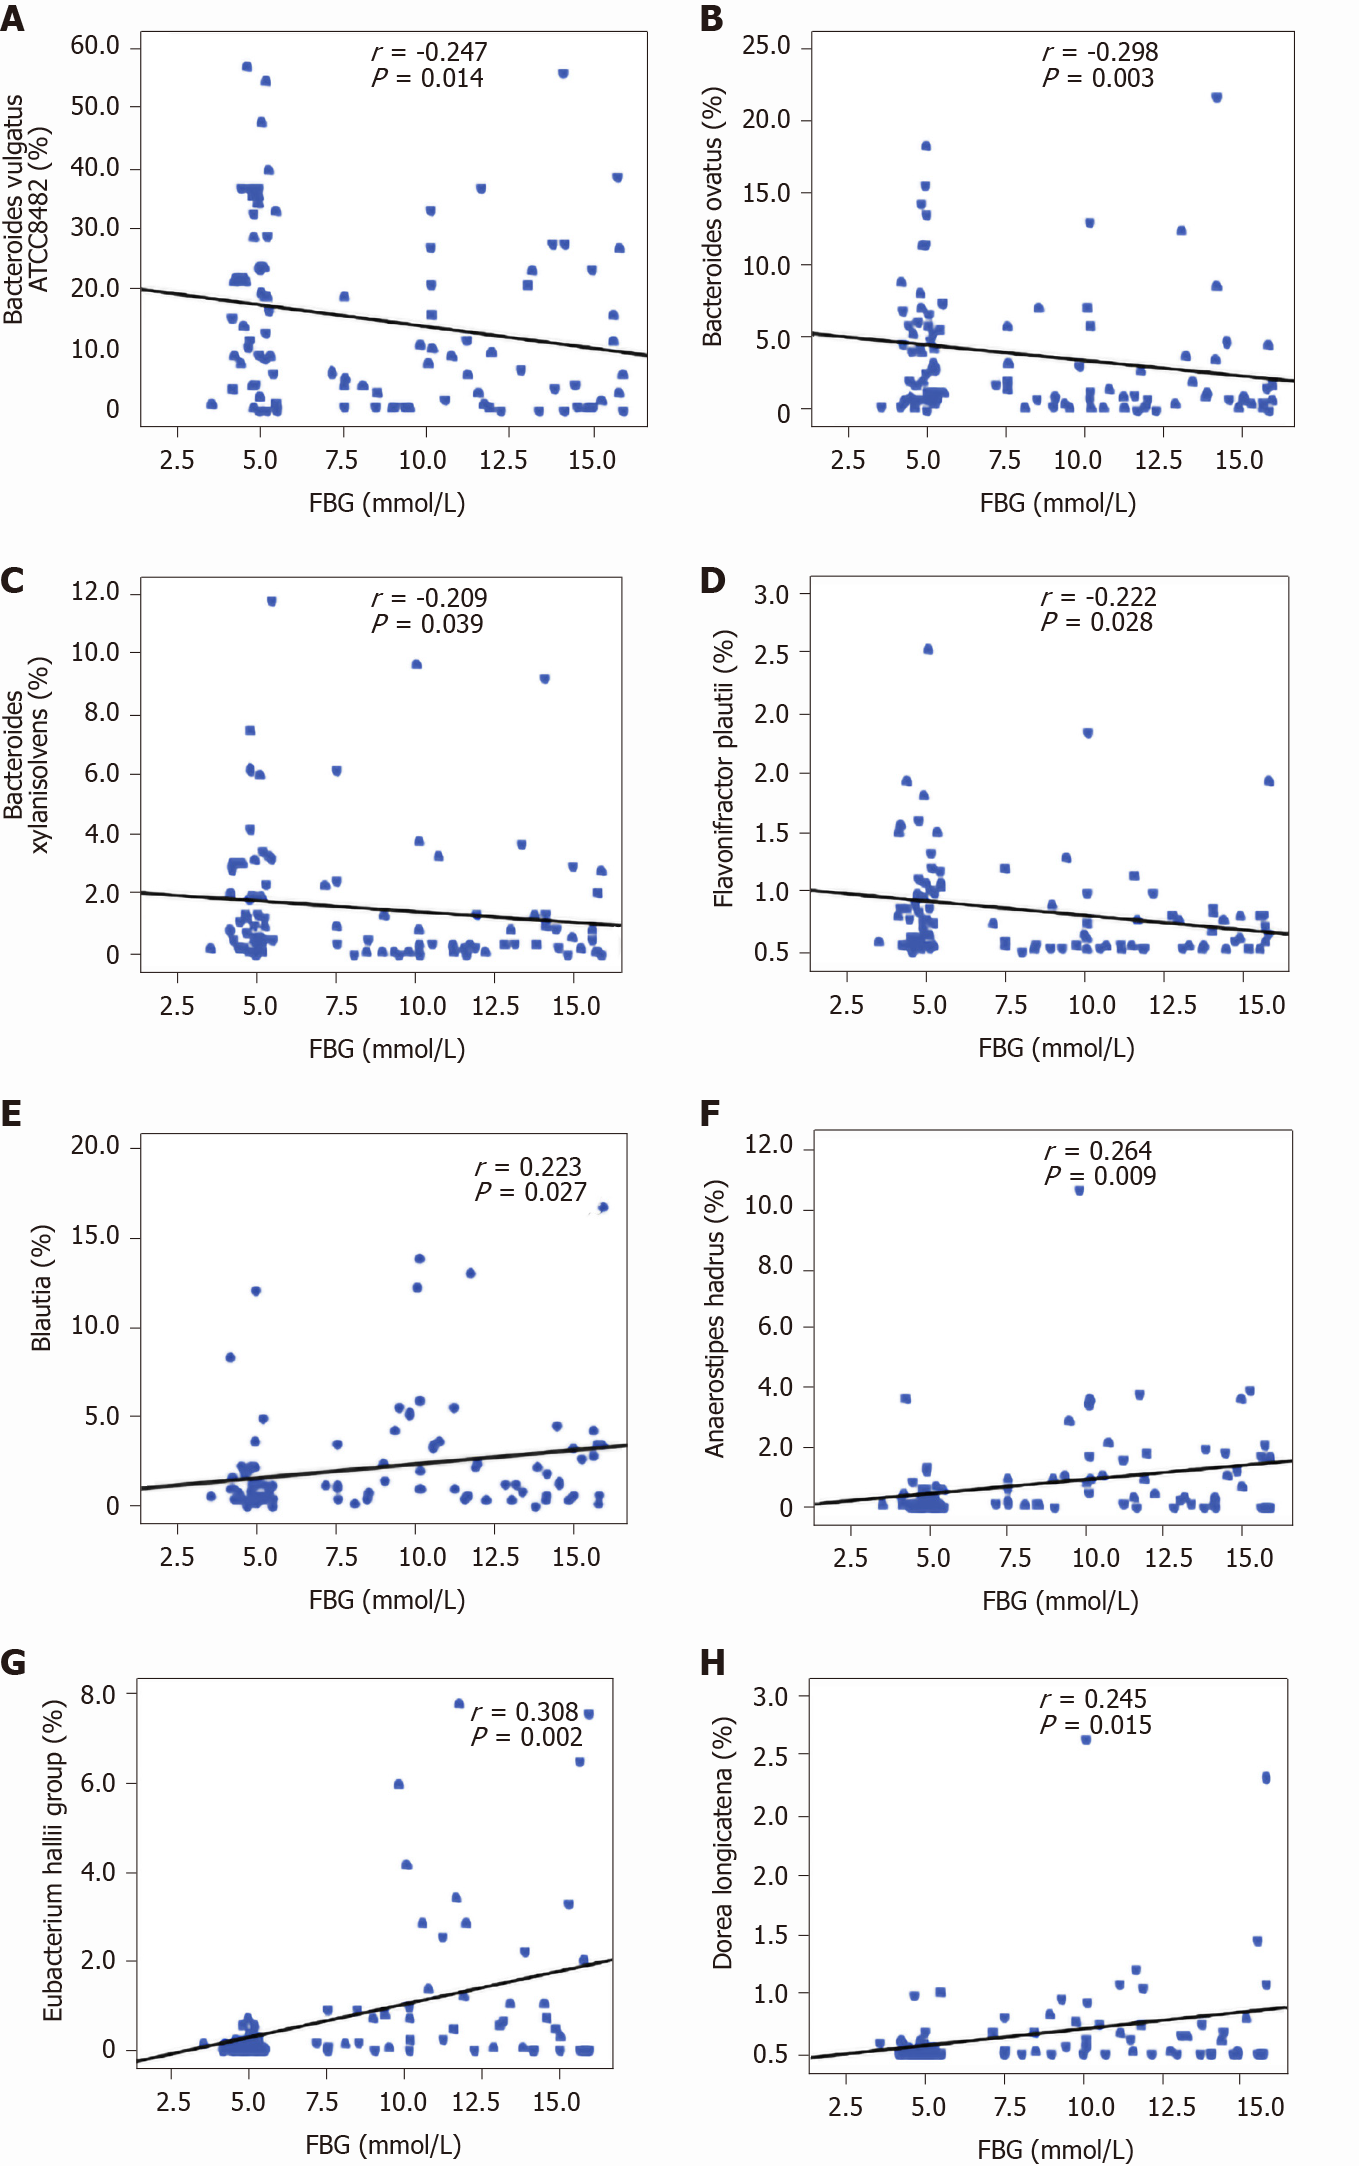
Figure 6 Correlation between key bacteria in type 1 diabetes mellitus-associated fecal microbiota and fasting blood glucose.
The different taxa, including Bacteroides vulgatus ATCC8482, Bacteroides ovatus, Bacteroides xylanisolvens, and Flavonifractor plautii, were negatively correlated with fasting blood glucose (FBG), while Blautia, the Eubacterium hallii group, Anaerostipes hadrus, and Dorea longicatena were positively correlated with FBG. Spearman’s rank correlation and probability were used to evaluate statistical significance. A: Bacteroides vulgatus ATCC8482; B: Bacteroides ovatus; C: Bacteroides xylanisolvens; D: Flavonifractor plautii; E: Blautia; F: Anaerostipes hadrus; G: Eubacterium hallii; H: Dorea longicatena. FBG: Fasting blood glucose.
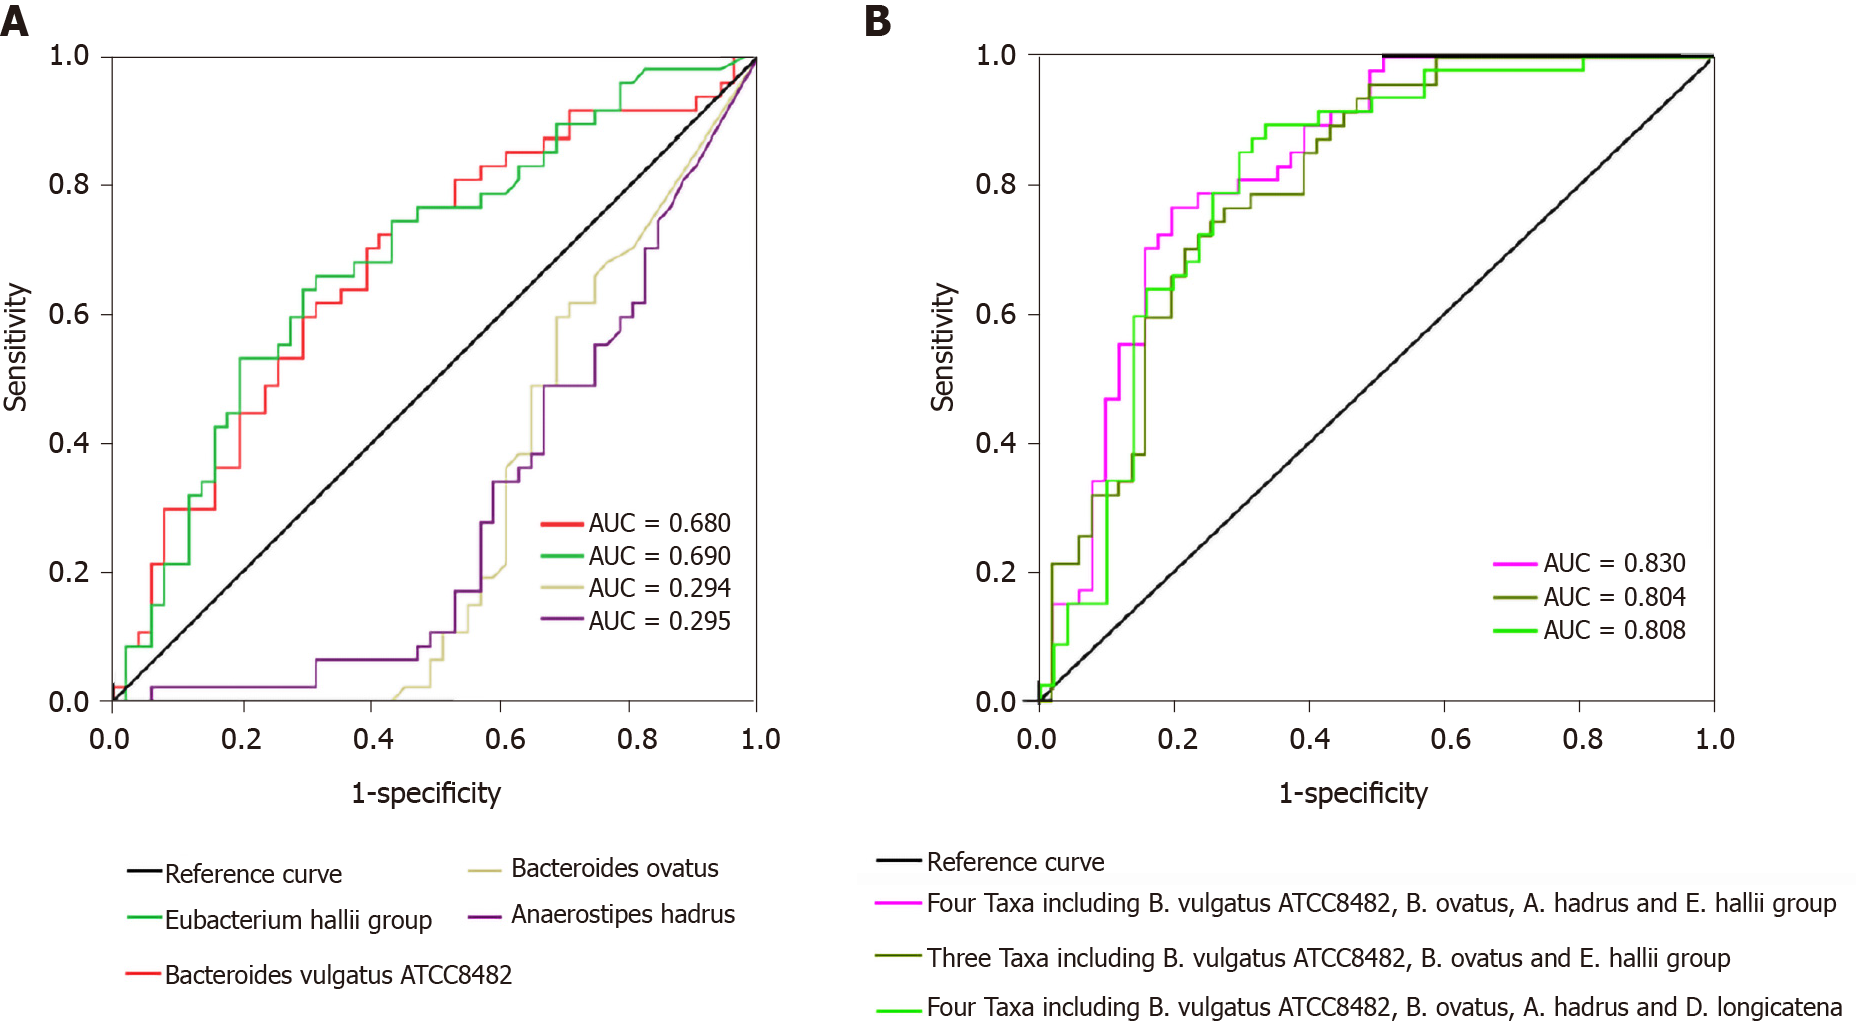
Figure 7 Receiver operating characteristic curves for different taxa, including Bacteroidesvulgatus ATCC8482, Bacteroidesovatus, Anaerostipeshadrus, and the Eubacteriumhallii group, which were used either alone or in combination to discriminate between patients with type 1 diabetes mellitus and healthy controls.
A: Alone; B: Combination. AUC: Area under the curve.
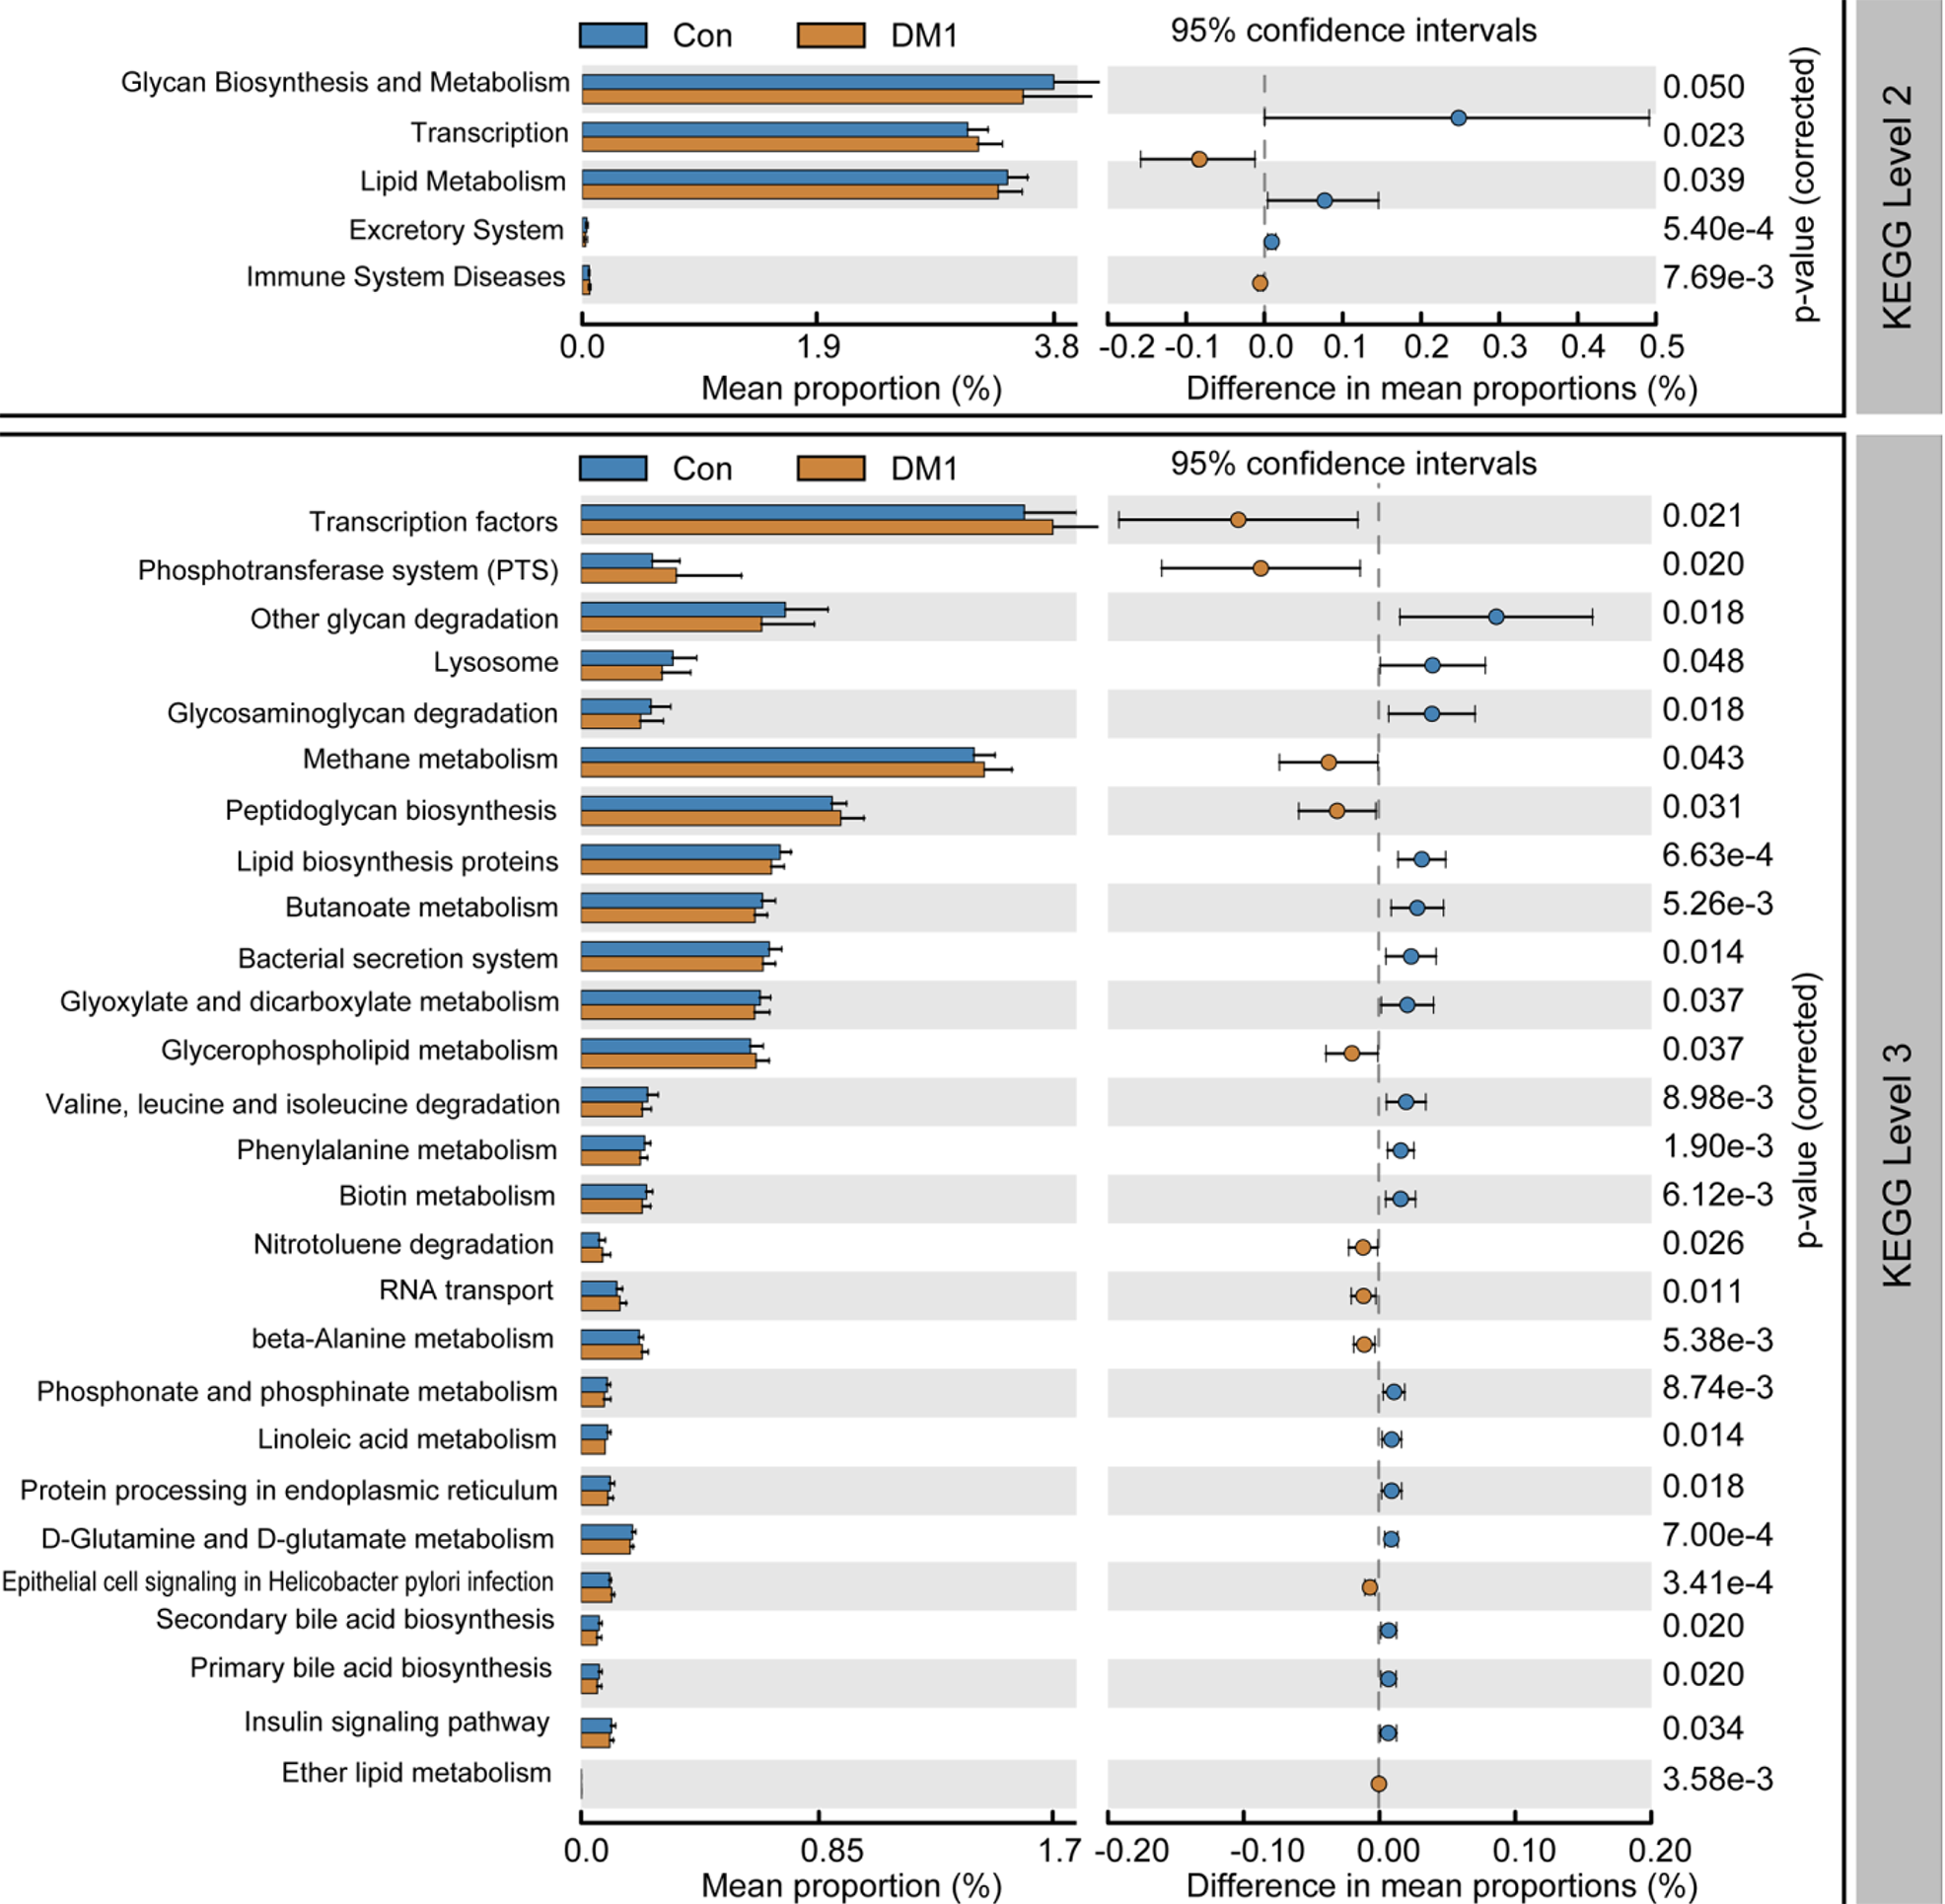
Figure 8 PiCRUSt-based fecal microbiome study among Chinese children with type 1 diabetes mellitus and healthy controls.
Different bacterial functions were evaluated based on the two-sided Welch’s t-test. Comparisons between the two groups for each Kyoto Encyclopedia of Genes and Genome functional category (level 2 and level 3) are shown by percentage. The Benjamini–Hochberg method was used for multiple testing correction, based on the false discovery rate using the Statistical Analysis of Metagenomic Profiles software. KEGG: Kyoto Encyclopedia of Genes and Genome; Con: Control; DM1: Type 1 diabetes mellitus.
- Citation: Liu X, Cheng YW, Shao L, Sun SH, Wu J, Song QH, Zou HS, Ling ZX. Gut microbiota dysbiosis in Chinese children with type 1 diabetes mellitus: An observational study . World J Gastroenterol 2021; 27(19): 2394-2414
- URL: https://www.wjgnet.com/1007-9327/full/v27/i19/2394.htm
- DOI: https://dx.doi.org/10.3748/wjg.v27.i19.2394


