Copyright
©The Author(s) 2021.
World J Gastroenterol. May 21, 2021; 27(19): 2376-2393
Published online May 21, 2021. doi: 10.3748/wjg.v27.i19.2376
Published online May 21, 2021. doi: 10.3748/wjg.v27.i19.2376
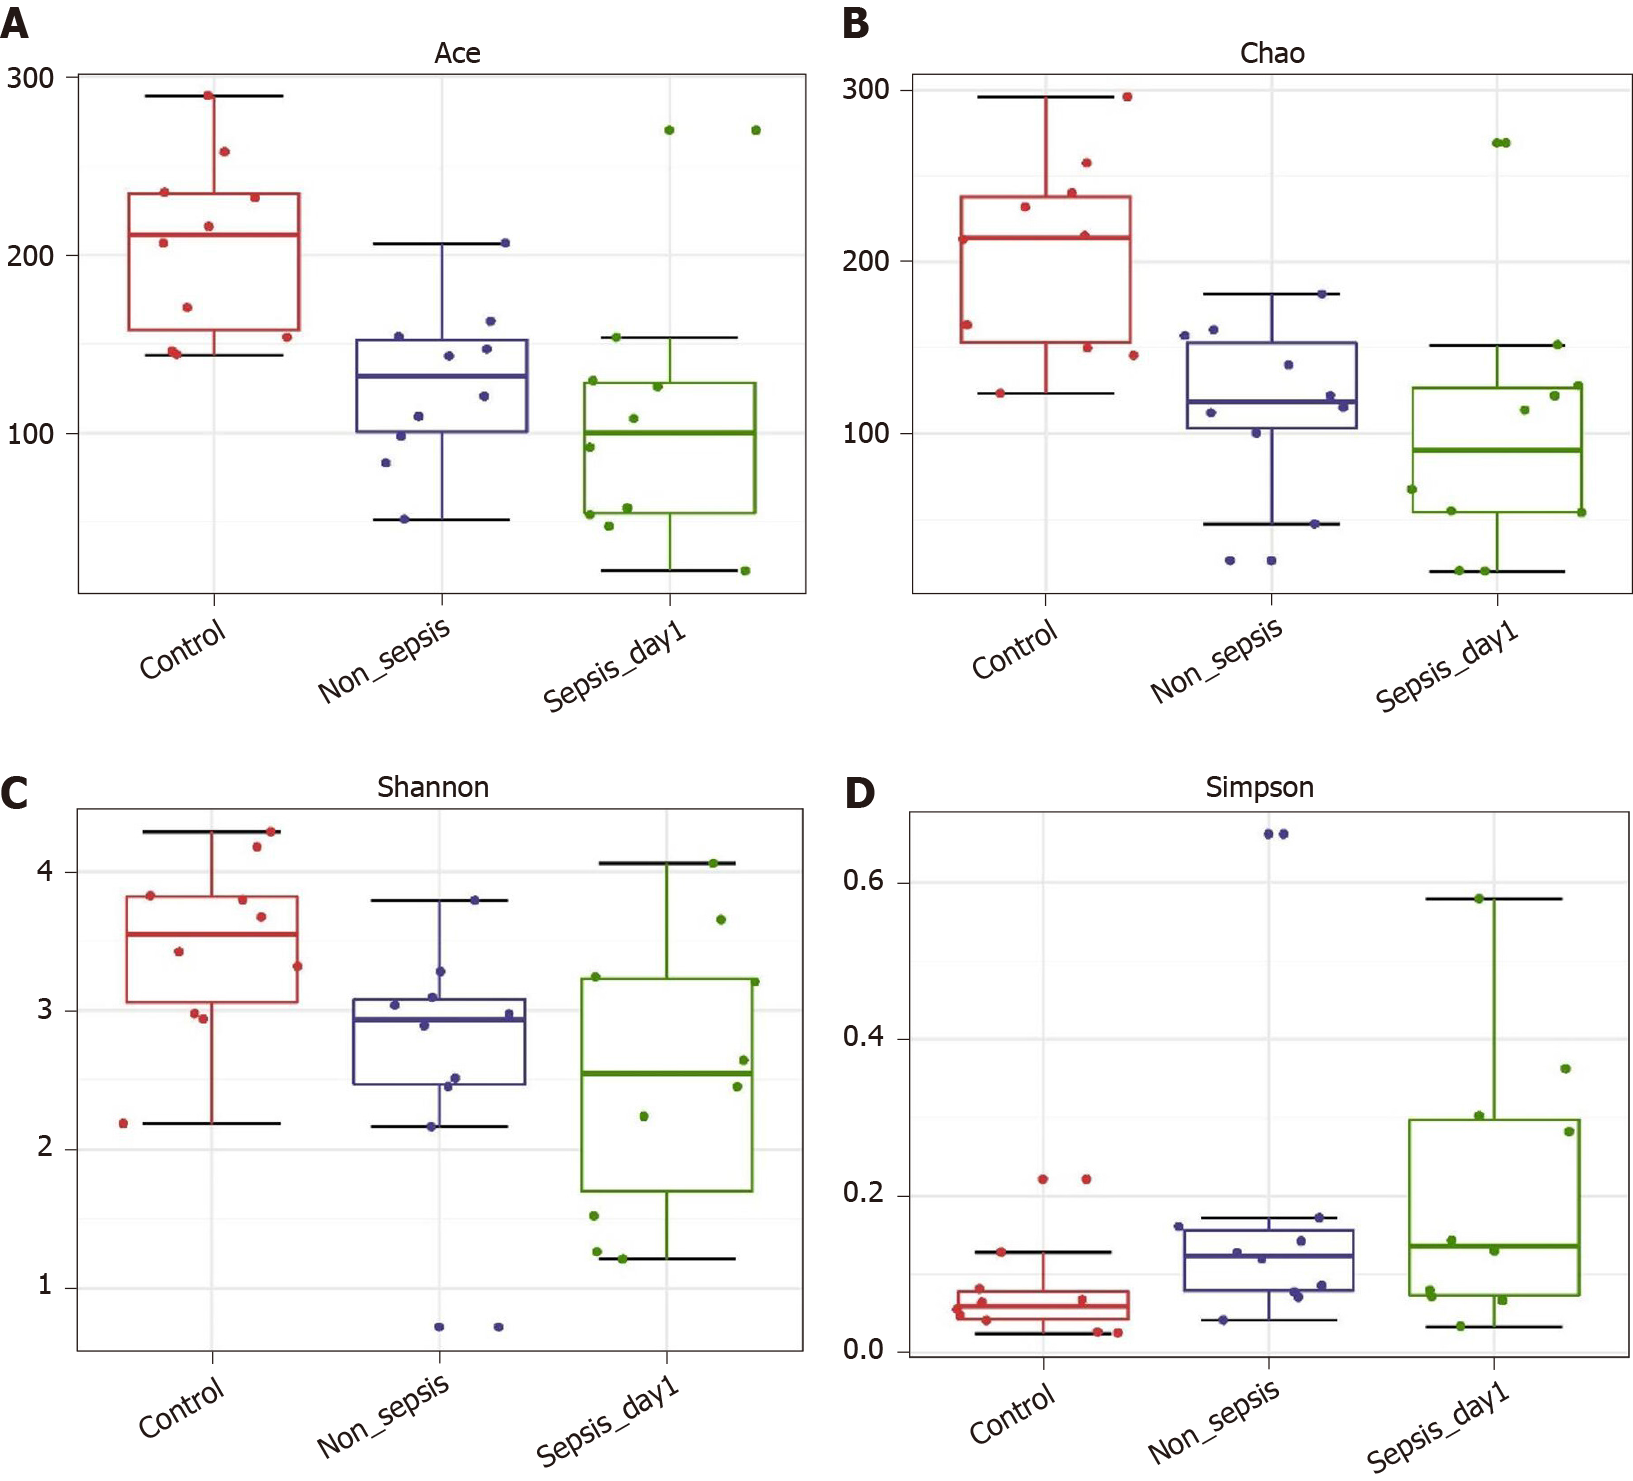
Figure 1 α-diversity indexes of fecal microbiota in normal individuals, non-sepsis patients, and sepsis patients.
A: ACE estimator; B: Chao 1 estimator; C: Shannon index; D: Simpson index.
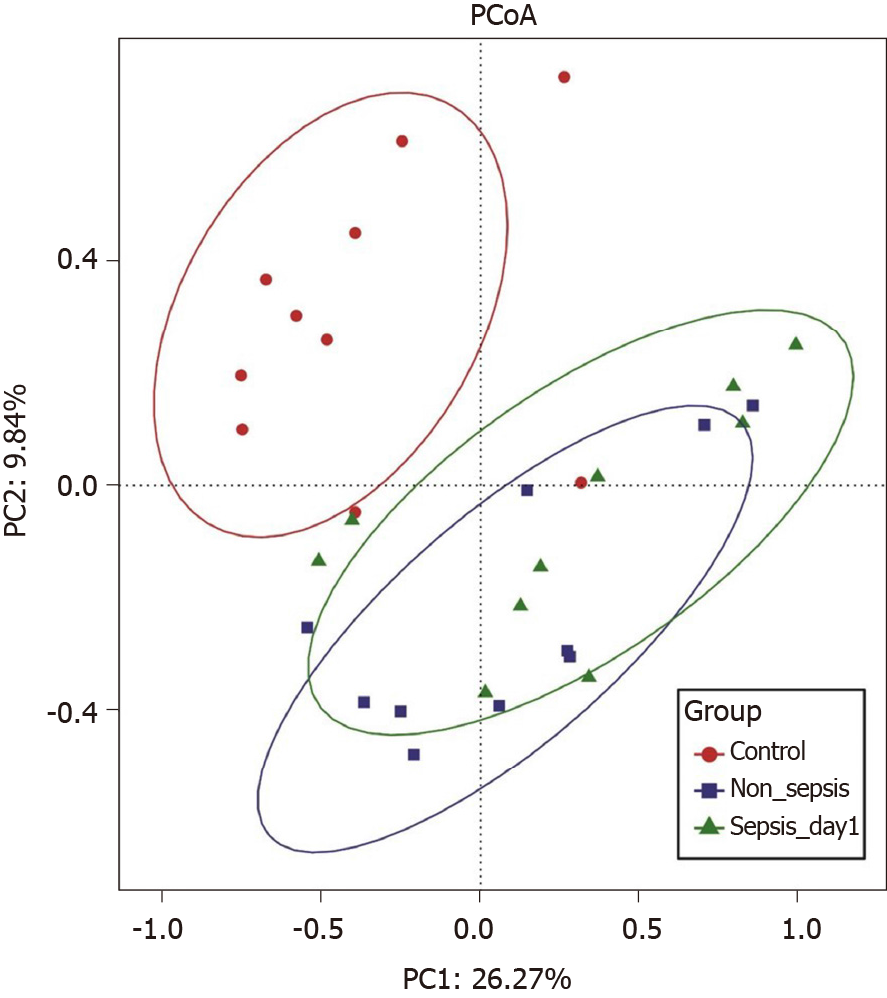
Figure 2 Principal coordinate analysis of intestinal flora among normal individuals, sepsis patients, and non-sepsis patients.
Principal coordinate analysis was plotted based on the Bray–Curtis dissimilarity between samples. The ellipses highlight the clustering of the fecal microbiomes according to groups (red: Healthy control group; blue: Non-sepsis group; green: Day 1 of sepsis).
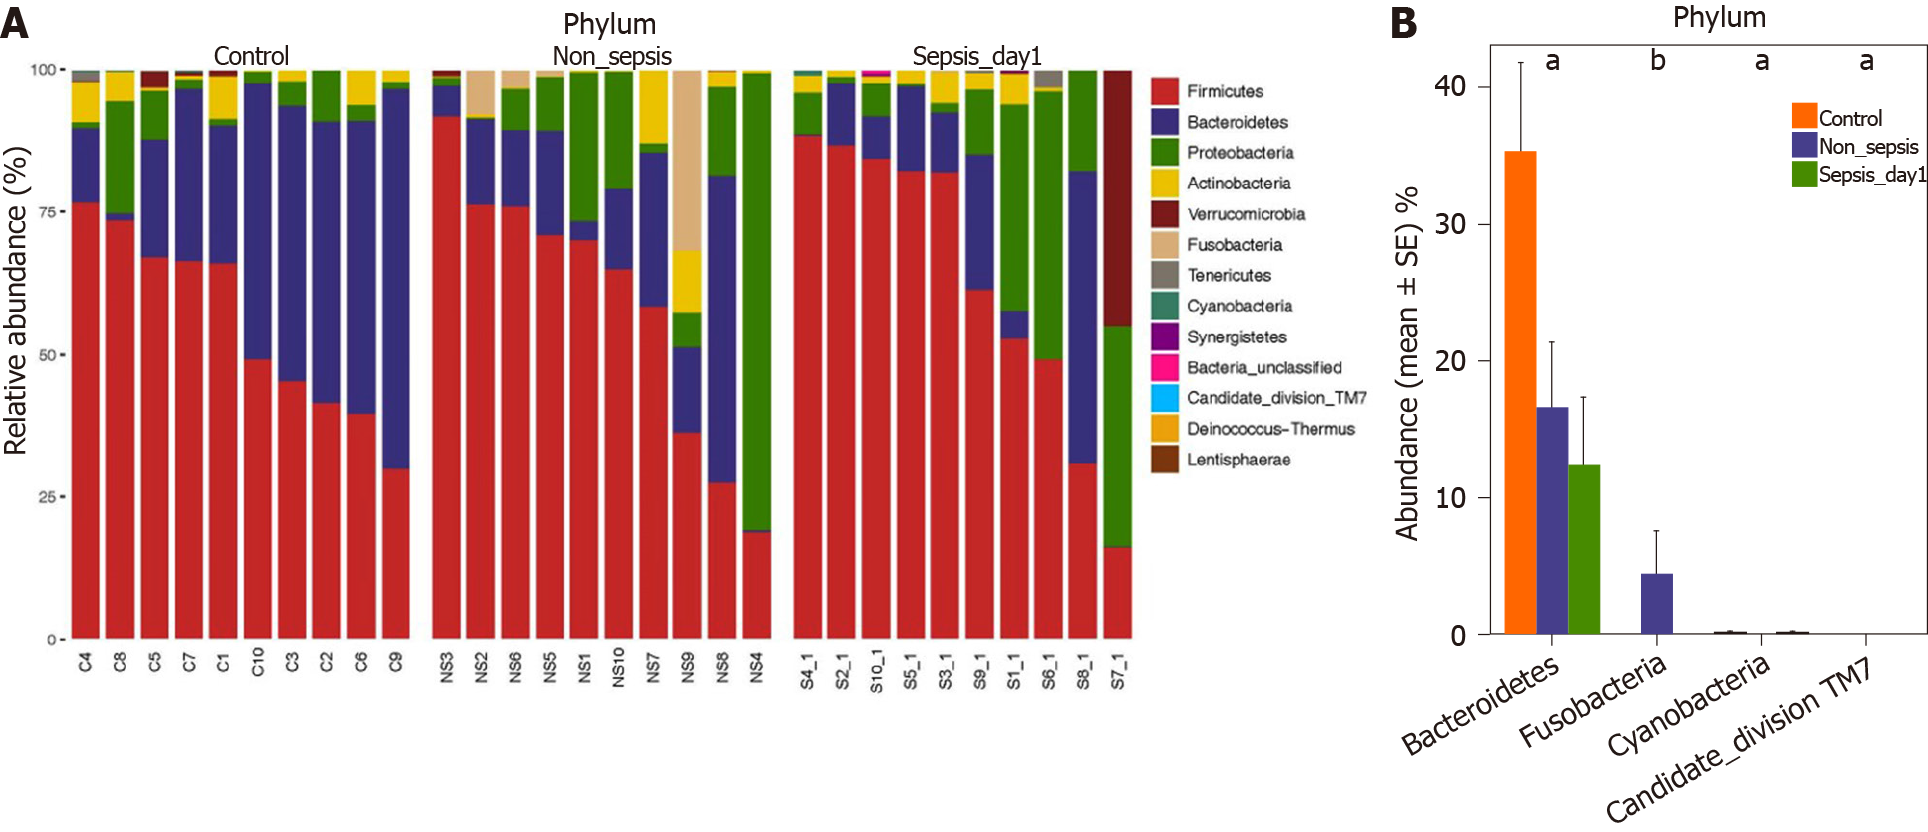
Figure 3 Composition and comparison of the fecal microbiota among normal individuals, sepsis patients, and non-sepsis patients at the phylum level.
A: Composition of the fecal microbiota at the phylum level among three groups; B: Comparison of the fecal microbiota at the phylum level among three groups. The average abundance of each phylum is depicted as the mean ± SE. P values were calculated using the Kruskal–Wallis rank-sum test: aP < 0.05, bP < 0.01.
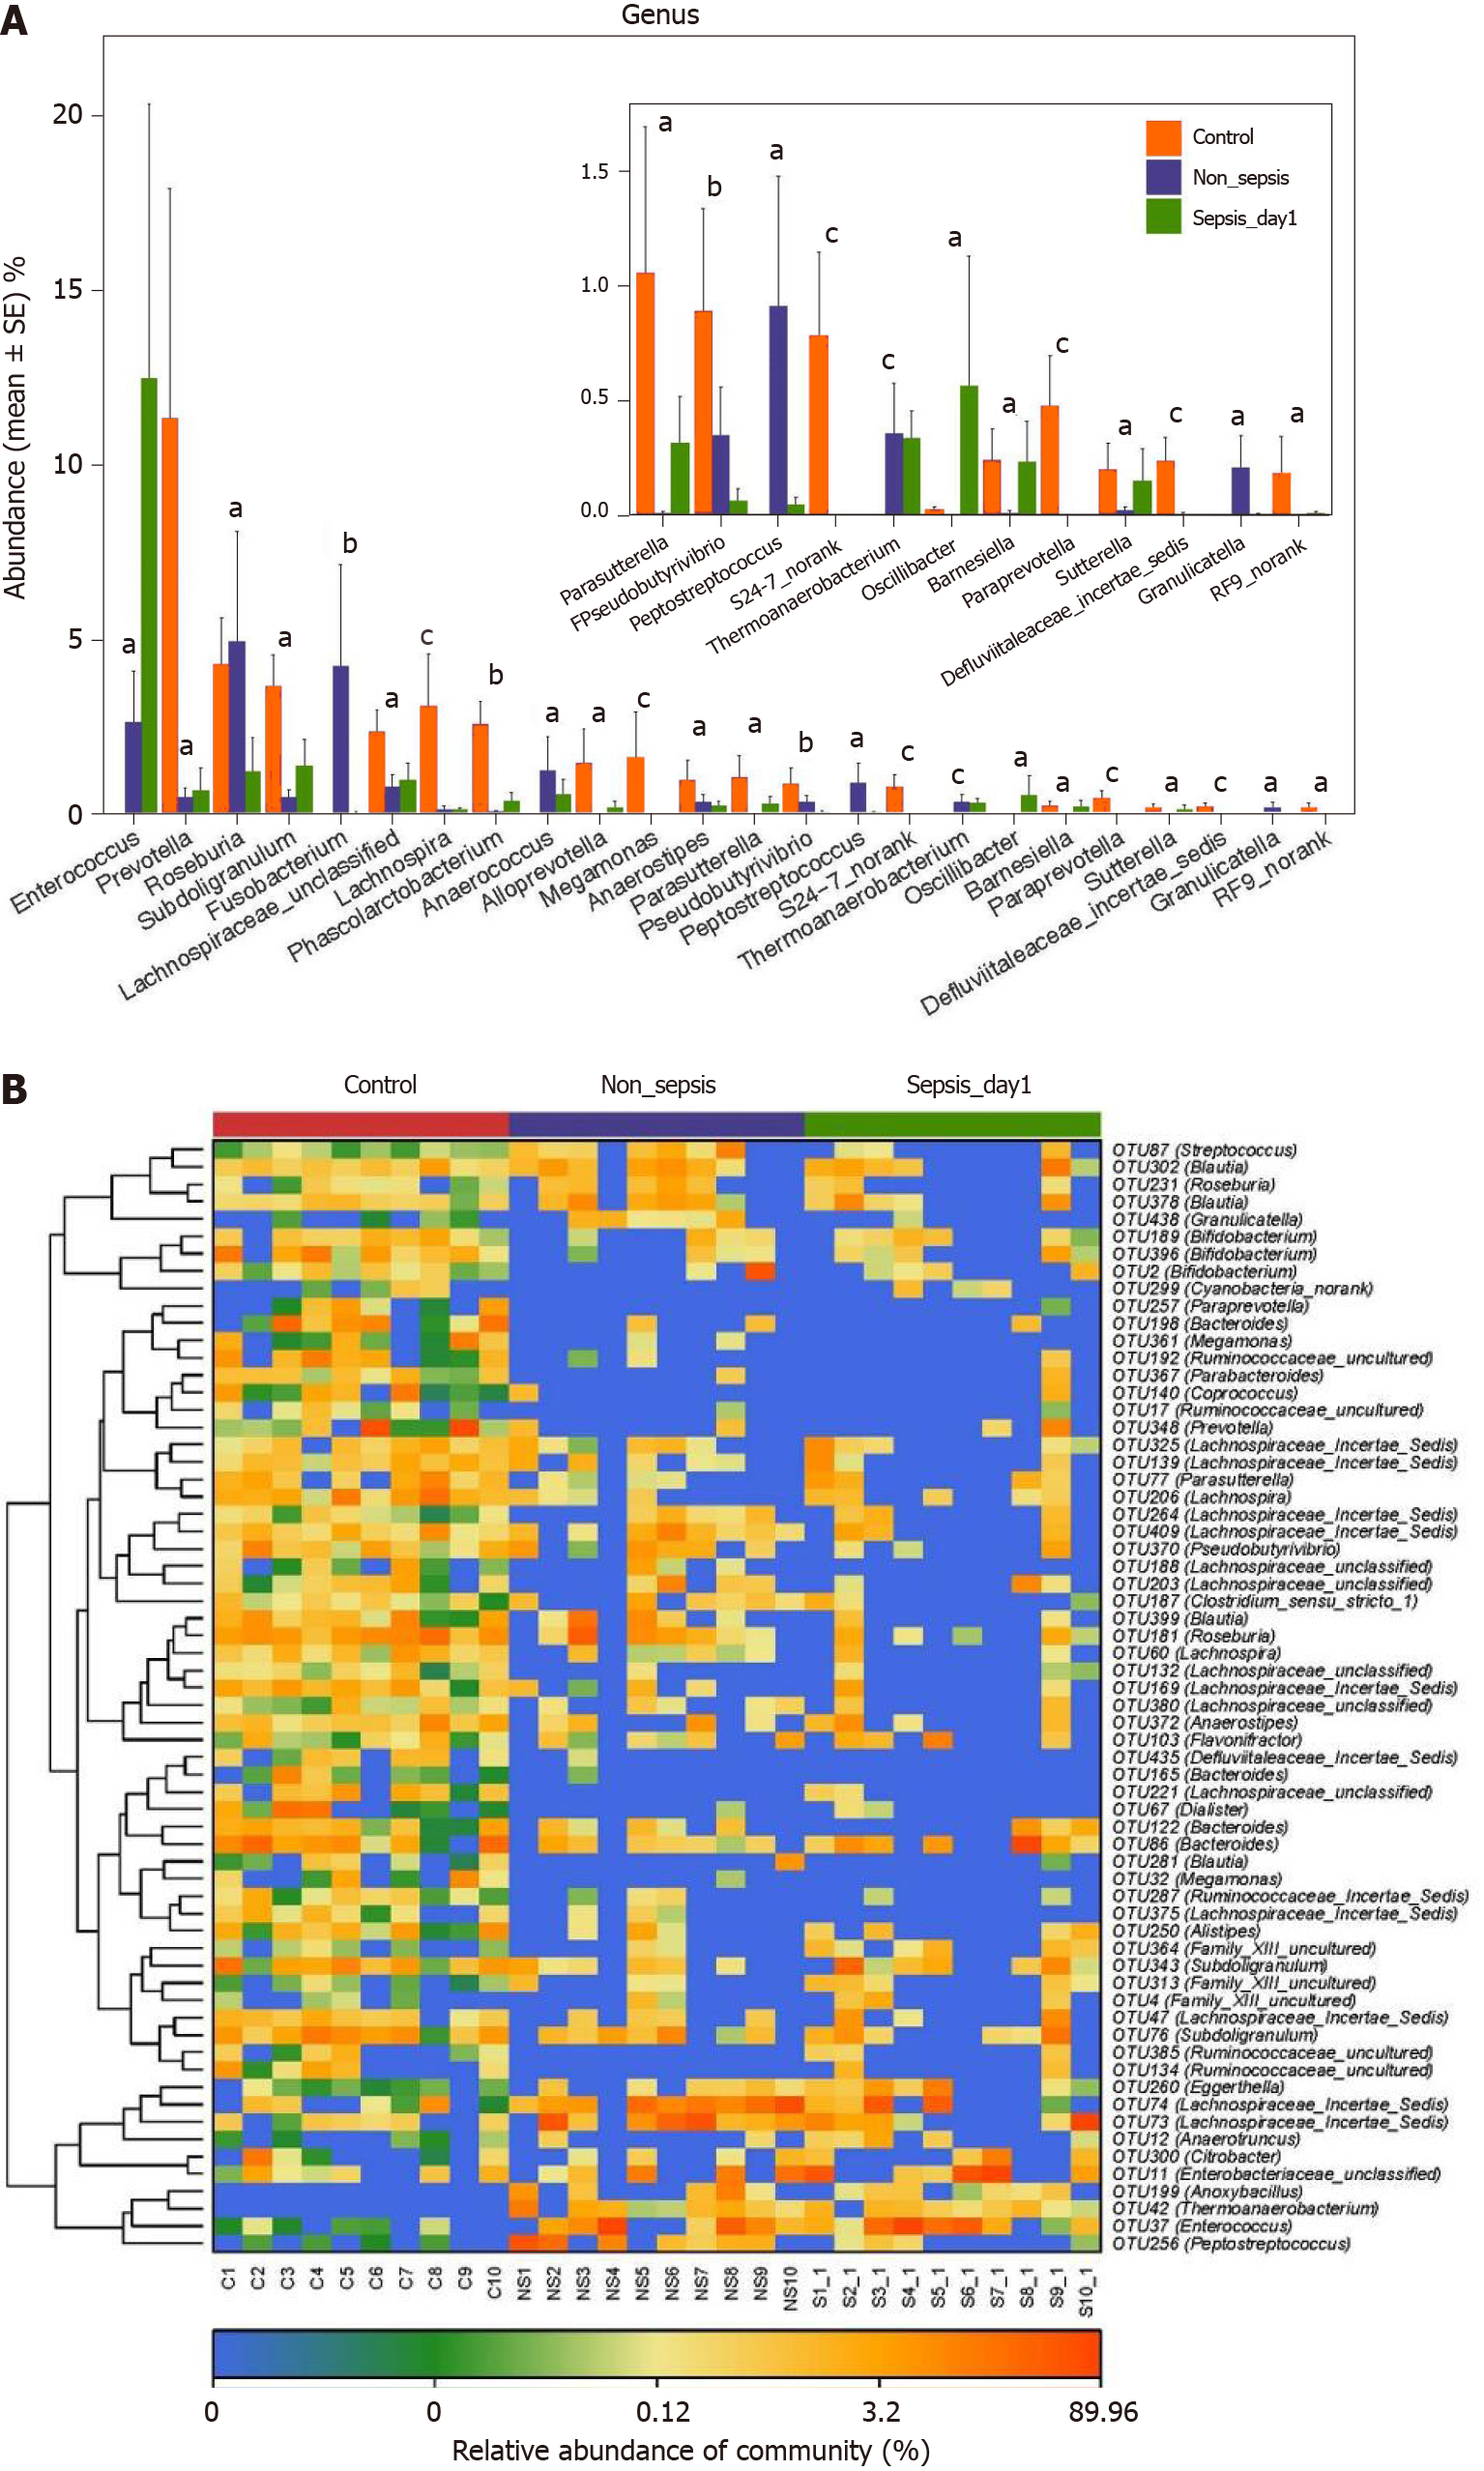
Figure 4 Key phylotypes showing significant differences among normal individuals, sepsis patients, and non-sepsis patients.
A: Comparison of the fecal microbiota at the genus level among the three groups. The average abundance of each genus is depicted as the mean ± SE. P values were calculated using the Kruskal–Wallis rank-sum test: aP < 0.05; bP < 0.01, cP < 0.001; B: Heatmap representing the relative abundance of differential operational taxonomic units (OTUs) among the three groups. The key OTUs whose relative abundance was above 1%, as per random forest-based models are displayed in the “figure”.
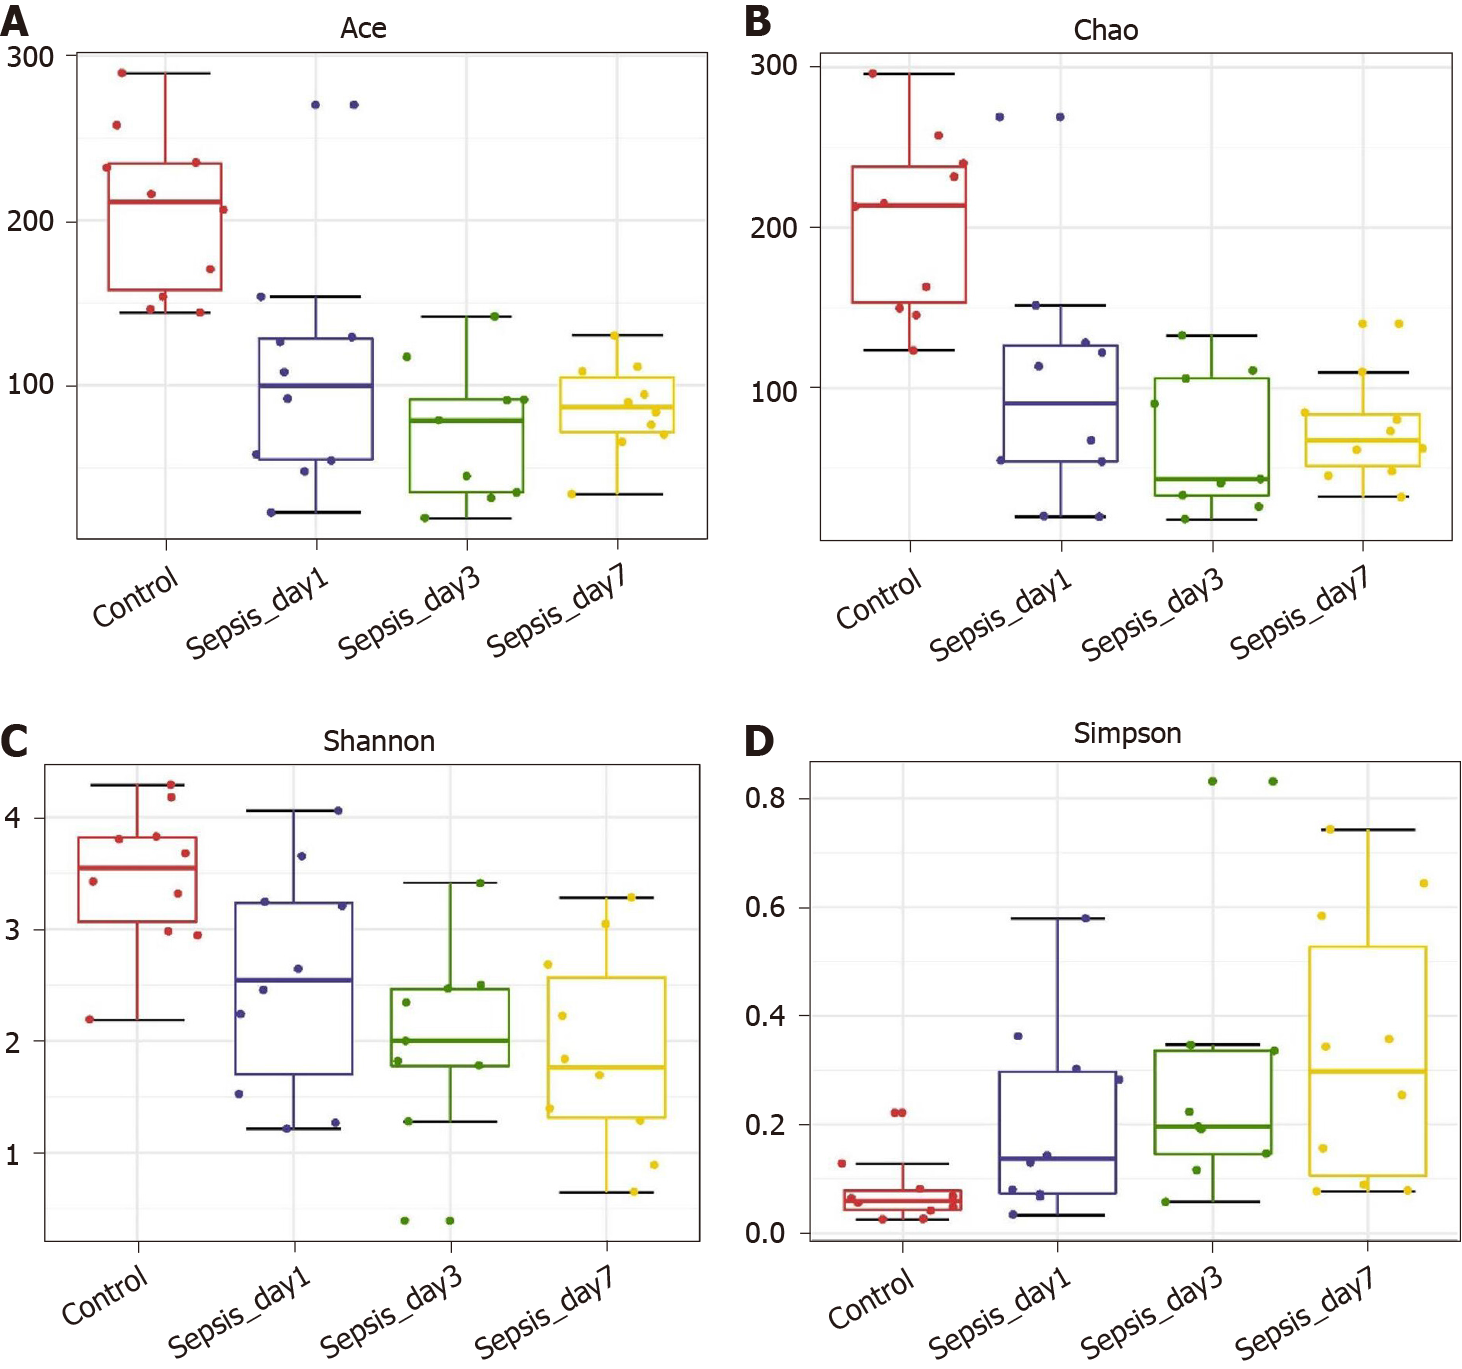
Figure 5 α-diversity indexes of the fecal microbiota in sepsis patients on days 1, 3, and 7 after admission to the intensive care unit vs healthy individuals.
A: ACE estimator; B: Chao 1 estimator; C: Shannon index; D: Simpson index.
Figure 6 Principal coordinate analysis of the intestinal flora in sepsis patients on days 1, 3, and 7 after admission to the intensive care unit versus healthy individuals.
Principal coordinate analysis was plotted based on the Bray–Curtis dissimilarity between samples. The ellipses highlight the clustering of the fecal microbiomes according to the groups (red: Healthy control group; blue: Sepsis patients on day 1; green: Sepsis patients on day 3; yellow: Sepsis patients on day 7).
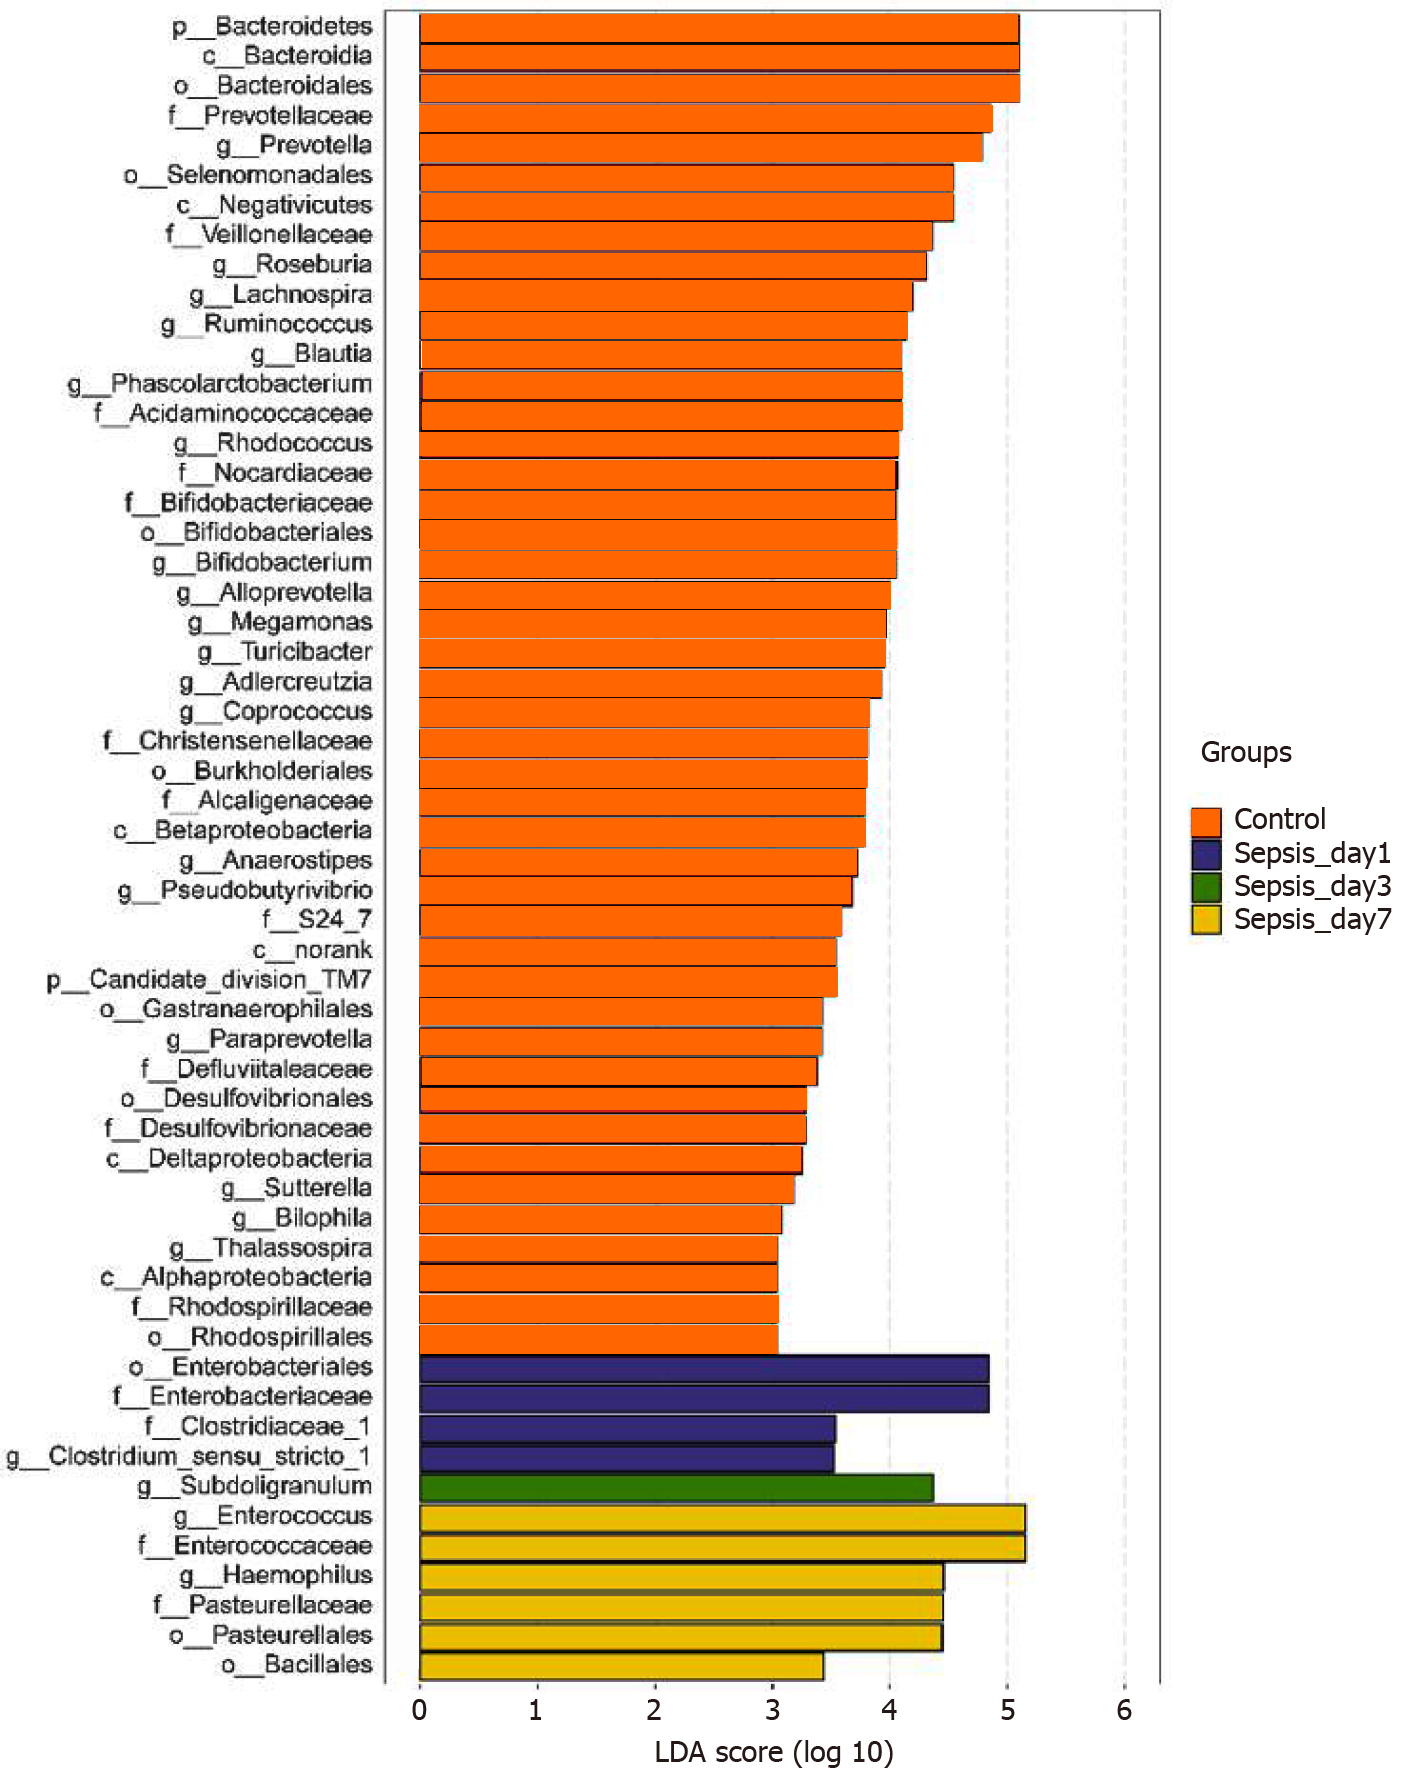
Figure 7 Linear discriminant analysis scores indicating significant differences in the fecal microbiota between the sepsis patients within 1 wk after admission to the intensive care unit and the normal control group.
Red: Enriched taxa in the healthy control group; blue: Enriched taxa in sepsis patients on day 1; green: Enriched taxa in sepsis patients on day 3; yellow: Enriched taxa in sepsis patients on day 7.
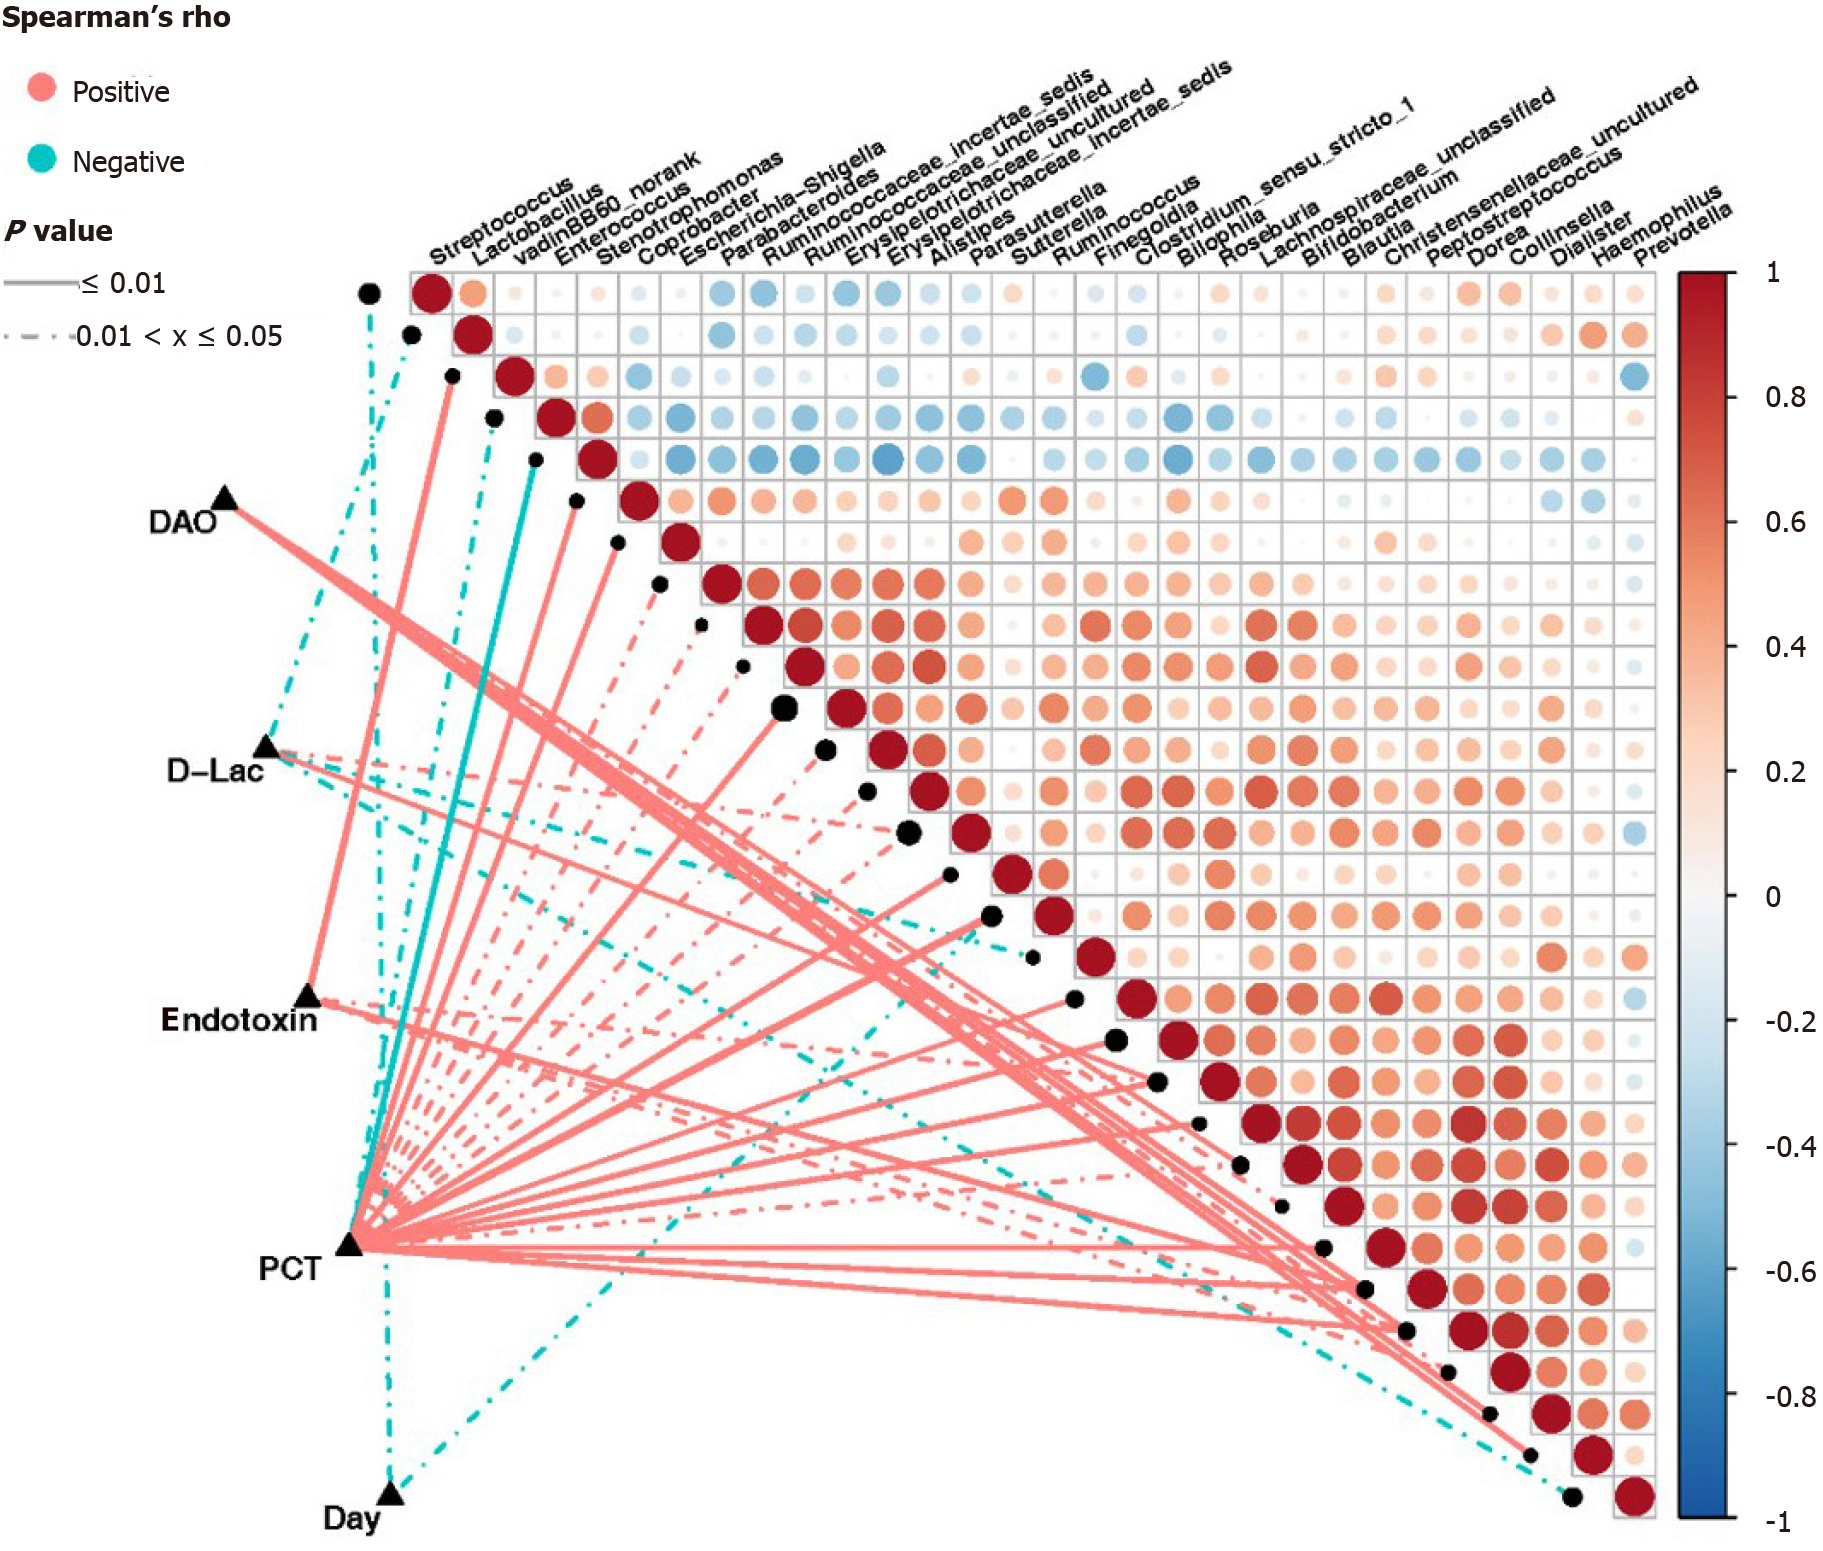
Figure 8 Correlation between clinical indicators and abundance of fecal microbiota in sepsis patients.
Heatmap showing partial Spearman’s correlation coefficients among 30 genera and clinical indexes. Connecting lines represent the correlation coefficient values above 0.4 (red, positive correlation) or below -0.4 (blue, negative correlation). Solid lines represent P ≤ 0.01. Dotted lines represent 0.01 < P ≤ 0.05. The intensity of shading in the circles is proportional to the magnitude of the association. In the figure, “day” indicates the collection time of stool samples from sepsis patients after admission to the intensive care unit (ICU) (days 1, 3, and 7 after admission to the ICU). D-Lac: d-lactic acid; PCT: Procalcitonin; DAO: Diamine oxidase.
- Citation: Yang XJ, Liu D, Ren HY, Zhang XY, Zhang J, Yang XJ. Effects of sepsis and its treatment measures on intestinal flora structure in critical care patients. World J Gastroenterol 2021; 27(19): 2376-2393
- URL: https://www.wjgnet.com/1007-9327/full/v27/i19/2376.htm
- DOI: https://dx.doi.org/10.3748/wjg.v27.i19.2376


