Copyright
©The Author(s) 2021.
World J Gastroenterol. May 14, 2021; 27(18): 2219-2237
Published online May 14, 2021. doi: 10.3748/wjg.v27.i18.2219
Published online May 14, 2021. doi: 10.3748/wjg.v27.i18.2219
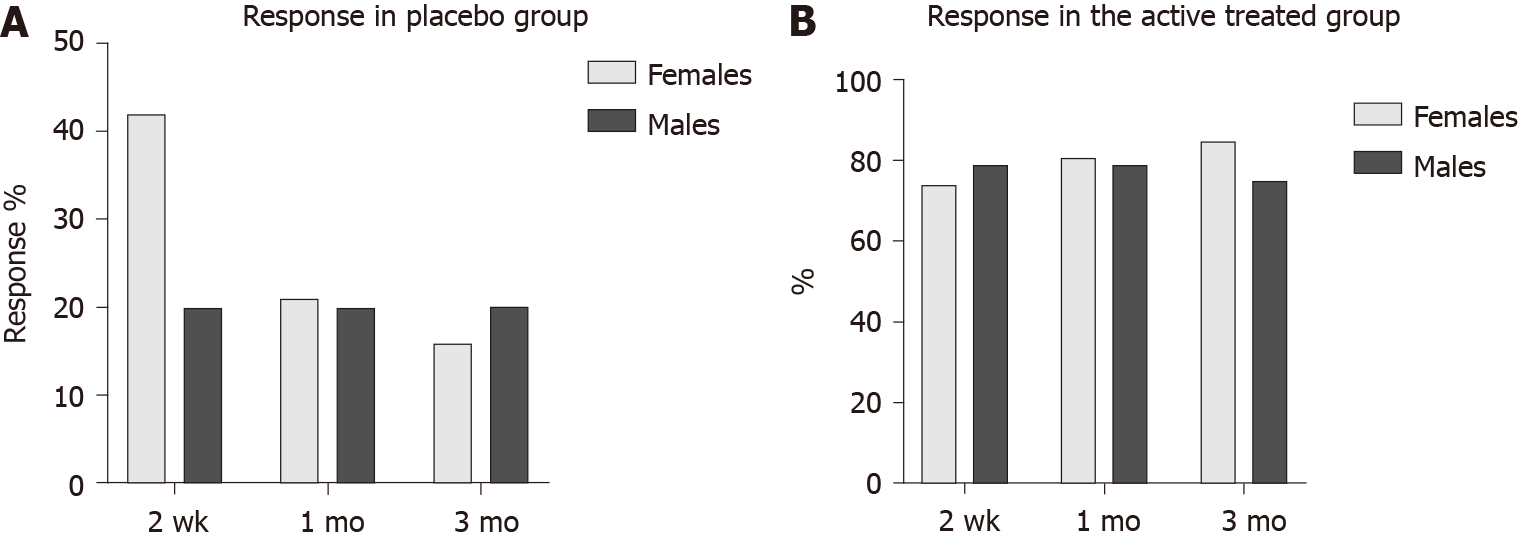
Figure 1 Response to faecal microbiota transplantation in females and males at different intervals after faecal microbiota transplantation in the two groups.
A: Placebo group; B: Active treated group.
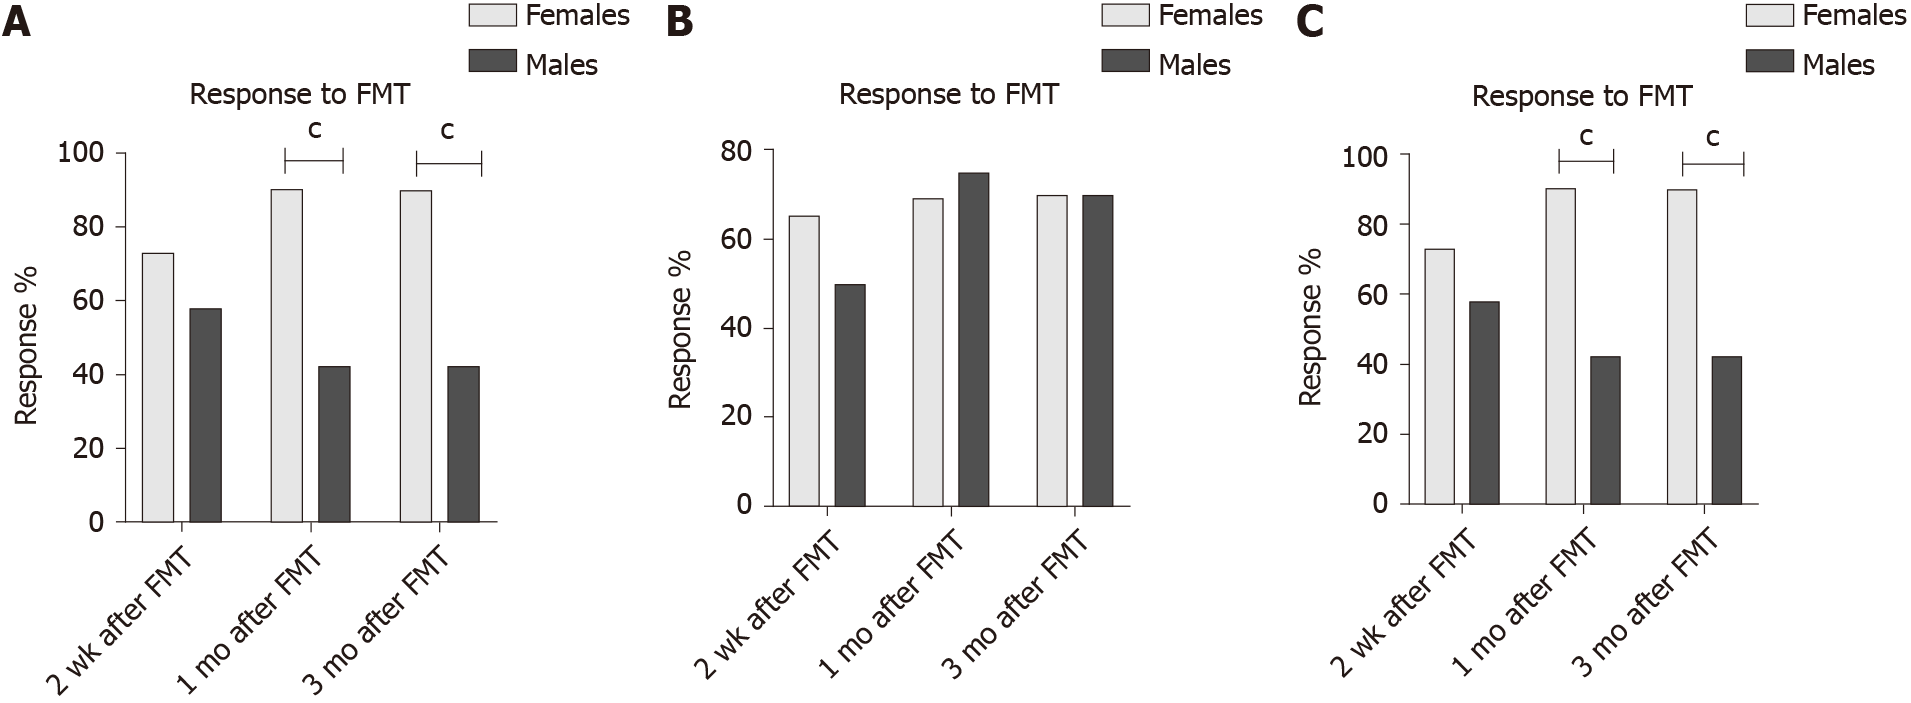
Figure 2 Response rates to faecal microbiota transplantation of female and male irritable bowel syndrome patients.
A: Irritable bowel syndrome with diarrhoea-predominant; B: Irritable bowel syndrome with constipation-predominant; C: Irritable bowel syndrome with mixed diarrhoea and constipation. cP < 0.001. FMT: Faecal microbiota transplantation.
Figure 3 Response rates to faecal microbiota transplantation and the total irritable bowel syndrome-severity scoring system scores of irritable bowel syndrome patients with moderate irritable bowel syndrome symptoms (irritable bowel syndrome-severity scoring system total score between 175 and 300) and with severe irritable bowel syndrome symptoms (irritable bowel syndrome-severity scoring system total score of ≥ 300).
A: Faecal microbiota transplantation; B: Irritable bowel syndrome severity scoring system total score. MS: Moderate irritable bowel syndrome symptoms; SS: Severe irritable bowel syndrome symptoms; FMT: Faecal microbiota transplantation.
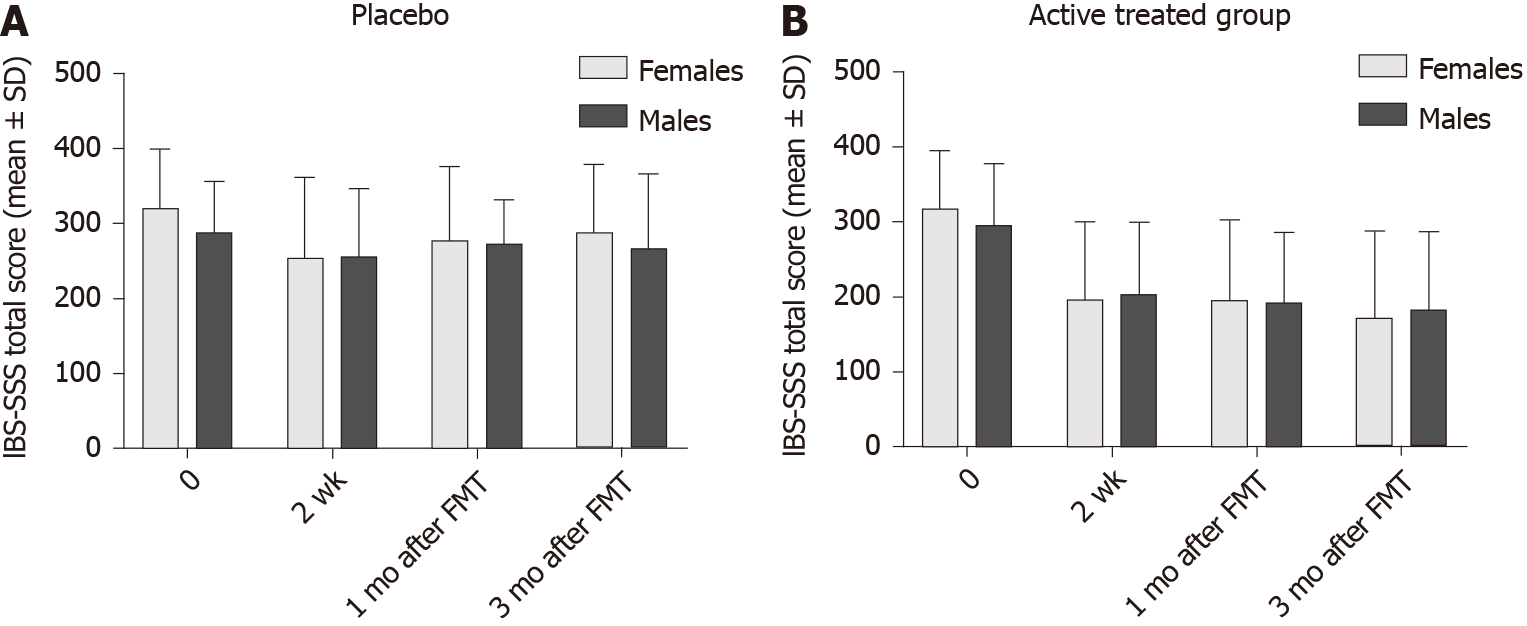
Figure 4 The total irritable bowel syndrome-severity scoring system scores in females and males.
A: Placebo group; B: Active treated group. FMT: Faecal microbiota transplantation.
Figure 5 The total irritable bowel syndrome-severity scoring system scores in females and males.
A: Irritable bowel syndrome with diarrhoea-predominant; B: Irritable bowel syndrome with constipation-predominant; C: Irritable bowel syndrome with mixed diarrhoea and constipation. aP < 0.05. IBD-SSS: Irritable bowel syndrome-severity scoring system; FMT: Faecal microbiota transplantation.
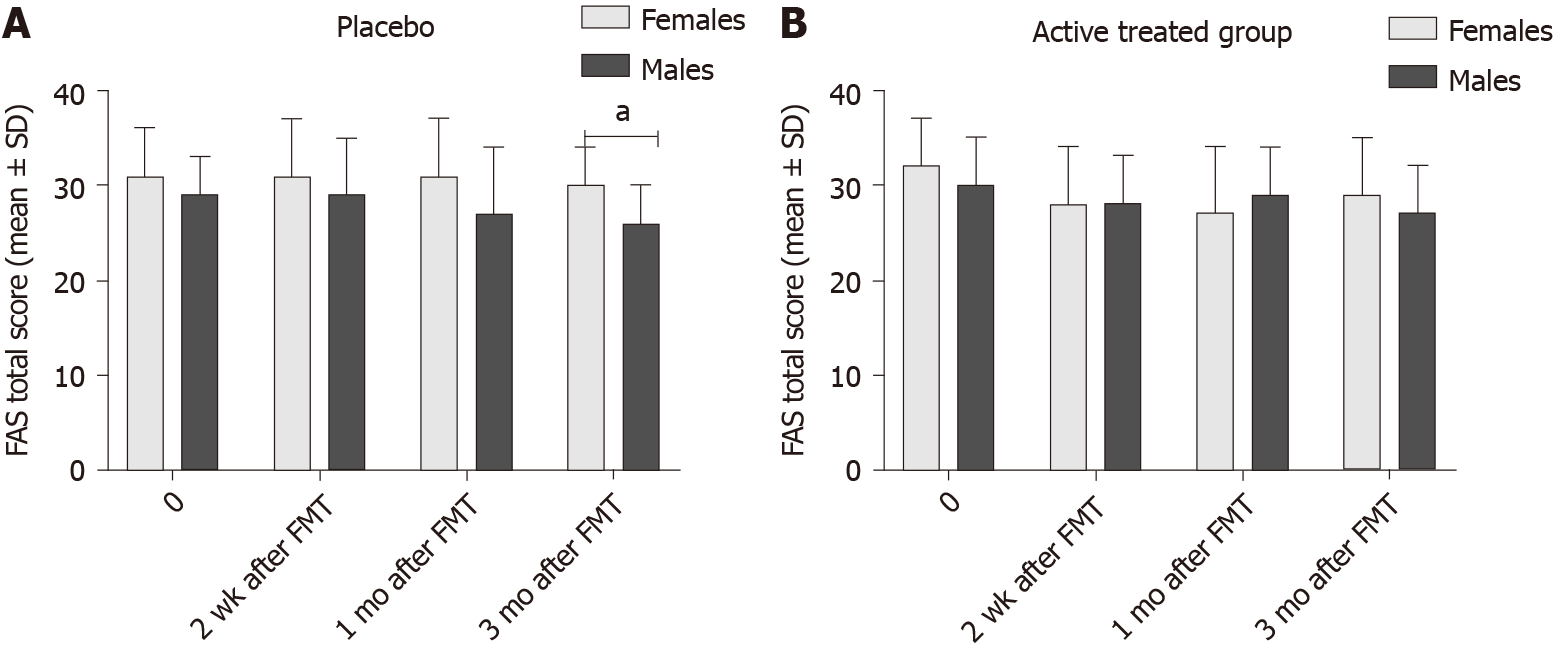
Figure 6 The total Fatigue Assessment Scale scores in female and male irritable bowel syndrome patients.
A: Placebo group; B: Active treated group. aP < 0.05. FAS: Fatigue Assessment Scale; FMT: Faecal microbiota transplantation.
Figure 7 Total Fatigue Assessment Scale scores in female and male patients.
A: Irritable bowel syndrome with diarrhoea-predominant; B: Irritable bowel syndrome with constipation-predominant; C: Irritable bowel syndrome with mixed diarrhoea and constipation. FAS: Fatigue Assessment Scale; FMT: Faecal microbiota transplantation.
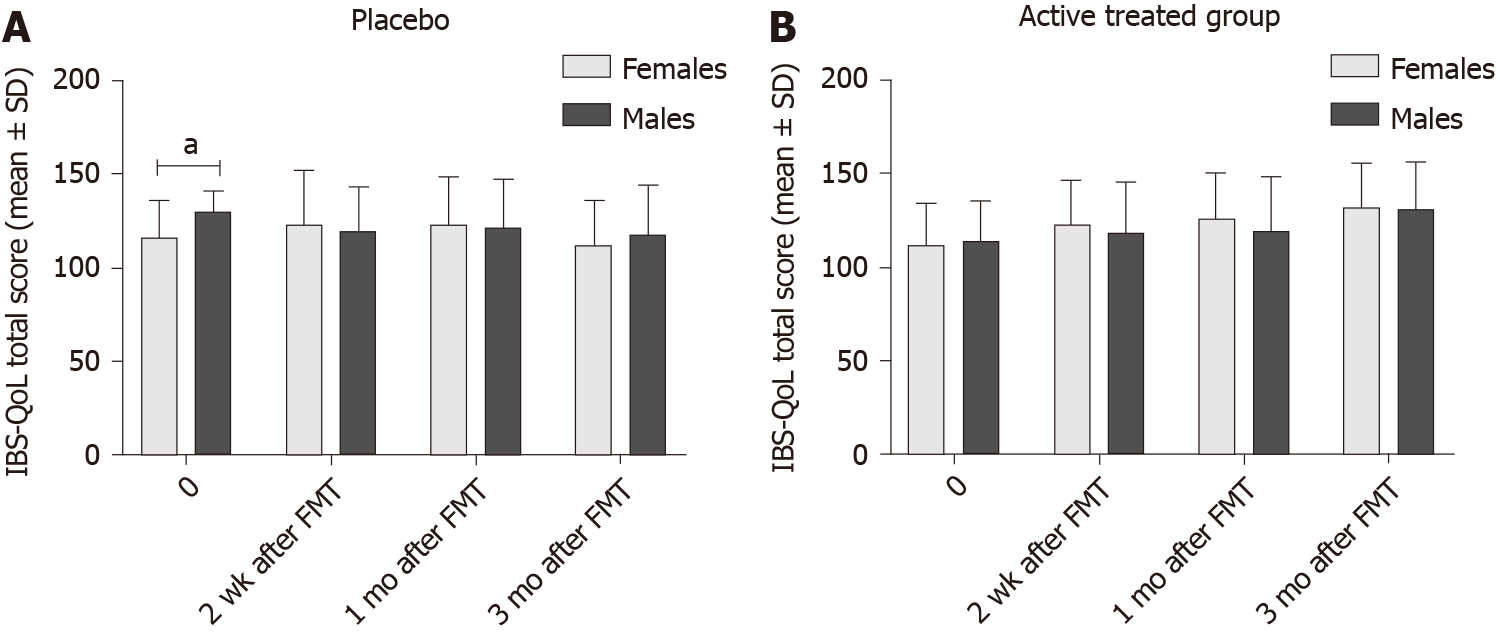
Figure 8 Total irritable bowel syndrome quality of life scale scores in female and male patients.
A: Placebo group; B: Active treated group. aP < 0.05. IBS-QoL: Irritable bowel syndrome quality of life scale; FMT: Faecal microbiota transplantation.
Figure 9 Total irritable bowel syndrome quality of life scale scores in females and males.
A: Irritable bowel syndrome with diarrhoea-predominant; B: Irritable bowel syndrome with constipation-predominant; C: Irritable bowel syndrome with mixed diarrhoea and constipation. IBS-QoL: Irritable bowel syndrome quality of life scale; FMT: Faecal microbiota transplantation.
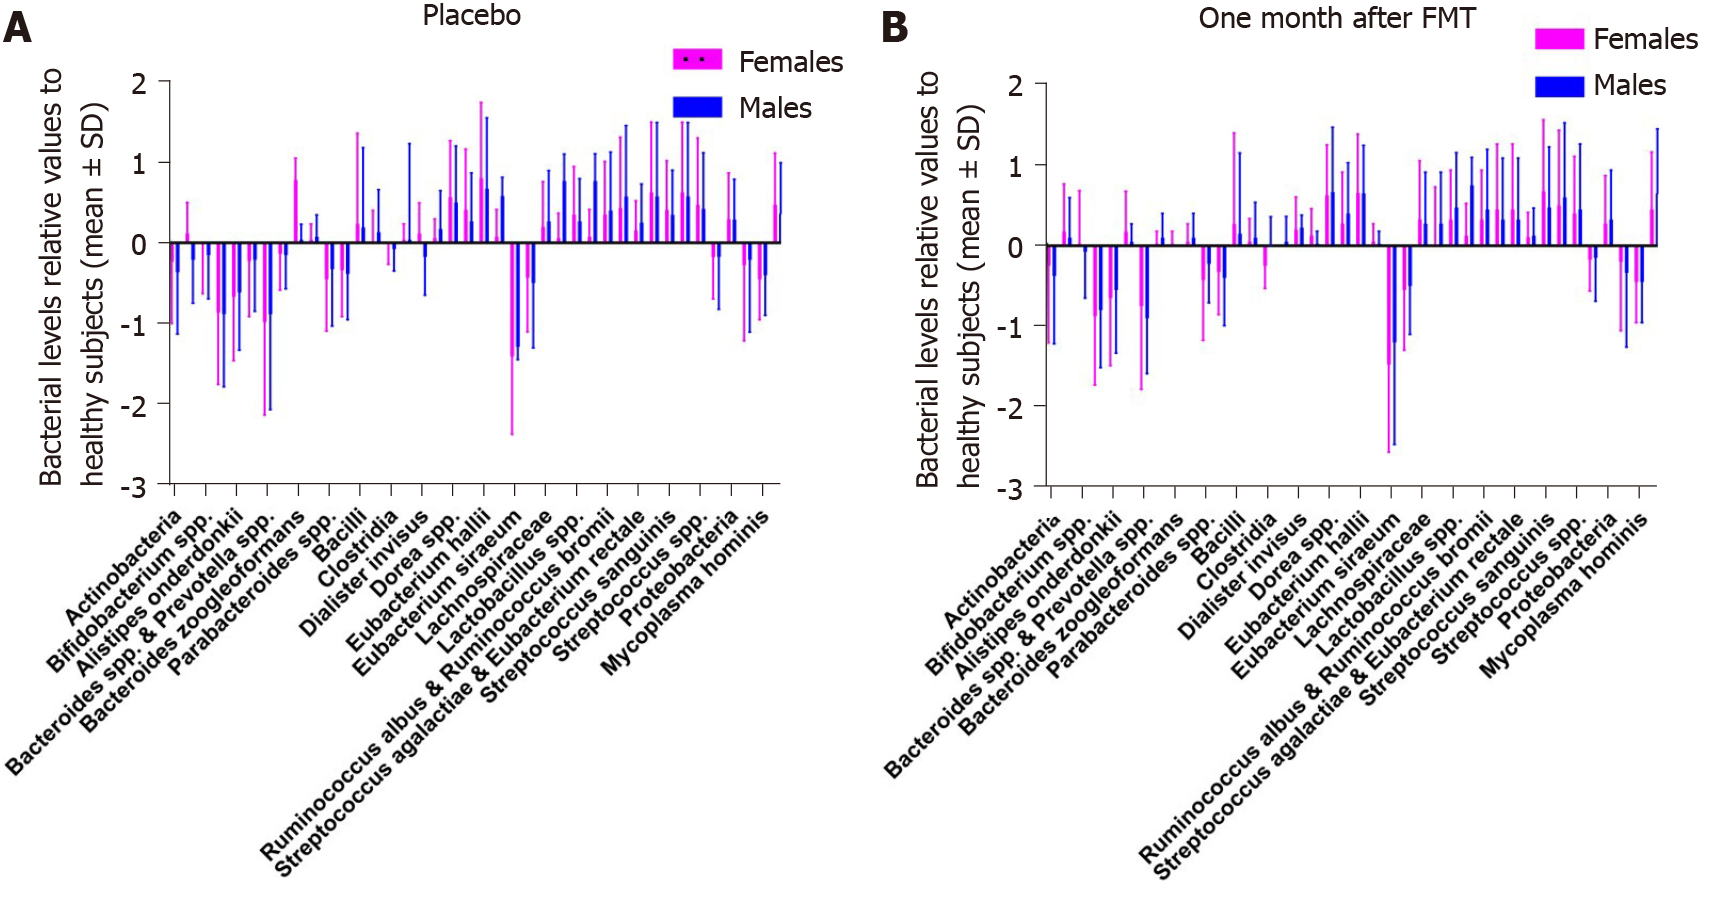
Figure 10 Bacteria levels in the faeces of female and male irritable bowel syndrome patients in the placebo group at the baseline and 1 mo after faecal microbiota transplantation.
A: Baseline; B: 1 mo after faecal microbiota transplantation. The bacterial levels are relative values to a normobiotic microbiota profile of 165 healthy subjects. FMT: Faecal microbiota transplantation.
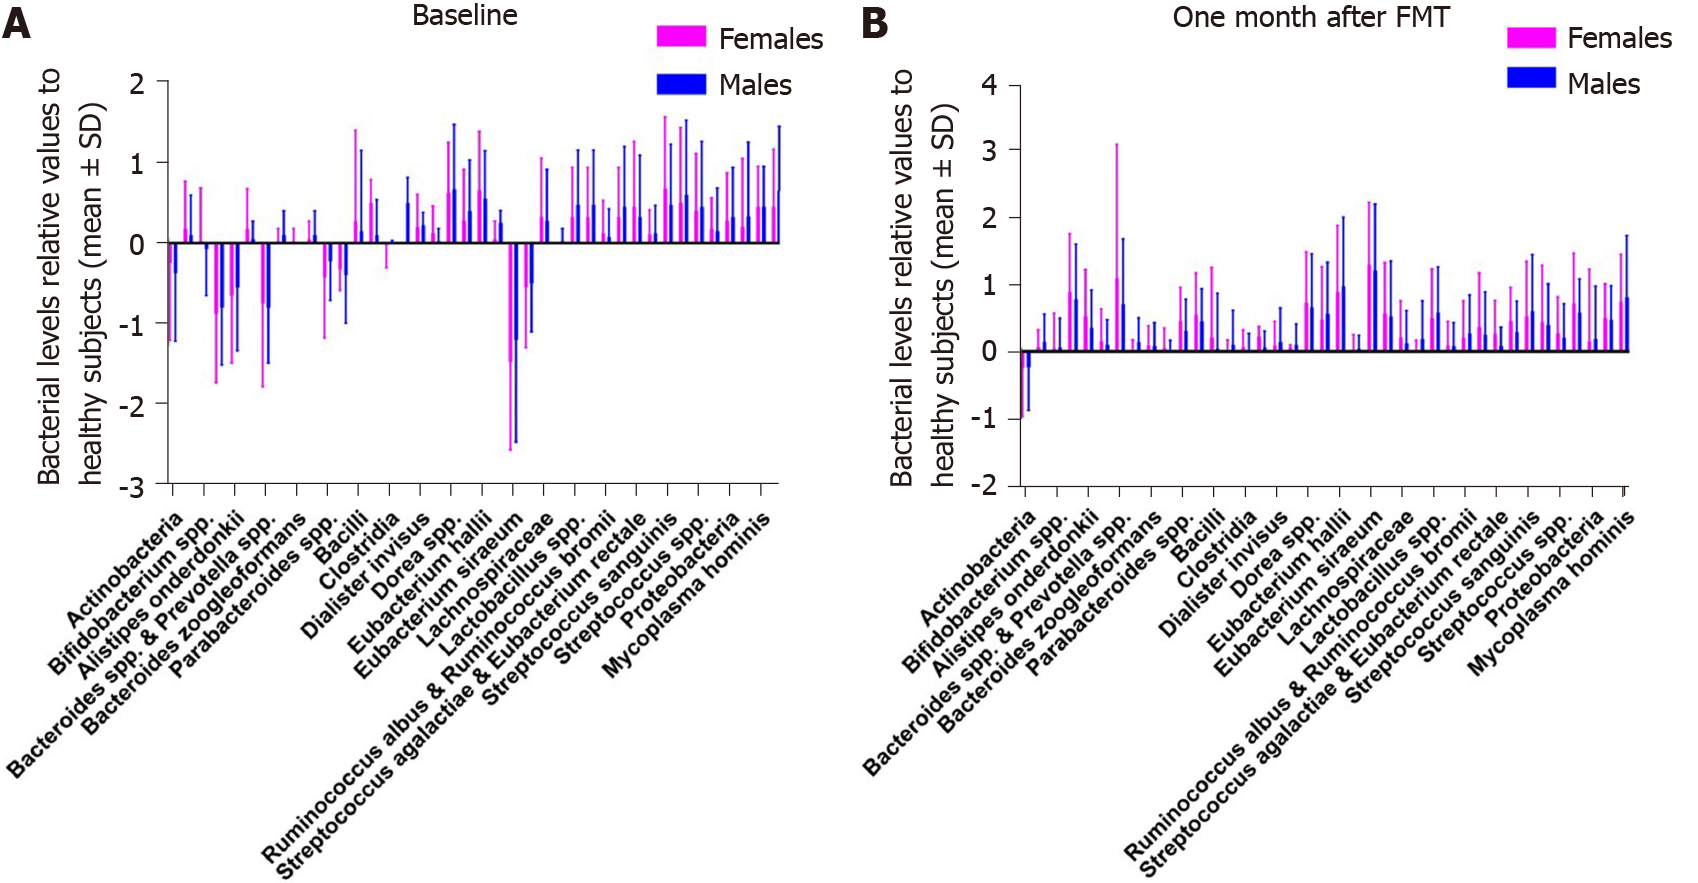
Figure 11 Faecal bacteria levels in the female and male irritable bowel syndrome patients in the active treated group at the baseline and 1 mo after faecal microbiota transplantation.
A: Baseline; B: 1 mo after faecal microbiota transplantation. The bacterial levels are expressed as in Figure 10. FMT: Faecal microbiota transplantation.
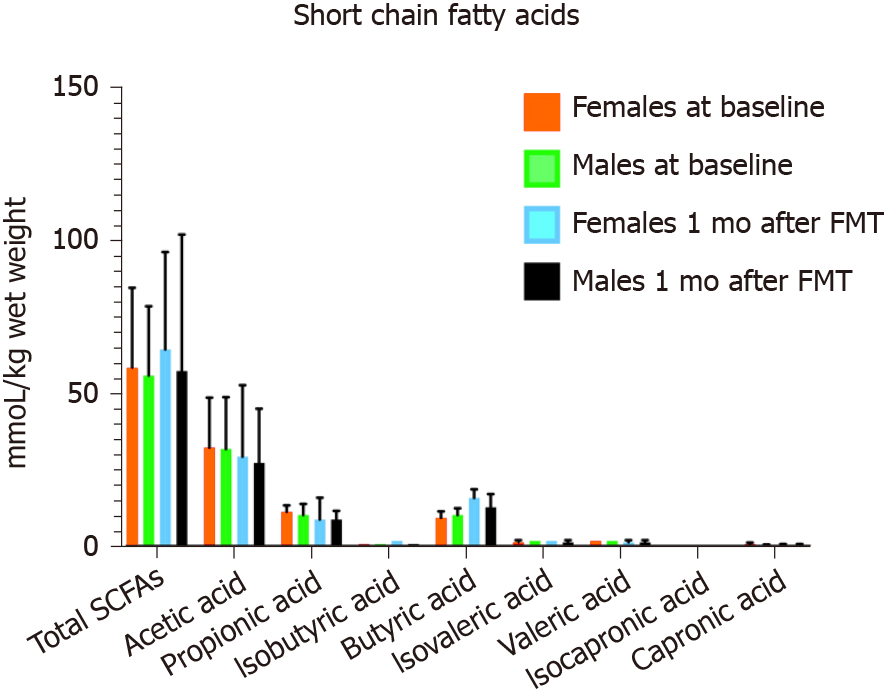
Figure 12 The faecal short chain fatty acids concentration of female and male patients in both the placebo and active treated groups at the baseline and 1 mo after faecal microbiota transplantation.
The values were expressed as mmol/kg wet weight (mean ± SD).
- Citation: El-Salhy M, Casen C, Valeur J, Hausken T, Hatlebakk JG. Responses to faecal microbiota transplantation in female and male patients with irritable bowel syndrome. World J Gastroenterol 2021; 27(18): 2219-2237
- URL: https://www.wjgnet.com/1007-9327/full/v27/i18/2219.htm
- DOI: https://dx.doi.org/10.3748/wjg.v27.i18.2219


