Copyright
©The Author(s) 2021.
World J Gastroenterol. May 7, 2021; 27(17): 1993-2014
Published online May 7, 2021. doi: 10.3748/wjg.v27.i17.1993
Published online May 7, 2021. doi: 10.3748/wjg.v27.i17.1993
Figure 1 Aberrantly expressed TP73-AS1 in pancreatic cancer cells and tissues.
A: TP73-AS1 expression in pancreatic cancer (PC) cell lines and an immortalized human pancreatic duct epithelial cell (H6C7) detected by quantitative real-time polymerase chain reaction; B: The relative expression of TP73-AS1 in 116 paired PC tissues and adjacent non-tumor tissues; C: TP73-AS1 is highly expressed in collected PC tissues; D: The different expression of TP73-AS1 between tumor-node-metastasis (TNM) stage I-II; and TNM stage III; E: Kaplan-Meier analysis of the overall survival in patients with PC based on the levels of TP73-AS1 expression. aP < 0.05; bP < 0.01.
Figure 2 Knockdown of TP73-AS1 suppresses cell proliferation and invasion in vitro.
A: Quantitative real-time polymerase chain reaction analysis of TP73-AS1 expression in AsPc-1 and Capan-1 cells transfected with si-control and small interfering RNAs targeting TP73-AS1; B: CCK-8 proliferation assay in pancreatic cancer cells transfected with si-control, si-TP73-AS1#1, or si-TP73-AS1#3; C: Colony formation assay in AsPc-1 and Capan-1 cells transfected with si-control, si-TP73-AS1#1, or si-TP73-AS1#3; D: Role of TP73-AS1 on AsPc-1 and Capan-1 cells apoptosis checked by flow cytometry assay; E and F: Effect of TP73-AS1 silencing on the migration and invasion ability of AsPc-1 (E) and Capan-1 (F) cell determined by transwell assay. aP < 0.05; bP < 0.01.
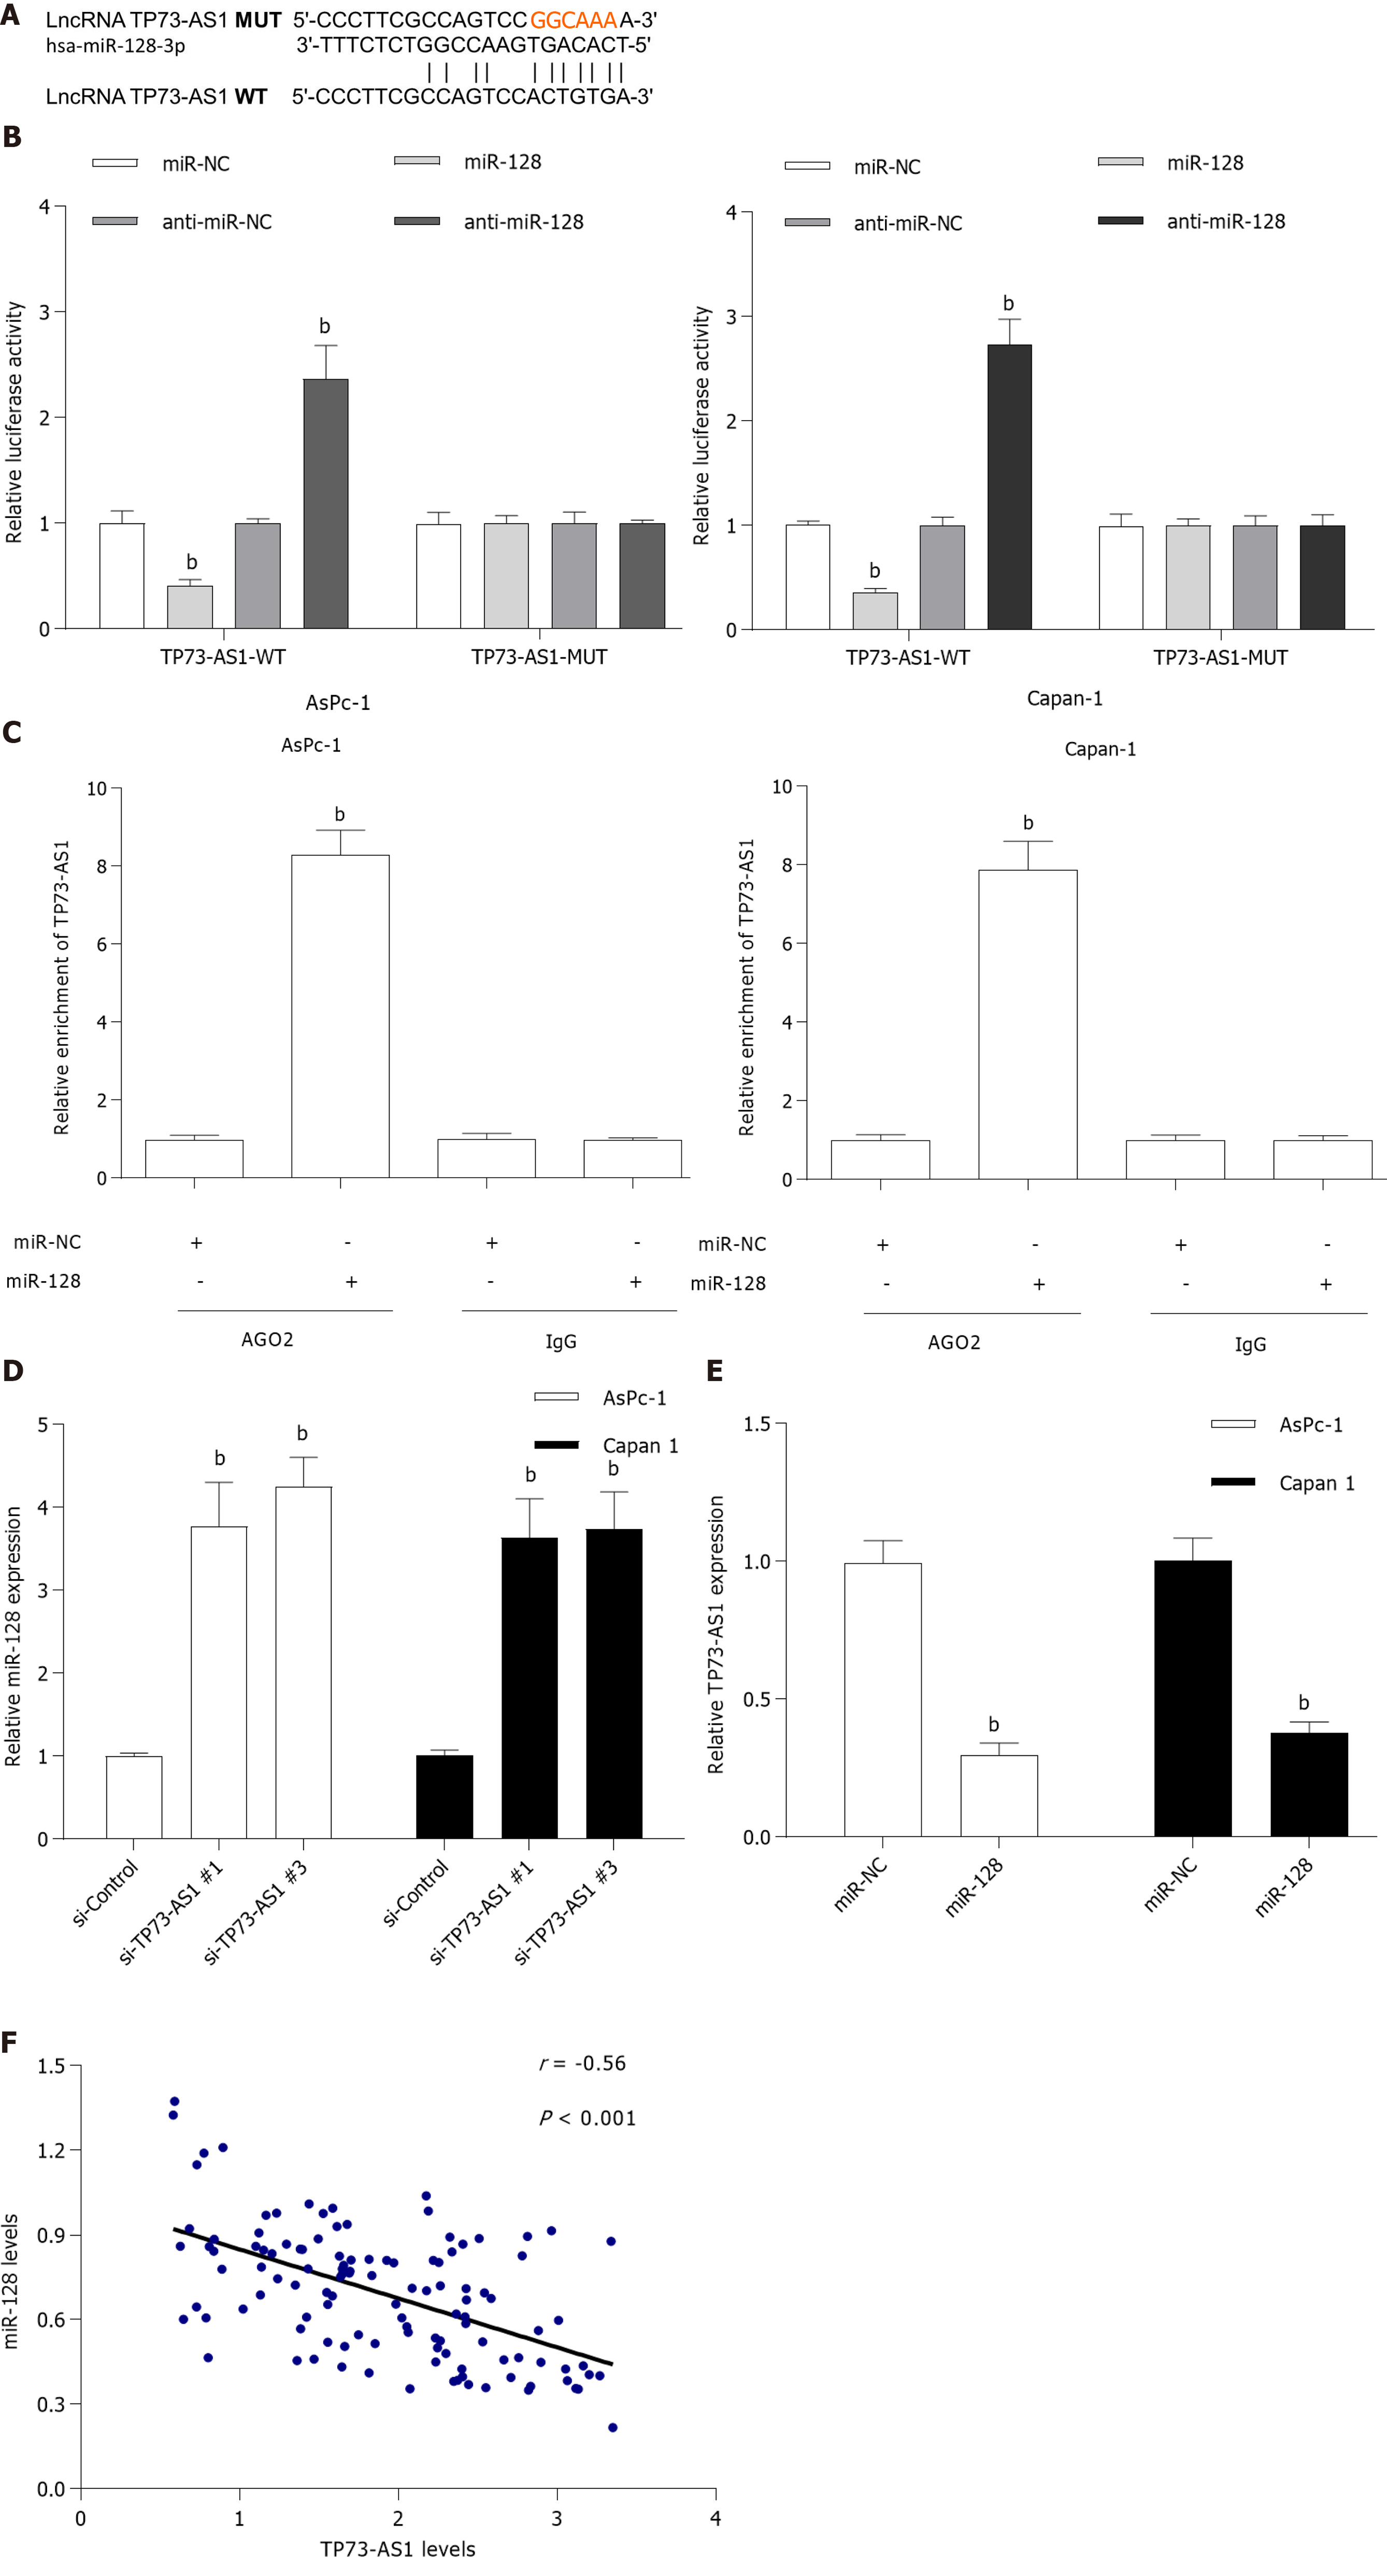
Figure 3 TP73-AS1 physically interacts with miR-128-3p-3p.
A: miR-128-3p and its predicted binding sites in the TP73-AS1 sequence; B: Luciferase activity of pancreatic cancer (PC) cells co-transfected with miRNA mimics and luciferase reporter vectors containing TP73-AS1-WT or TP73-AS1-MUT; C: RNA immunoprecipitation assay of the enrichment of TP73-AS1 in AsPc-1 and Capan-1 transfected with miR-NC or miR-128-3p. Immunoglobulin G was used as negative control; D: Expression levels of miR-128-3p in AsPc-1 and Capan-1 cells transfected with si-control or small interfering RNAs targeting TP73-AS1; E: Expression levels of miR-128-3p in PC tissues and adjacent non-tumor tissues; F: The expression of TP73-AS1 and miR-128-3p exhibits a negative correlation in PC tissues. bP < 0.01. IgG: Immunoglobulin G.
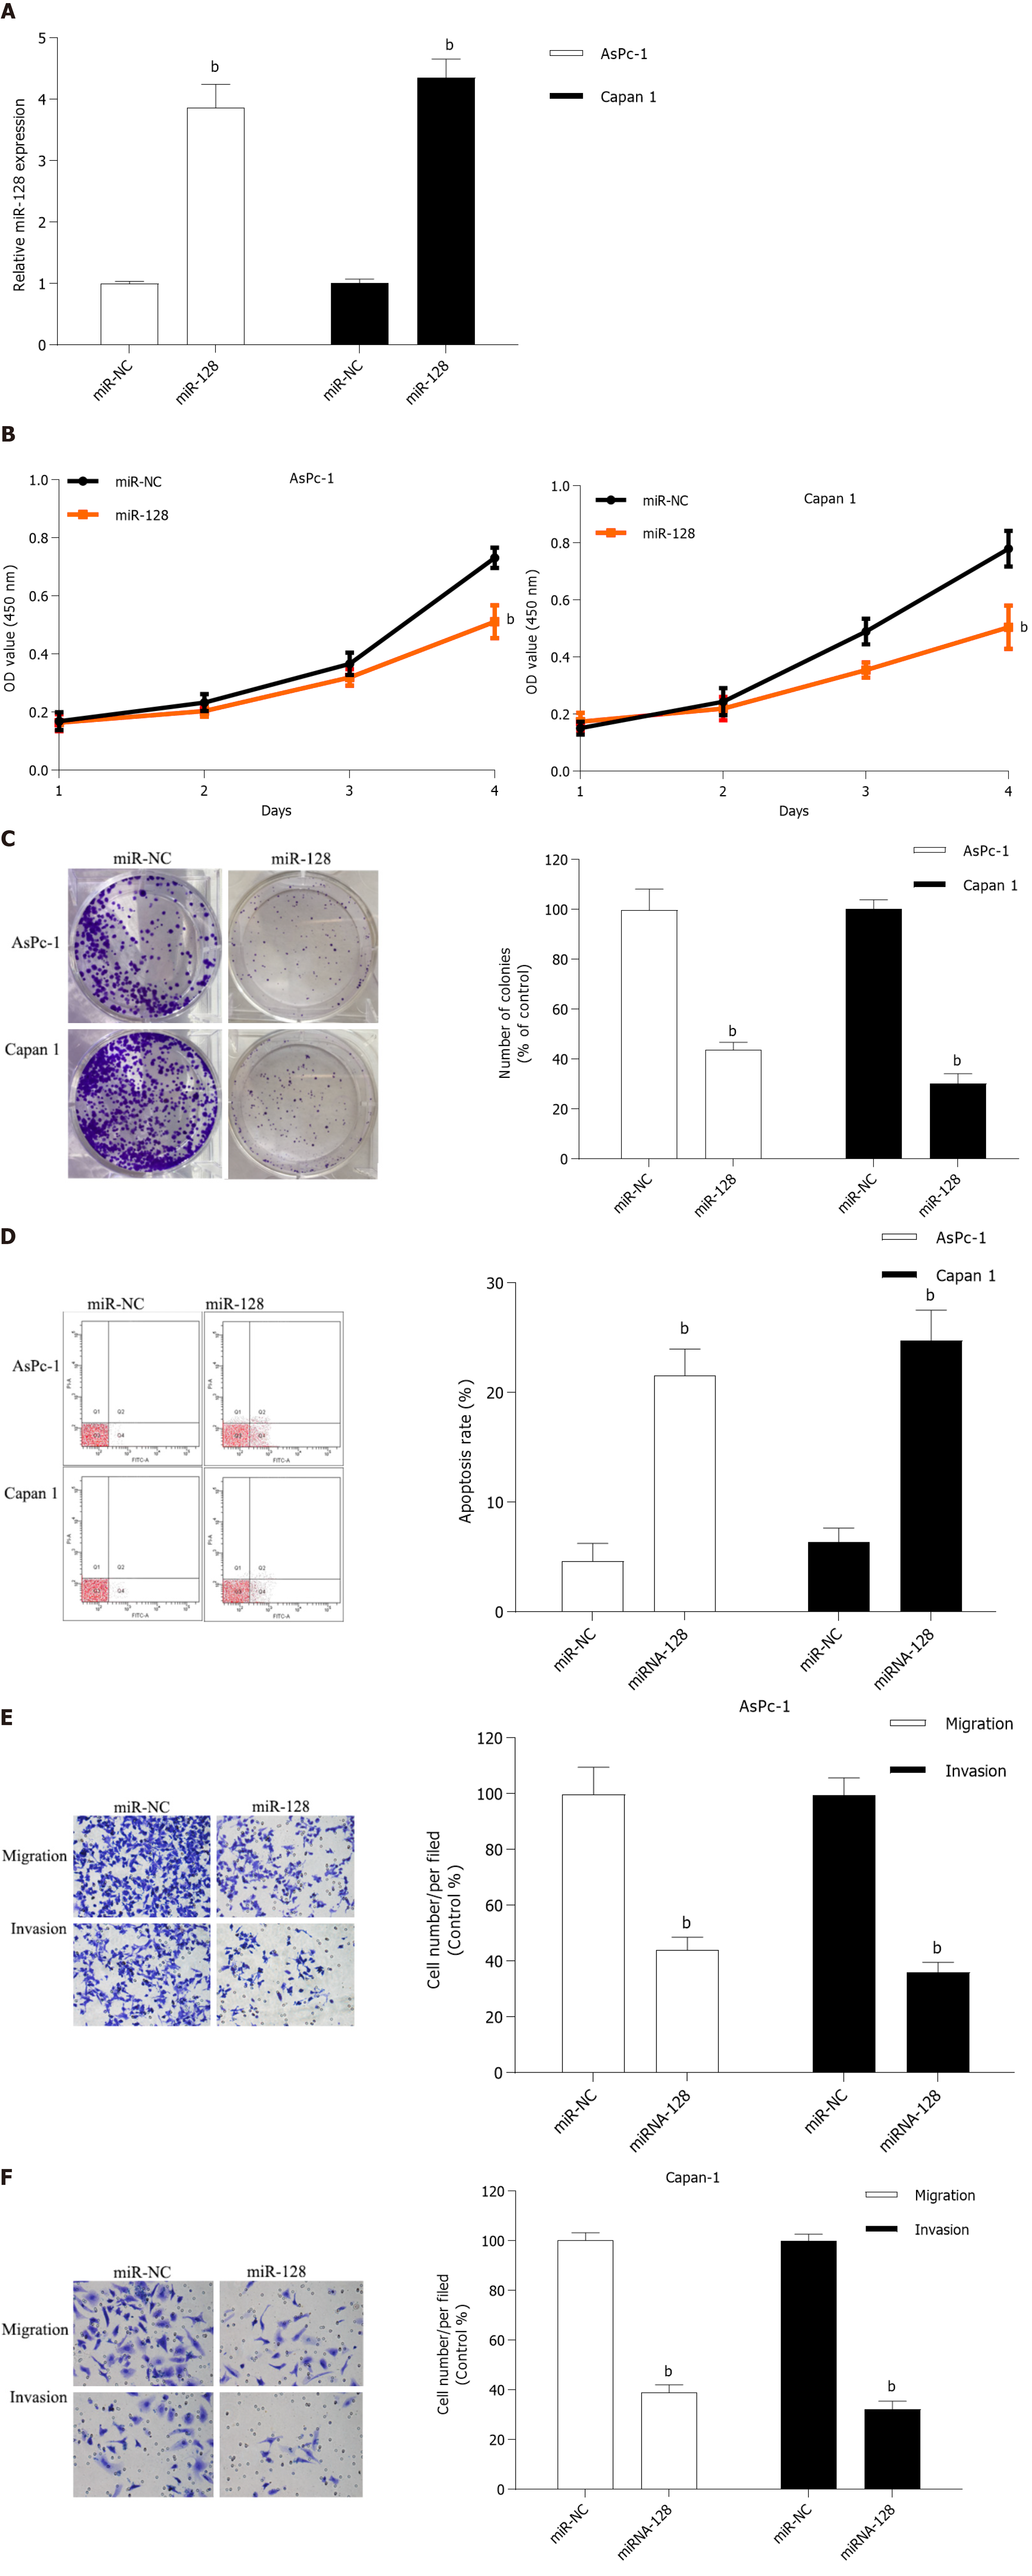
Figure 4 MiR-128-3p inhibits the proliferation, migration, and invasion of pancreatic cancer cells.
A: The efficiencies of overexpression for miR-128-3p determined by quantitative real-time polymerase chain reaction; B and C: CCK-8 assay (B) and colony formation assay (C) for detecting cell proliferative ability after overexpression of miR-128-3p; D: Effect of miR-128-3p on pancreatic cancer cell apoptosis determined by flow cytometry; E and F: Transwell assay with or without matrigel for assessing the effect of miR-128-3p on cell migration and invasion in AsPc-1 (E) and Capan-1 (F) cells. bP < 0.01.
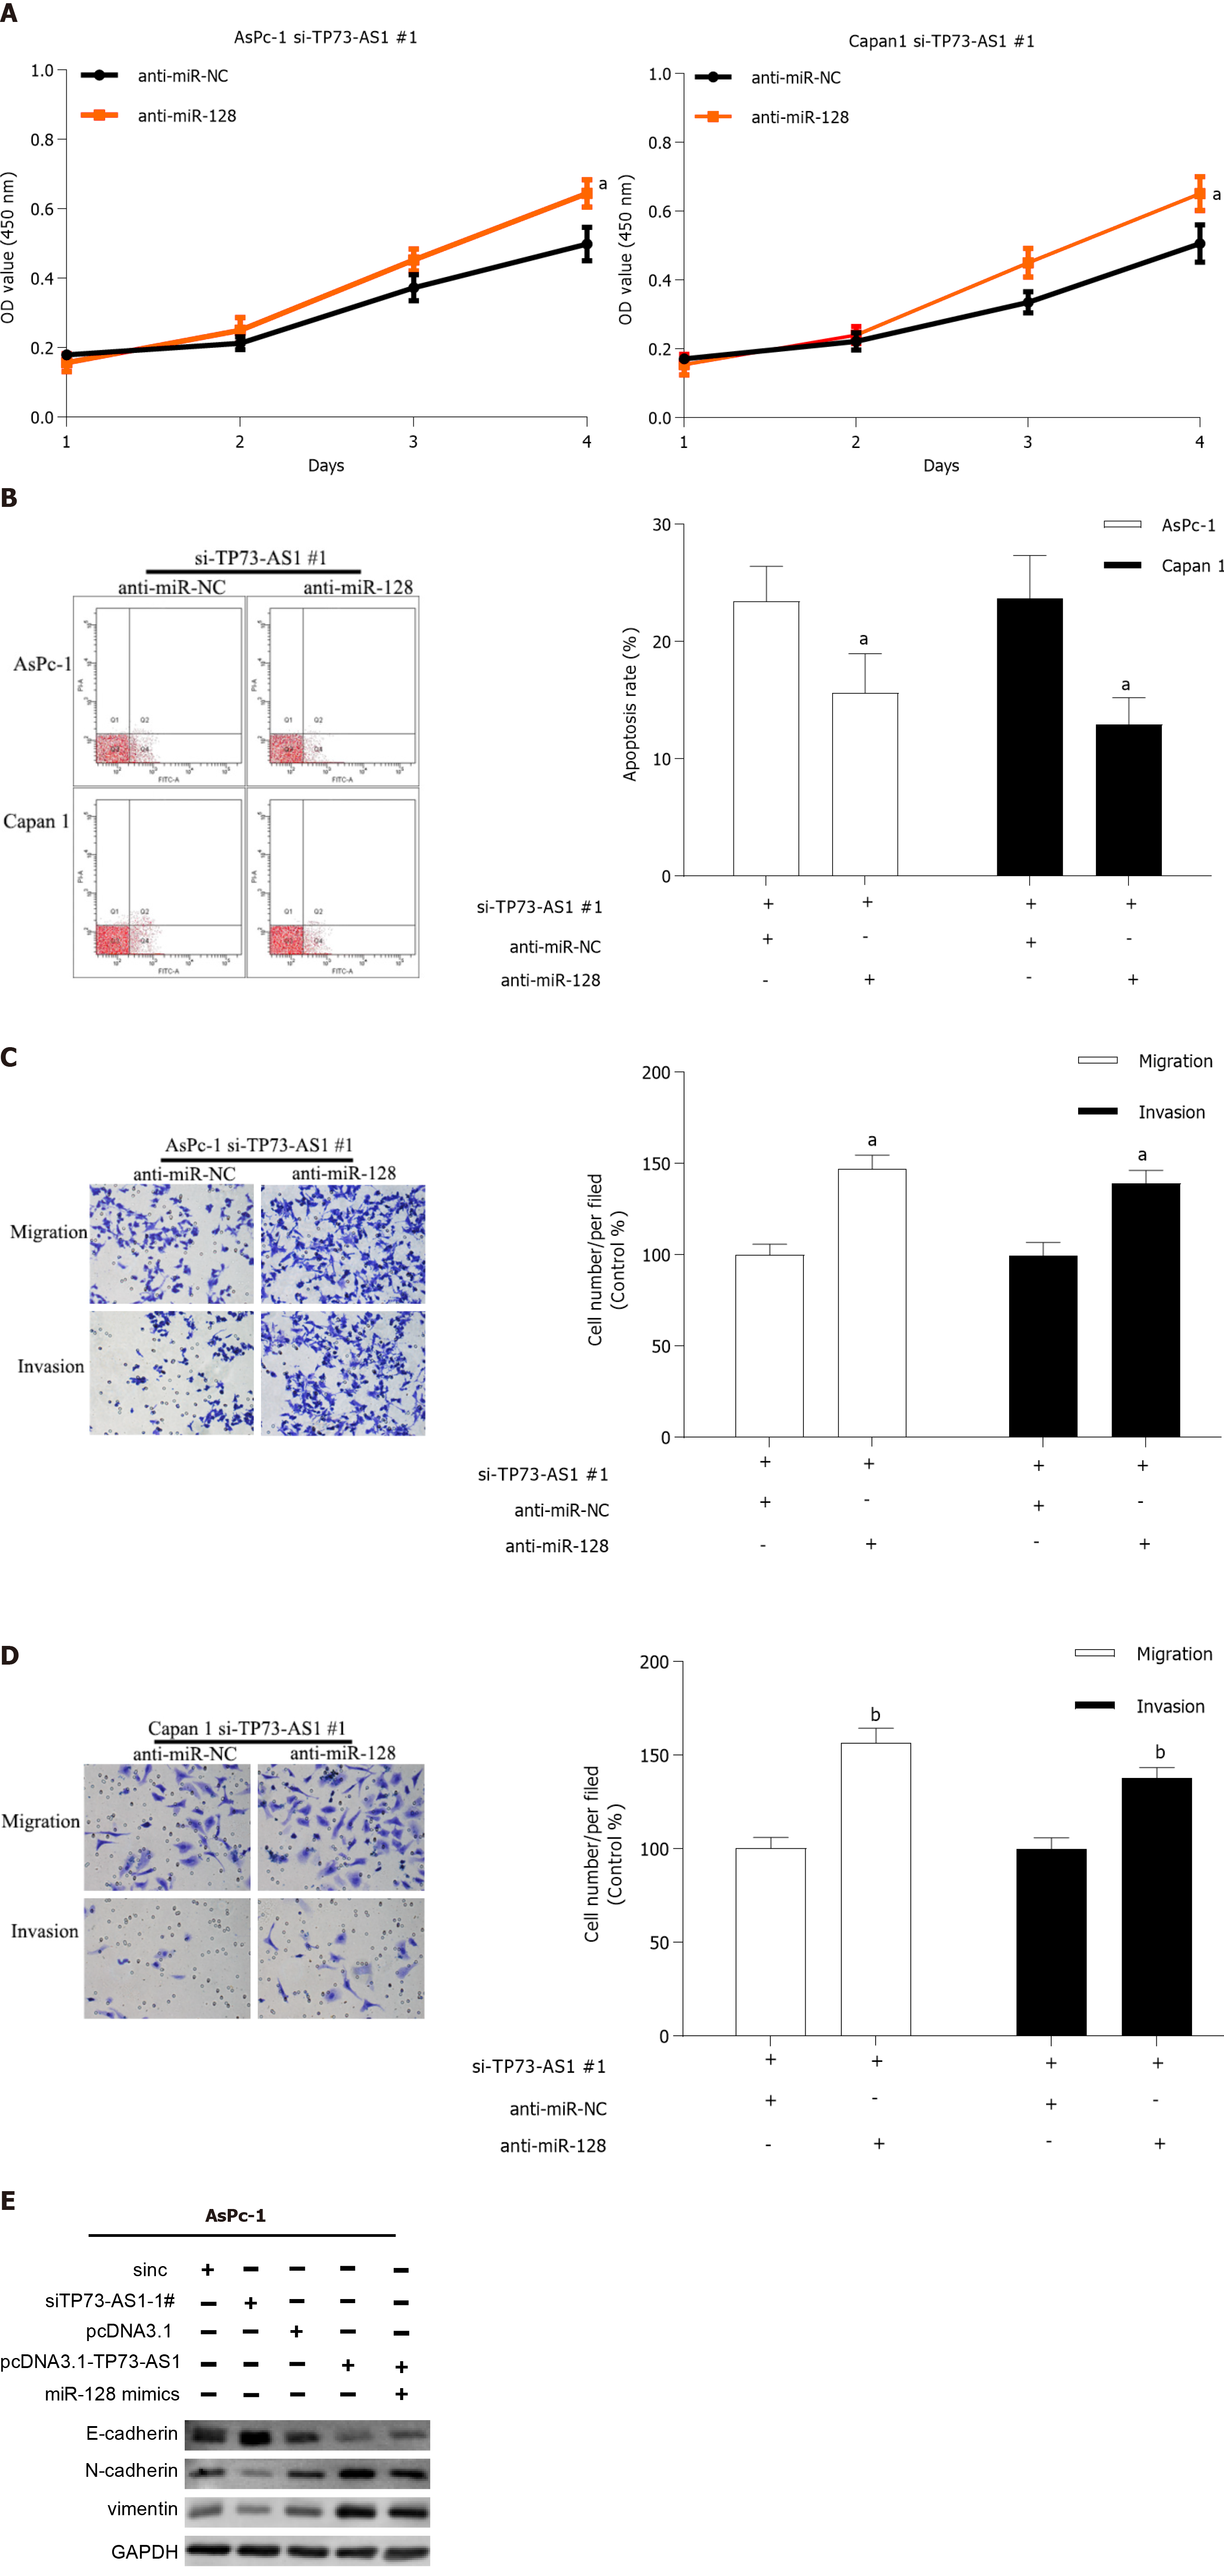
Figure 5 MiR-128-3p is responsible for TP73-AS1-mediated malignant behavior.
A: Knockdown of miR-128-3p eliminates the inhibition on cell proliferation by TP73-AS1 depletion; B: Depletion of miR-128-3p abolishes cell apoptosis induced by TP73-AS1 silencing; C and D: Representative images of migrated and invaded cells treated with si-TP73-AS1#1 and anti-miR-NC or anti-miR-128-3p in AsPc-1 (C) and Capan-1 (D) cells; E: Epithelial-mesenchymal transition-related proteins detected by Western blot. aP < 0.05; bP < 0.01. GAPDH: Glyceraldehyde-3-phosphate dehydrogenase.
Figure 6 TP73-AS1 increases GOLM1 expression by decreasing miR-128-3p.
A: Schematic diagram presenting the putative miR-128-3p recognition site in the GOLM1 sequence; B: Luciferase activity in pancreatic cancer (PC) cells transfected with miR-128-3p and reporter plasmids containing WT or MUT GOLM1 3’UTR; C: The GOLM1 mRNA (up) and protein (down) levels in AsPc-1 and Capan-1 cells with miR-128-3p transfection; D: The GOLM1 mRNA (up) and protein (down) levels in AsPc-1 and Capan-1 cells after TP73-AS1 silencing; E: The expression levels of GOLM1 mRNA in 116 pairs of PC and adjacent non-tumor tissues assessed by quantitative real-time polymerase chain reaction; F: The relationship between miR-128-3p and GOLM1 mRNA levels assessed by Pearson correlation analysis; G: The relationship between TP73-AS1 and GOLM1 mRNA levels assessed by Pearson correlation analysis; H: The protein expression levels of GOLM1 detected by Western blot assay as indicated. bP < 0.01. GAPDH: Glyceraldehyde-3-phosphate dehydrogenase.
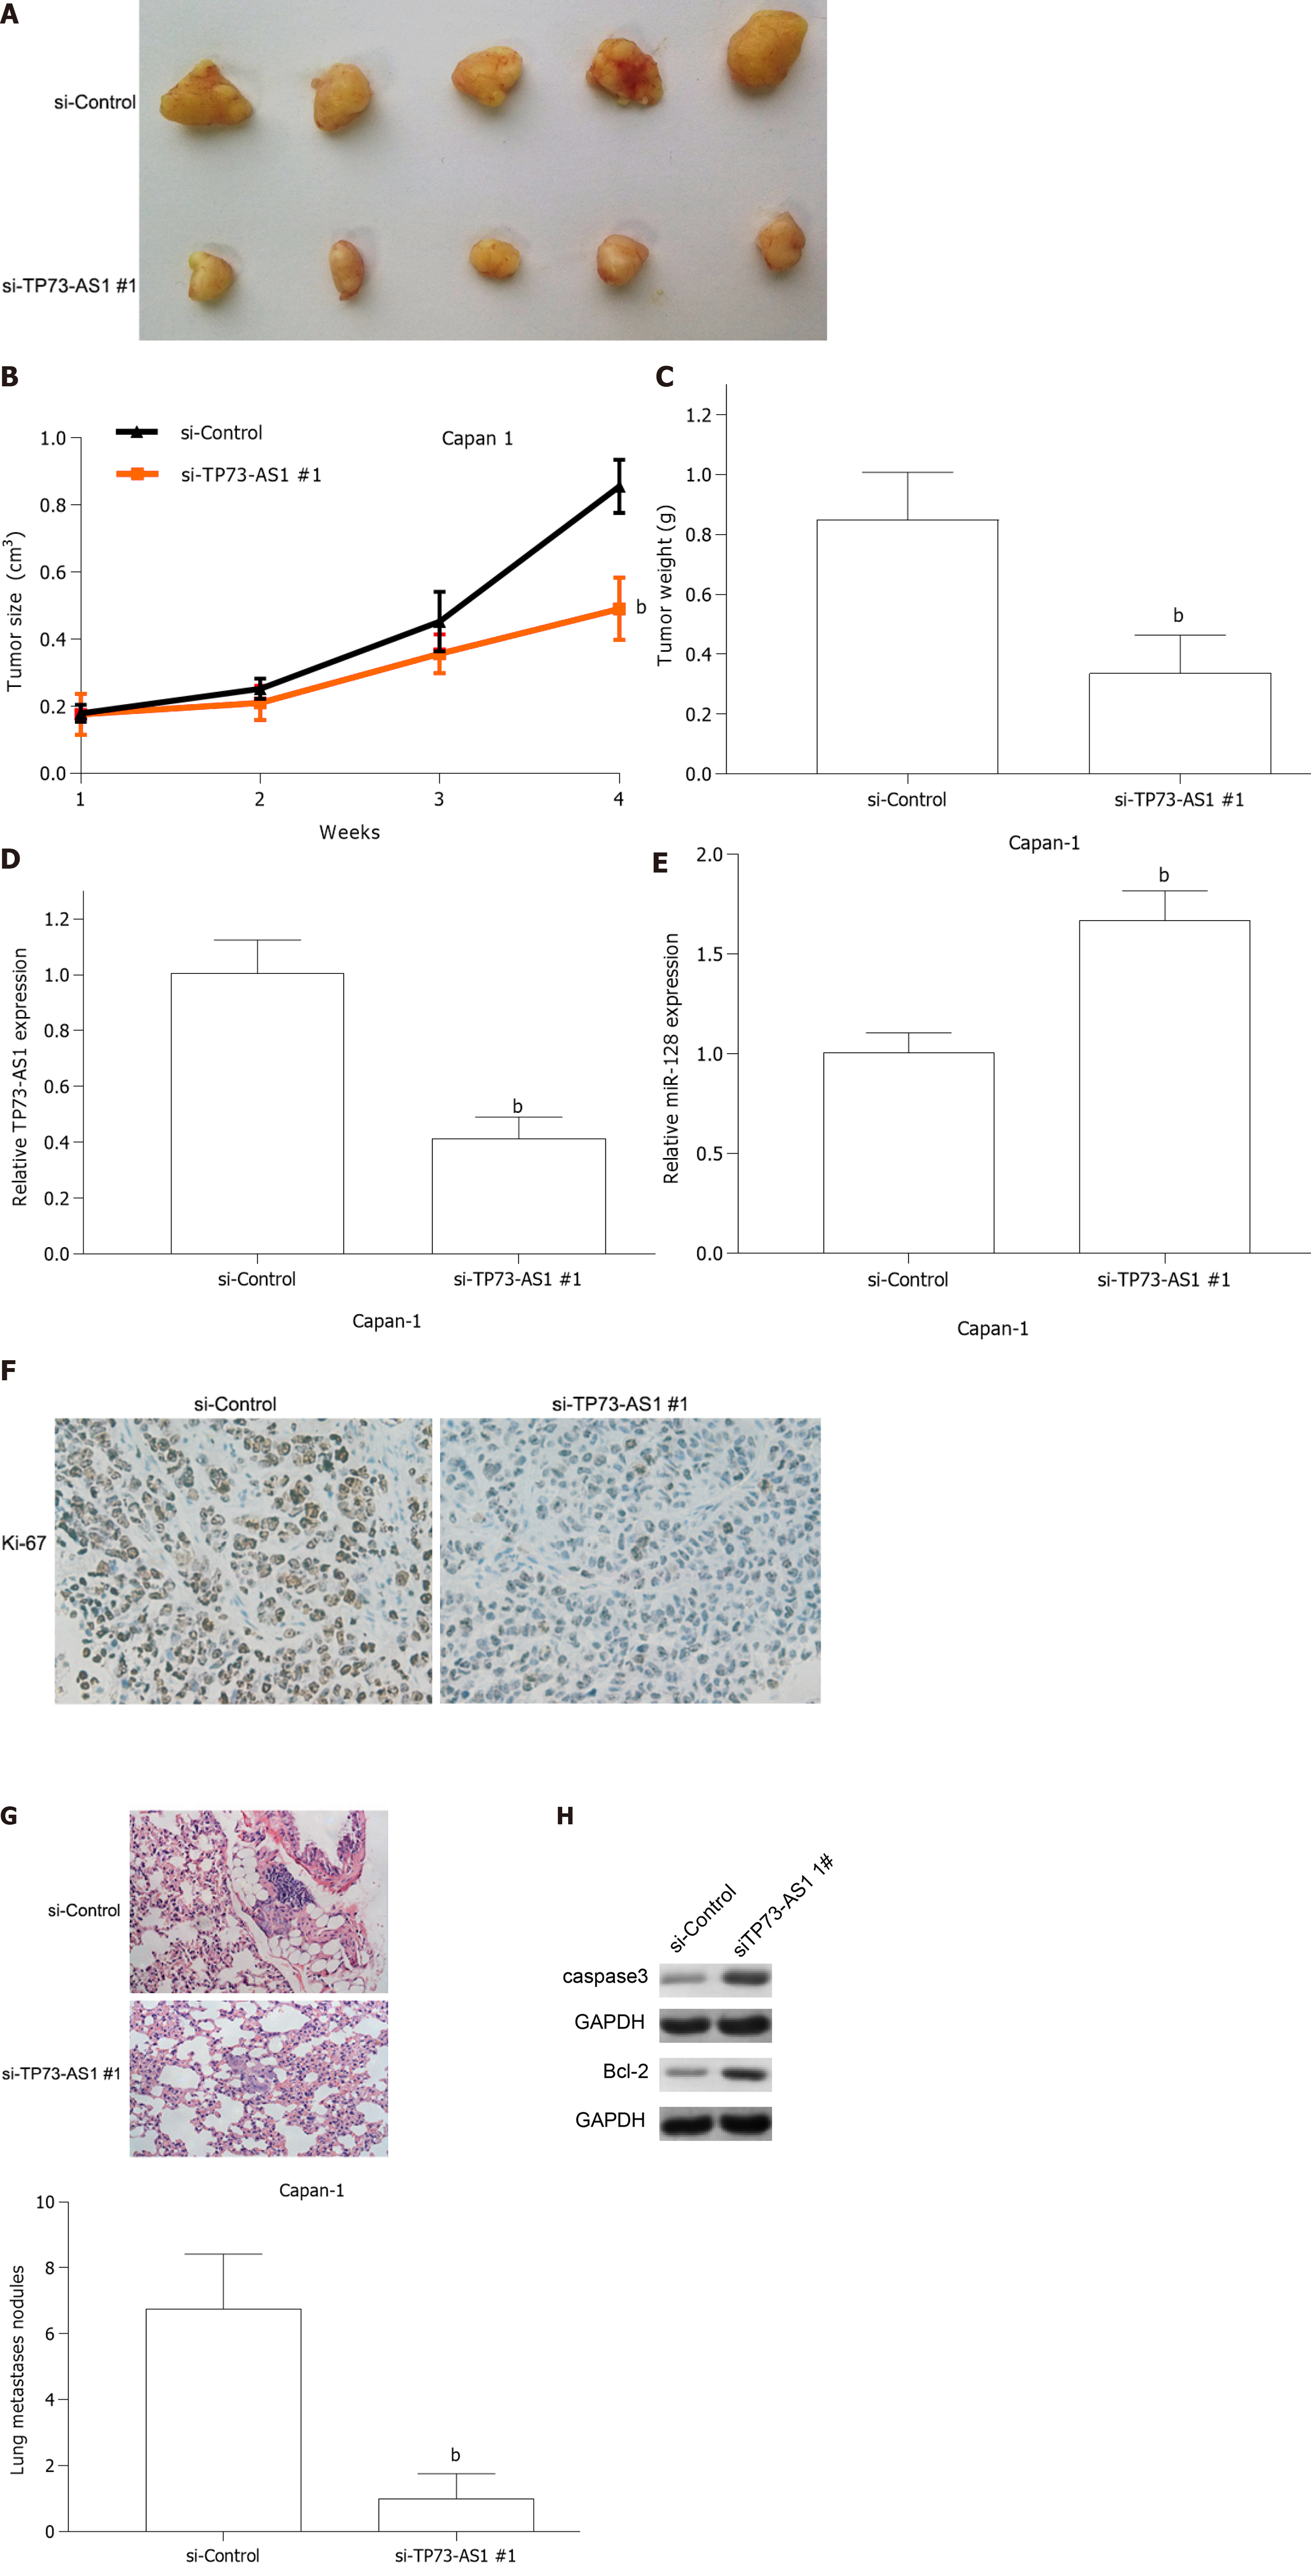
Figure 7 TP73-AS1 knockdown inhibits tumor growth and metastasis in nude mice.
A: Images of resected tumors from nude mice from the indicated groups. n = 5 mice per group; B: Tumor growth curves established by measuring tumor volume after injection at the indicated time points; C: Weights of resected tumors from nude mice from the indicated groups; D and E: Quantitative real-time polymerase chain reaction to detect the expression of TP73-AS1 (D) and miR-128-3p (E) in xenograft tumor tissues; F: Ki67 expression in resected tumor tissues evaluated by immunohistochemistry analysis; G: Representative images and quantification of hematoxylin and eosin staining of lungs isolated from mice; H: Apoptosis markers detected by Western blot. bP < 0.01. GAPDH: Glyceraldehyde-3-phosphate dehydrogenase.
- Citation: Wang B, Sun X, Huang KJ, Zhou LS, Qiu ZJ. Long non-coding RNA TP73-AS1 promotes pancreatic cancer growth and metastasis through miRNA-128-3p/GOLM1 axis. World J Gastroenterol 2021; 27(17): 1993-2014
- URL: https://www.wjgnet.com/1007-9327/full/v27/i17/1993.htm
- DOI: https://dx.doi.org/10.3748/wjg.v27.i17.1993


