Copyright
©The Author(s) 2021.
World J Gastroenterol. May 7, 2021; 27(17): 1973-1992
Published online May 7, 2021. doi: 10.3748/wjg.v27.i17.1973
Published online May 7, 2021. doi: 10.3748/wjg.v27.i17.1973
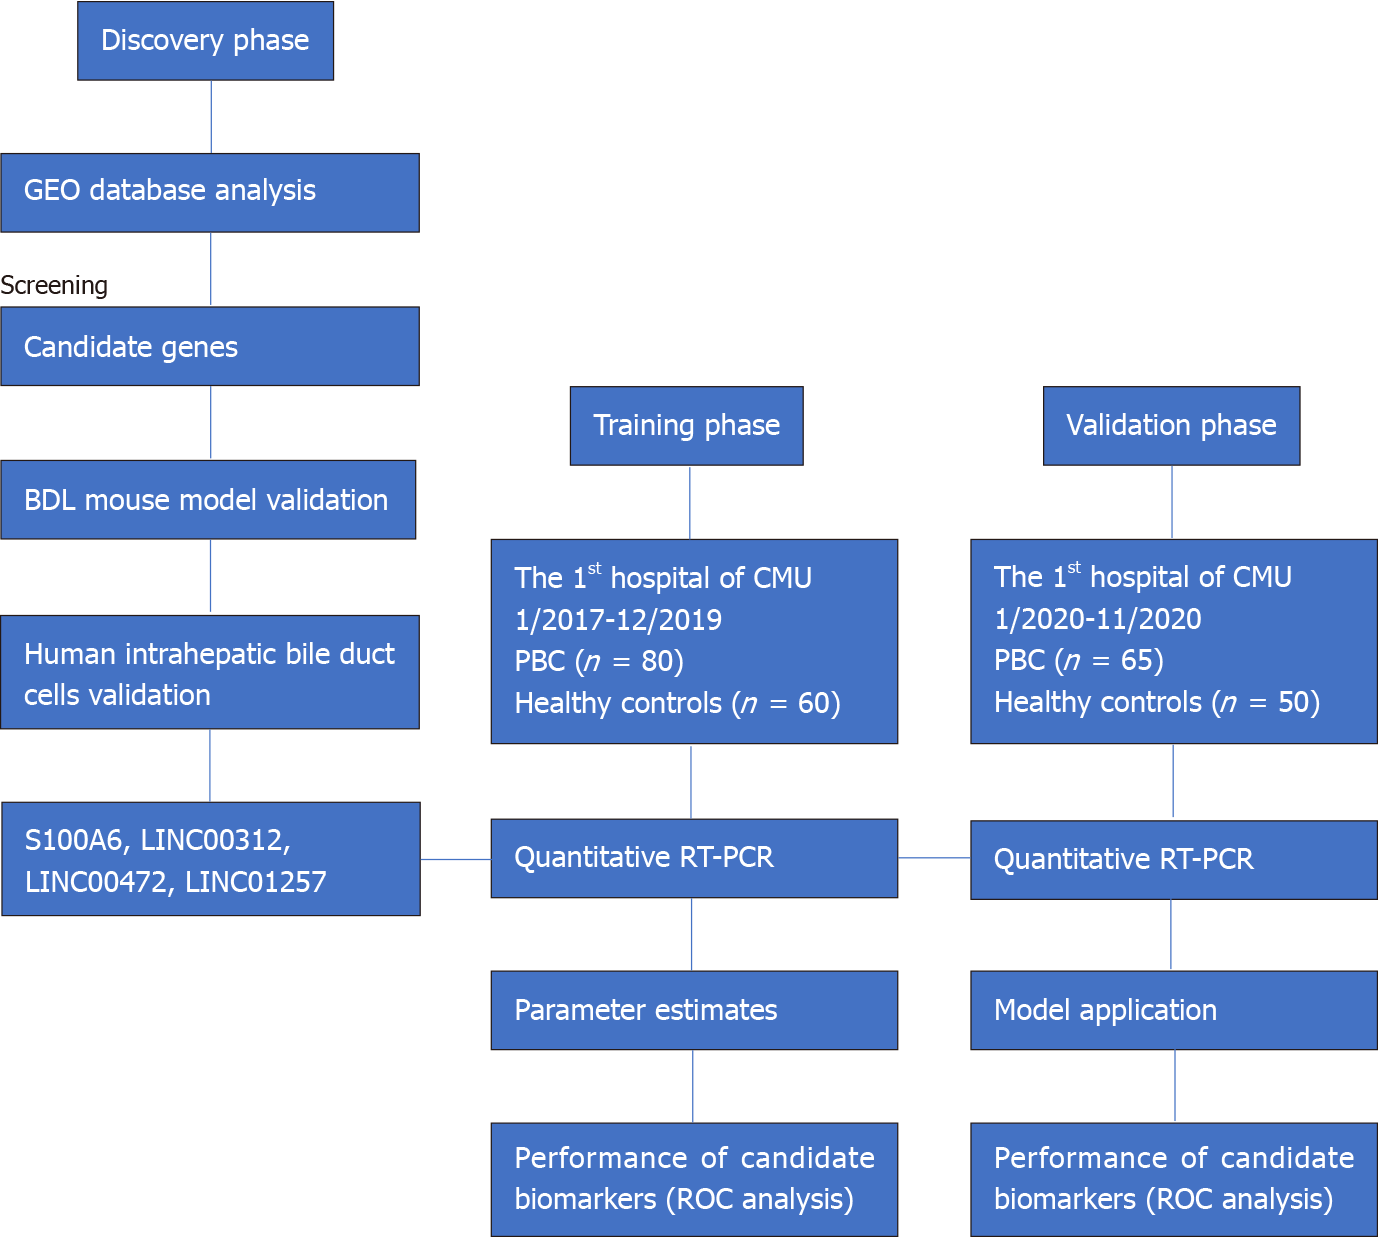
Figure 1 Study design.
BDL: Bile duct ligation; GEO: Gene Expression Omnibus; PBC: Primary biliary cholangitis; ROC: Receiver operating characteristic curve; RT-PCR: Reverse transcriptase polymerase chain reaction.
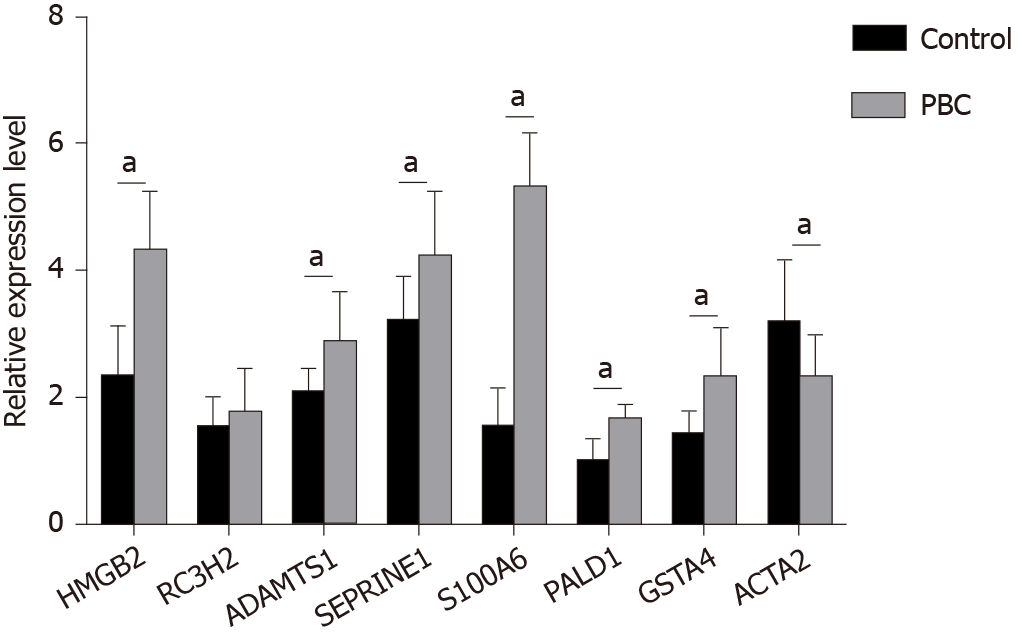
Figure 2 Validation of top 10 up-regulated genes in the plasma of primary biliary cholangitis patients and healthy controls by reverse transcriptase polymerase chain reaction.
aP < 0.0001. ACTA2: Actin alpha 2, smooth muscle; ADAMTS1: ADAM metallopeptidase with thrombospondin type 1 motif 1; GSTA4: Glutathione S-transferase alpha 4; HMGB2: High mobility group box 2; PALD1: Phosphatase domain containing paladin 1; RC3H2: Ring finger and CCCH-type domains 2; S100A6: S100 calcium binding protein A6; SERPINE1: Serpin family E member 1; PBC: Primary biliary cholangitis.
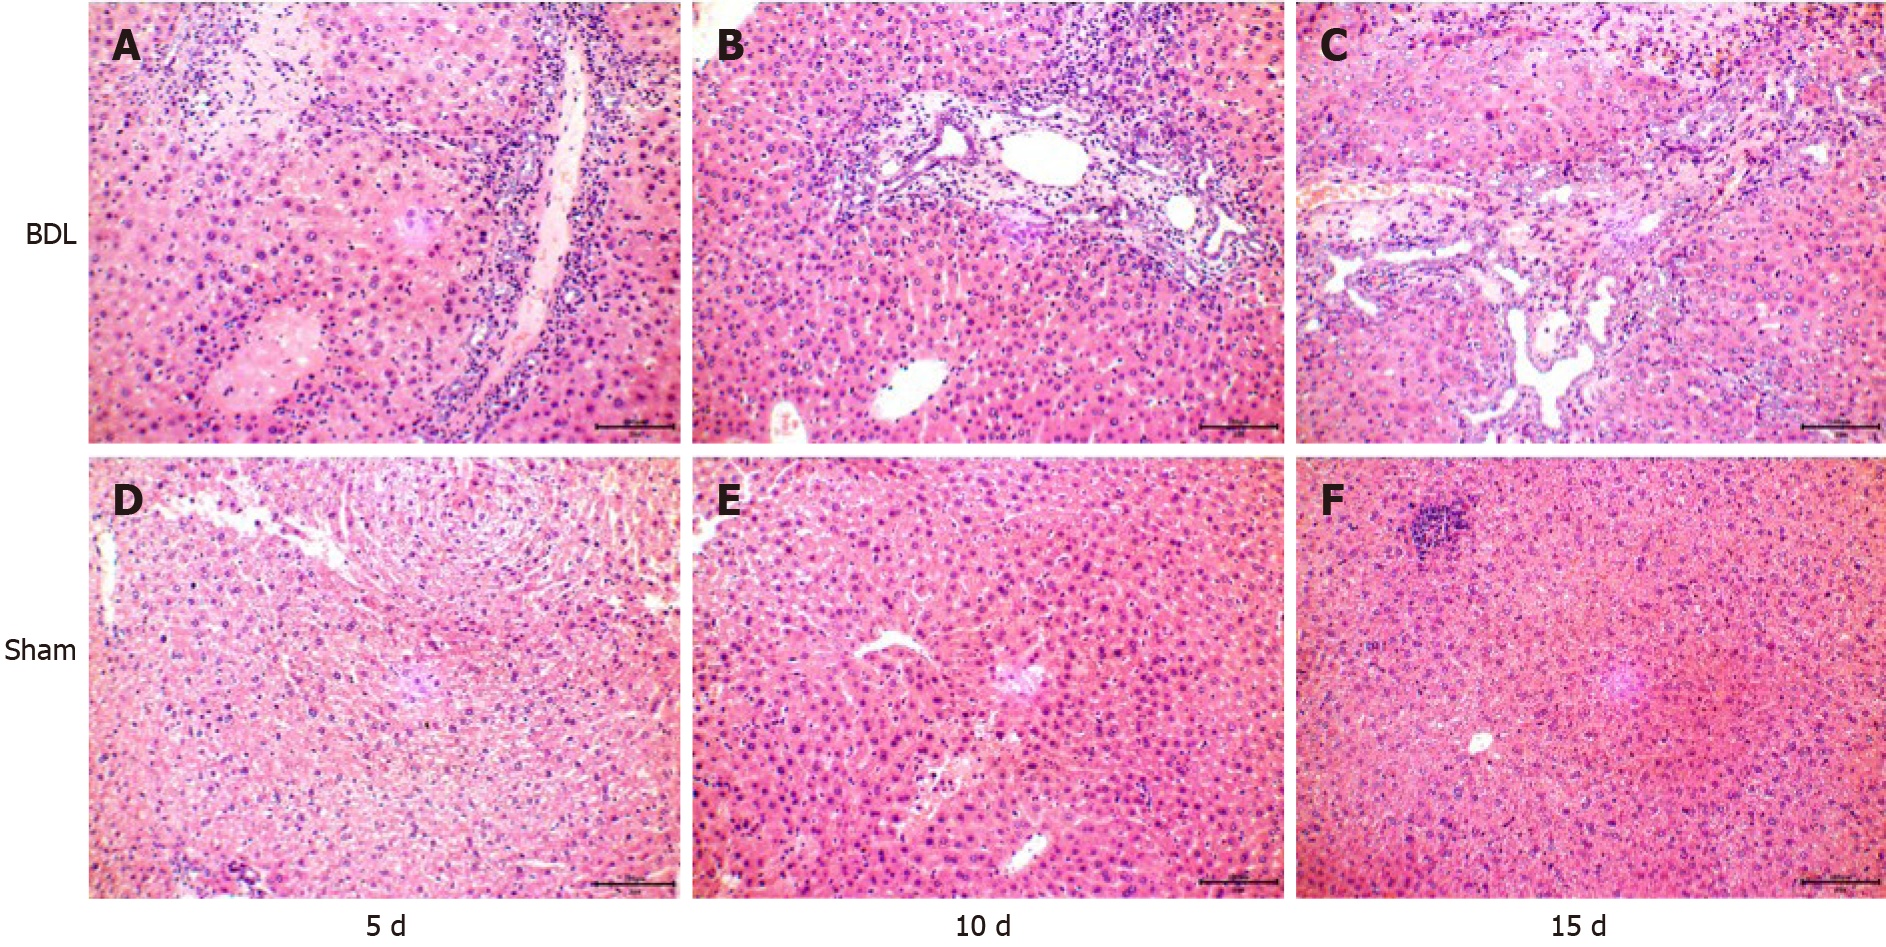
Figure 3 Liver tissues of mice in the bile duct ligation group and sham group were observed under an optical microscope (hematoxylin-eosin stain, × 400).
A-C: 5, 10 and 15 d after surgery in the bile duct ligation group, respectively; D-F: 5, 10 and 15 d after surgery in the sham group, respectively. BDL: Bile duct ligation.
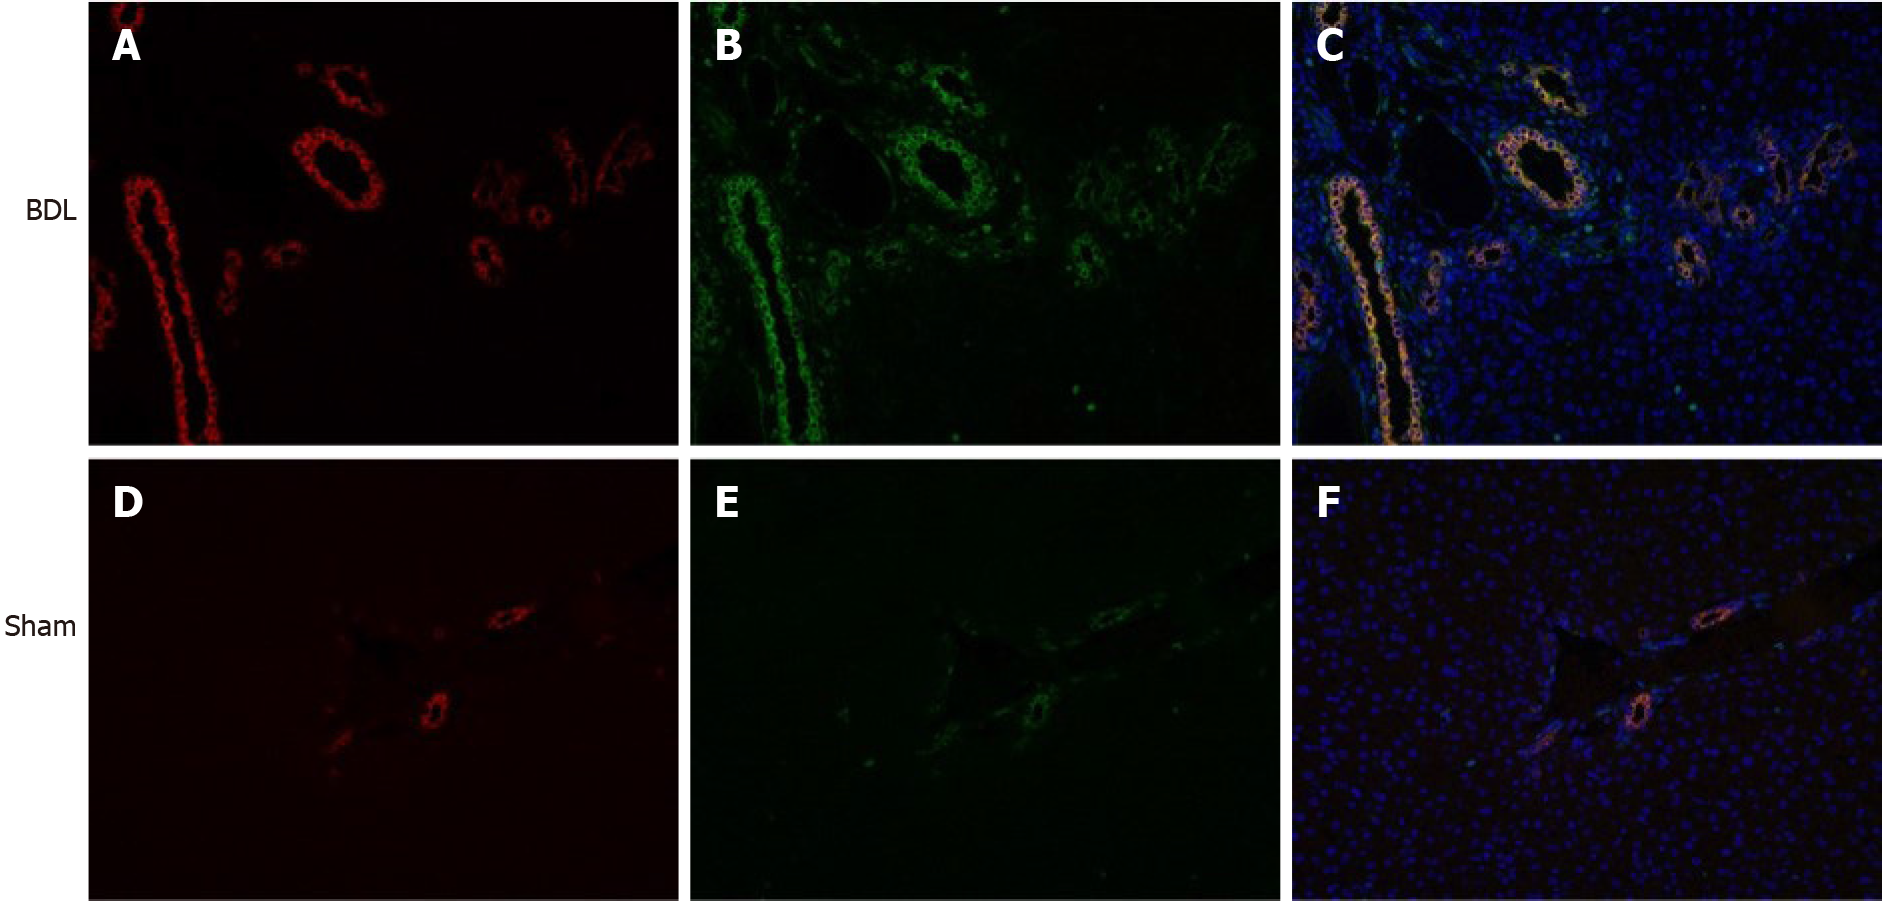
Figure 4 C57BL/6J mouse liver tissue double immunofluorescence (red light: Cytokeratin 19 protein, green light: S100 calcium binding protein A6 protein, × 200).
A: Cytokeratin 19 (CK19) protein in bile duct ligation (BDL) mouse; B: S100 calcium binding protein A6 protein (S100A6) protein in BDL mouse; C: CK19 and S100A6 proteins merge in BDL mouse; D: CK19 protein in sham mouse; E: S100A6 protein in sham mouse; F: CK19 and S100A6 proteins merge in sham mouse. BDL: Bile duct ligation.
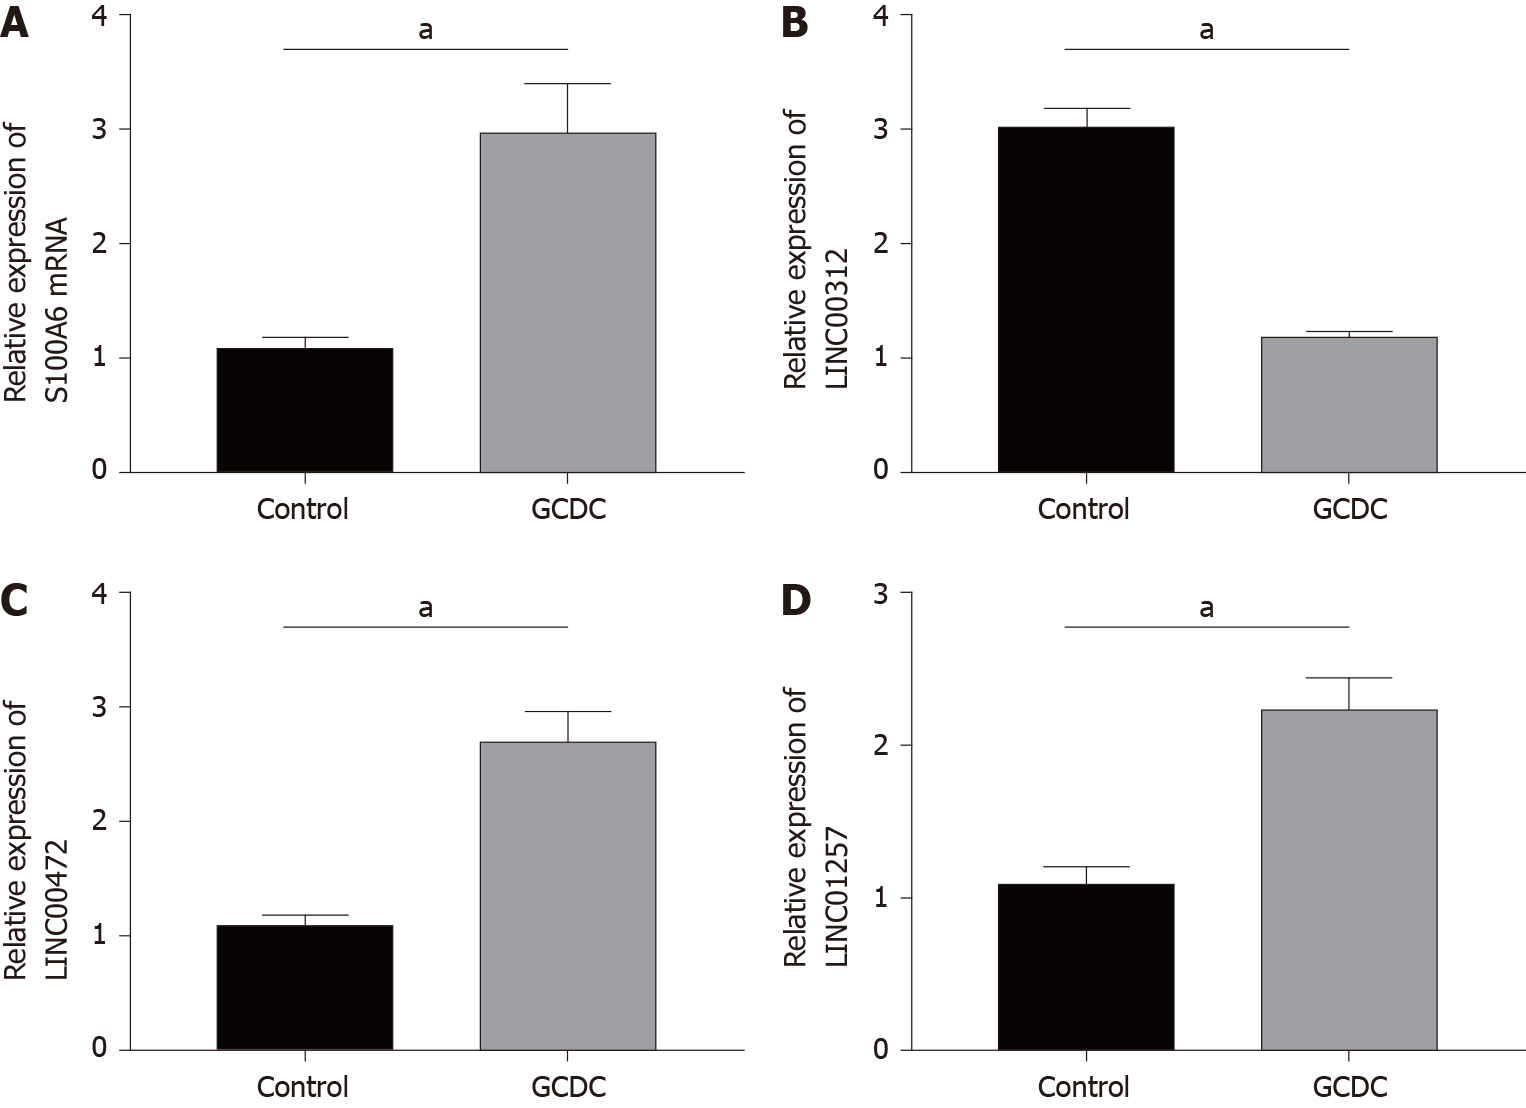
Figure 5 The expression of S100 calcium binding protein A6 protein messenger ribonucleic acid, LINC00312, LINC00472 and LINC01257 in human intrahepatic biliary epithelial cells (control and treated with glycochenodeoxycholate) analyzed by quantitative reverse transcription-polymerase chain reaction.
A: S100 calcium binding protein A6 protein messenger ribonucleic acid; B: LINC00312; C: LINC00472; D: LINC01257. aP < 0.005. GCDC: Glycochenodeoxycholate.
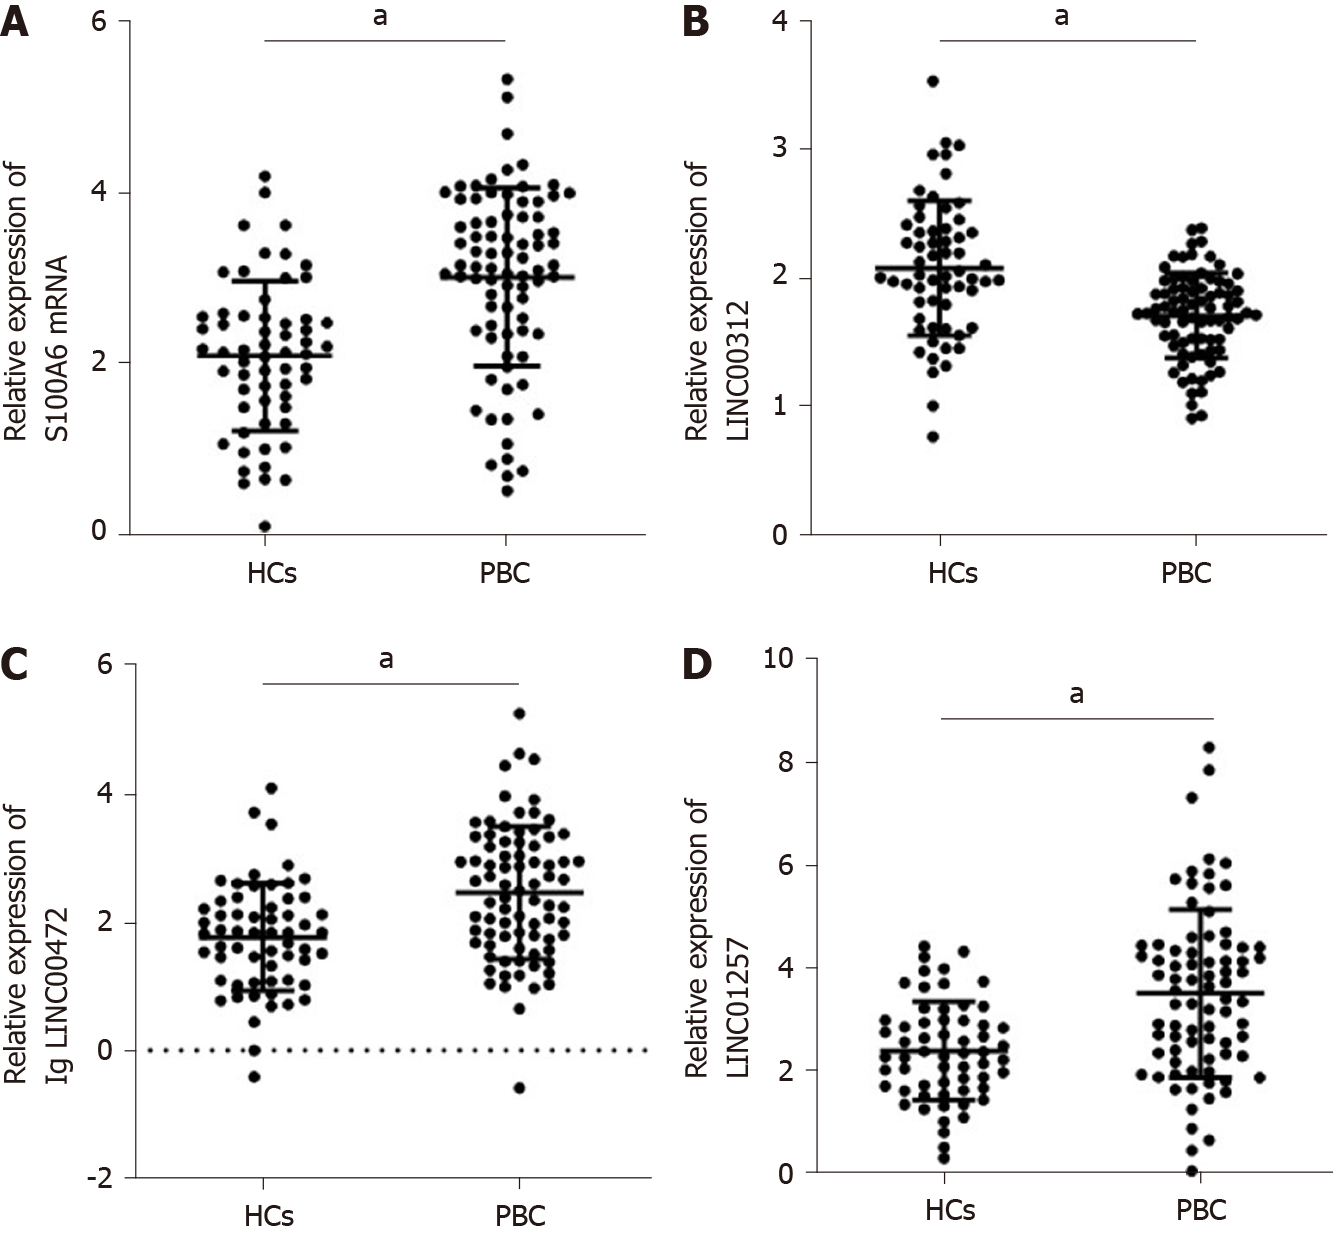
Figure 6 Differential expression of plasma s100 calcium binding protein A6 protein messenger ribonucleic acid and long non-coding ribonucleic acids in primary biliary cholangitis plasma samples compared with healthy controls.
A: S100 calcium binding protein A6 protein messenger ribonucleic acid; B: LINC00312; C: log10 LINC00472; D: LINC01257. aP < 0.0001. HCs: Healthy controls; PBC: Primary biliary cholangitis.
Figure 7 Scatter plot and distribution of expression levels of s100 calcium binding protein A6 protein messenger ribonucleic acid and long non-coding ribonucleic acids in different stages of primary biliary cholangitis compared with healthy controls.
The unpaired t-test analysis of variance was performed to examine differences in S100 calcium binding protein A6 protein messenger ribonucleic acid and long non-coding ribonucleic acids expression levels between various groups. A: S100 calcium binding protein A6 protein messenger ribonucleic acid; B: LINC00312; C: log10 LINC00472; D: LINC01257. aP < 0.05, bP < 0.0001. HCs: Healthy controls.
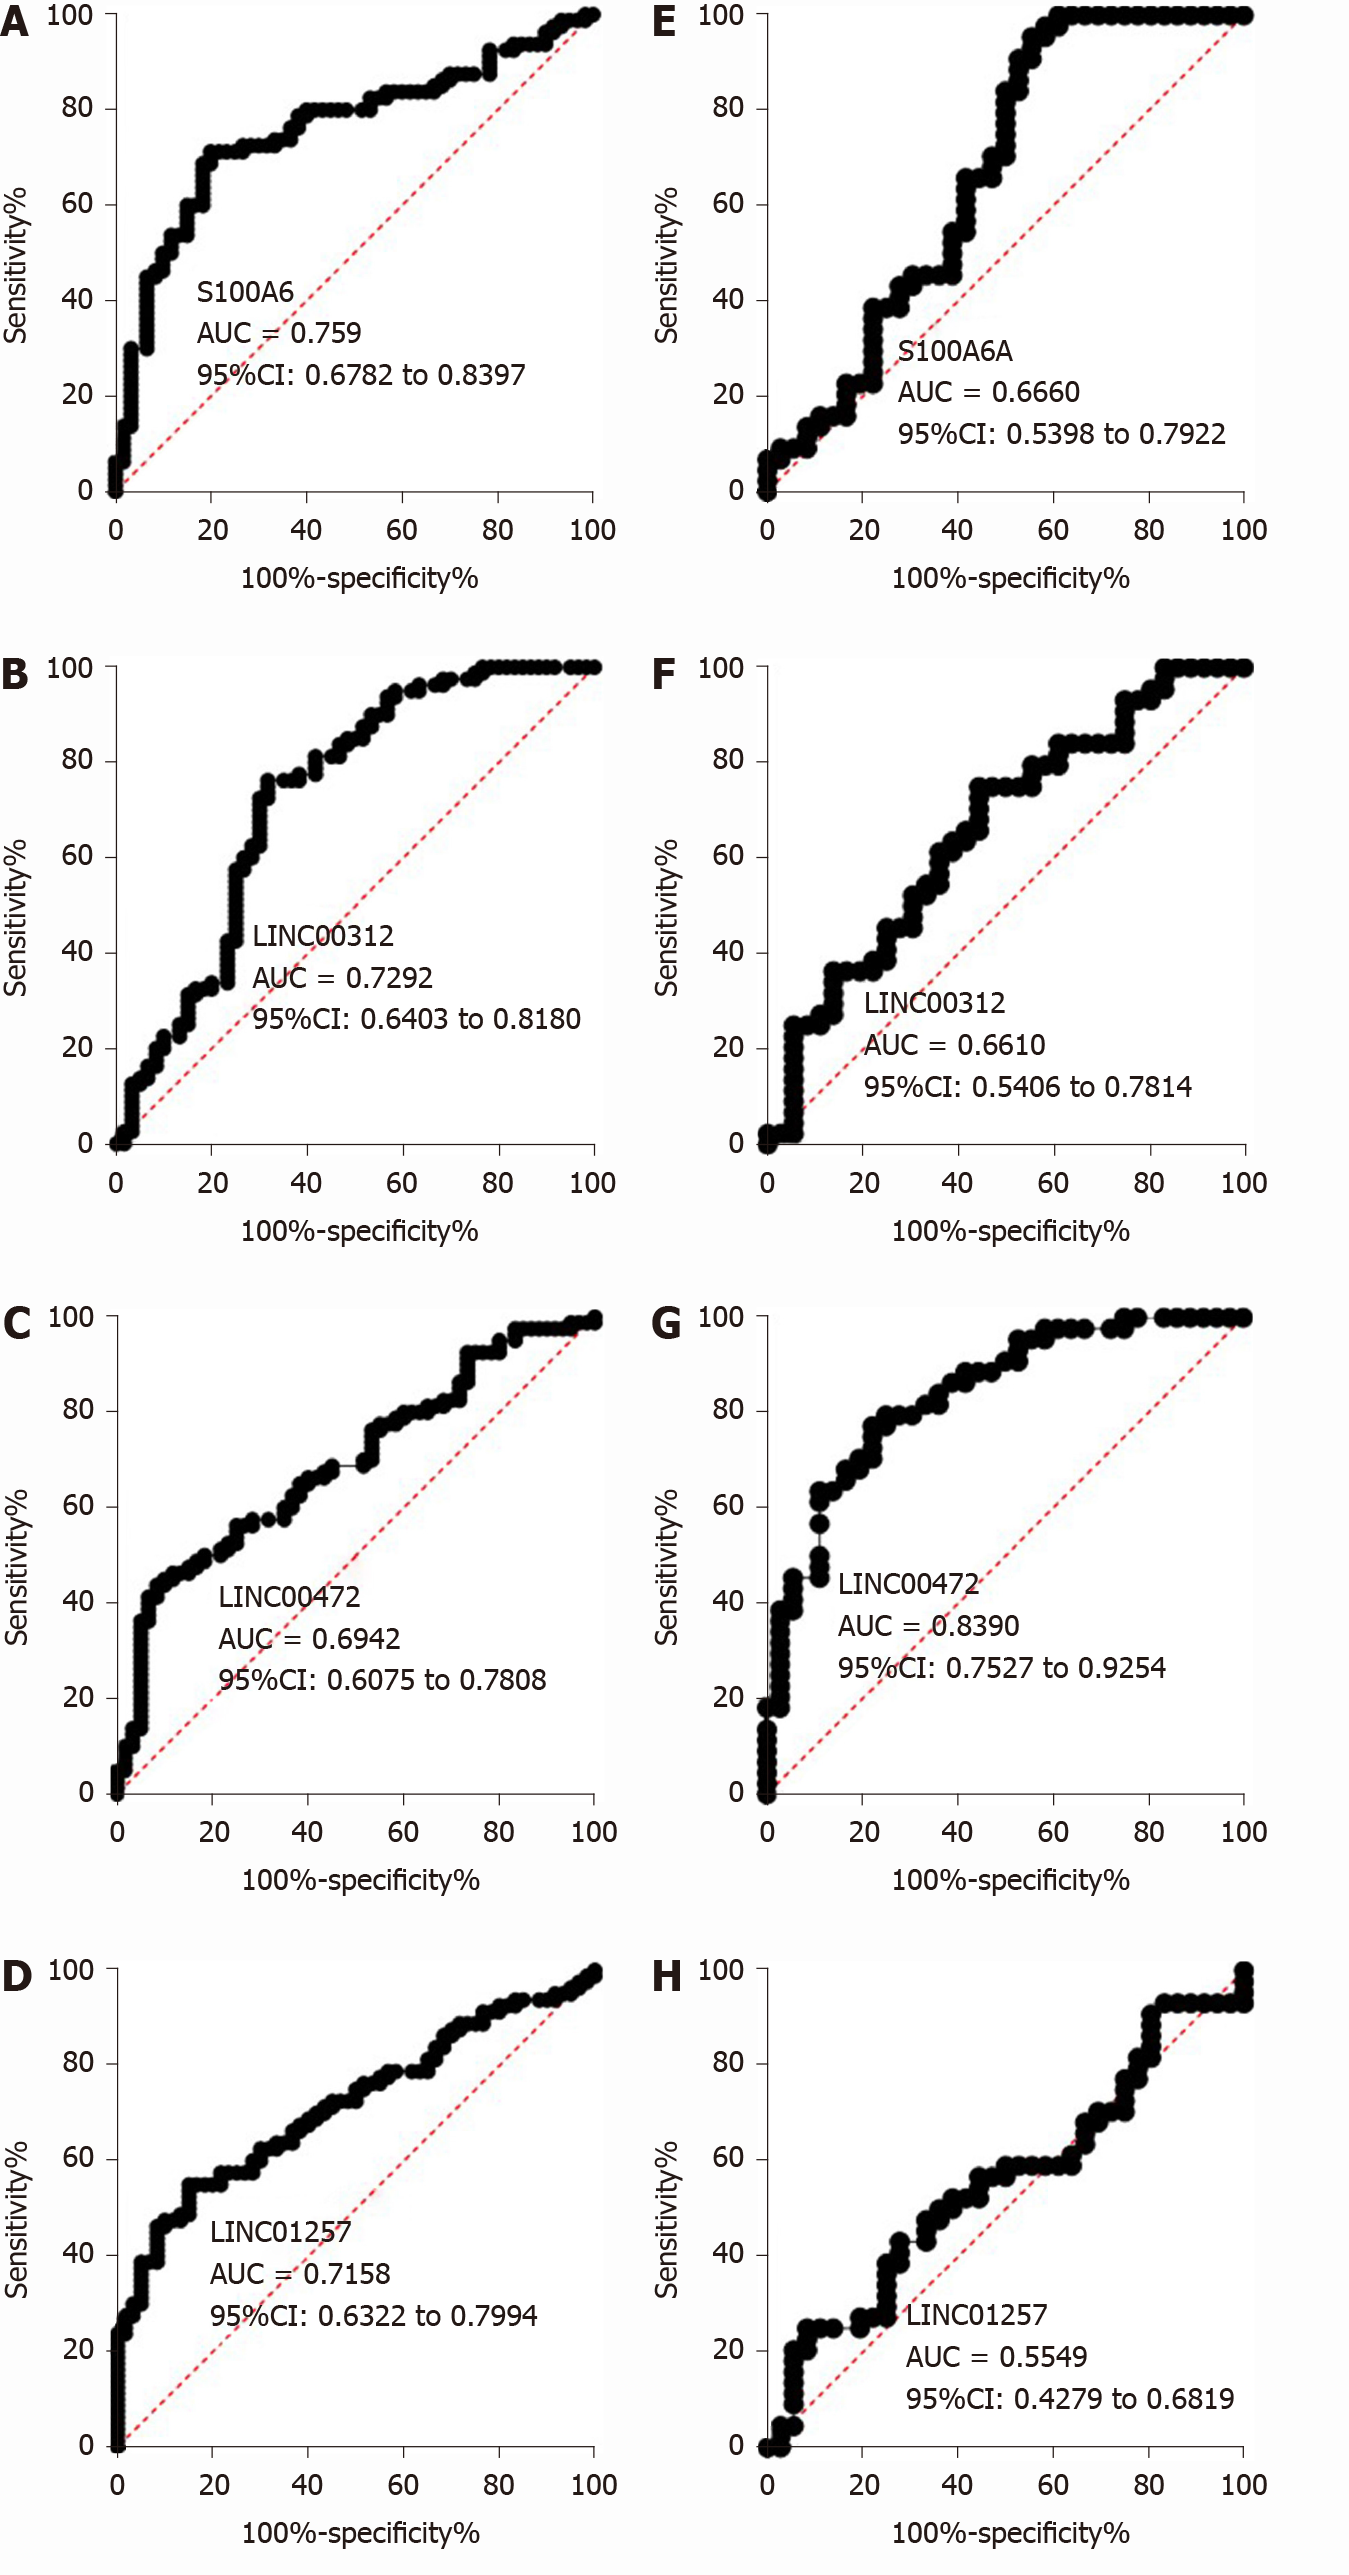
Figure 8 Receiver operating characteristic curves of s100 calcium binding protein A6 protein, LINC00312, LINC00472 and LINC01257 for primary biliary cholangitis diagnosis and staging in the training set.
A-D: Receiver operating characteristic curves of s100 calcium binding protein A6 protein, LINC00312, LINC00472 and LINC01257 for primary biliary cholangitis diagnosis in the training set; E-H: Receiver operating characteristic curves of s100 calcium binding protein A6 protein, LINC00312, LINC00472 and LINC01257 for primary biliary cholangitis staging in the training set. AUC: Area under the curve; CI: Confidence interval.
Figure 9 Correlation analysis of biomarkers and clinical serological indices.
A: The positive correlation between relative expression of s100 calcium binding protein A6 protein messenger ribonucleic acid and log10 LINC00472, r = 0.683, P < 0.0001; B: The positive correlation between relative expression of log10 LINC00472 and serum level of collagen type IV, r = 0.482, P < 0.0001; C: The positive correlation between serum level of collagen type IV and relative expression of s100 calcium binding protein A6 protein messenger ribonucleic acid, r = 0.732, P < 0.0001.
Figure 10 Comparison and analysis of s100 calcium binding protein A6 protein messenger ribonucleic acid, LINC00312, log10 LINC00472, LINC01257 expression levels in primary biliary cholangitis patients before and after treatment using the paired t-test.
A: S100 calcium binding protein A6 protein messenger ribonucleic acid; B: LINC00312; C: log10 LINC00472; D: LINC01257.
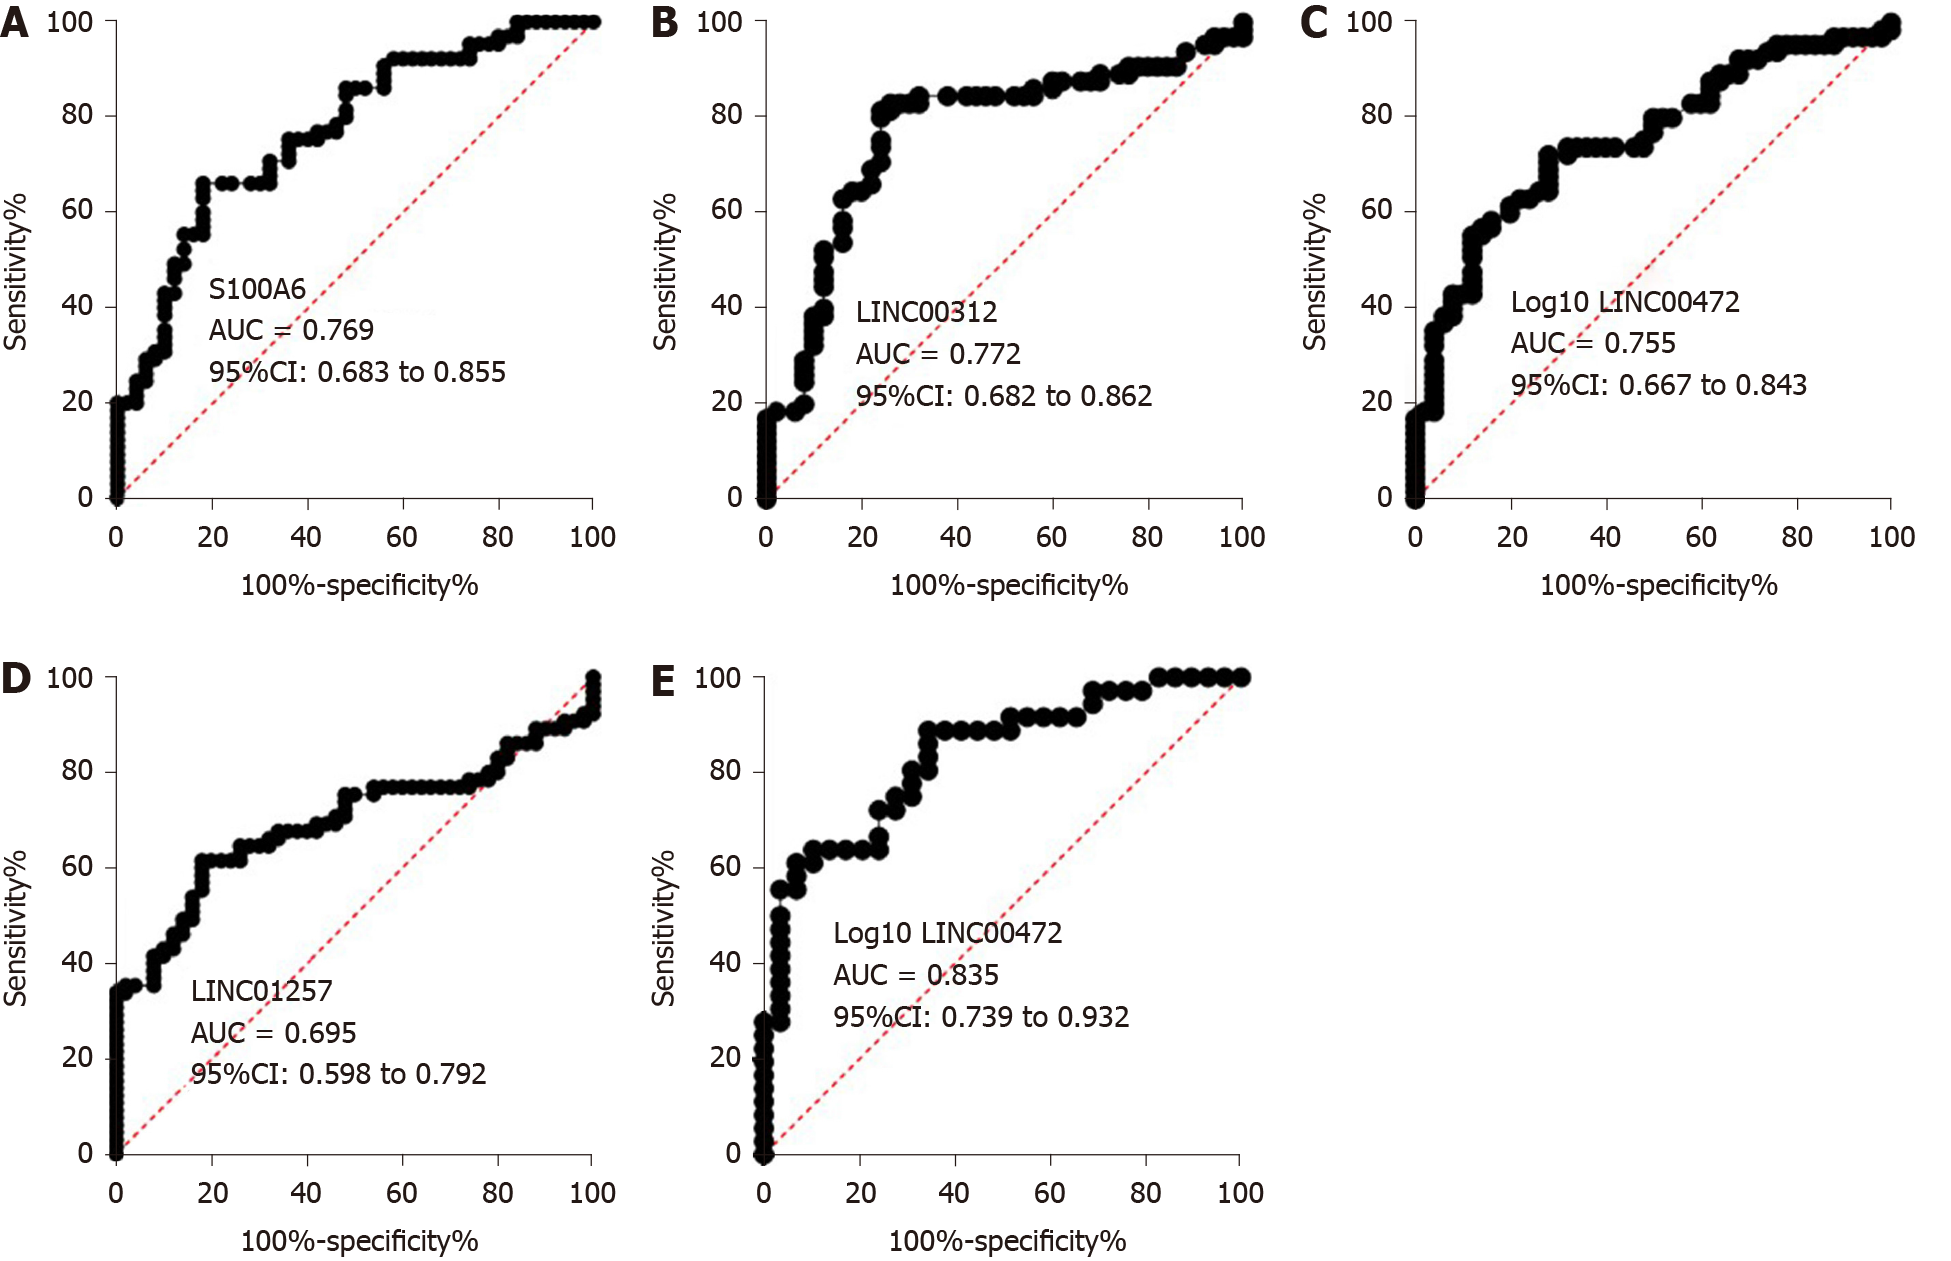
Figure 11 Receiver operating characteristic curves of s100 calcium binding protein A6 protein, LINC00312, LINC00472 and LINC01257 for primary biliary cholangitis diagnosis and staging in the validation set.
A-D: Receiver operating characteristic curves of s100 calcium binding protein A6 protein, LINC00312, LINC00472 and LINC01257 for primary biliary cholangitis diagnosis in the validation set; E: Receiver operating characteristic curves of LINC00472 for primary biliary cholangitis staging in the validation set. AUC: Area under the curve; CI: Confidence interval.
- Citation: Dong XH, Dai D, Yang ZD, Yu XO, Li H, Kang H. S100 calcium binding protein A6 and associated long noncoding ribonucleic acids as biomarkers in the diagnosis and staging of primary biliary cholangitis. World J Gastroenterol 2021; 27(17): 1973-1992
- URL: https://www.wjgnet.com/1007-9327/full/v27/i17/1973.htm
- DOI: https://dx.doi.org/10.3748/wjg.v27.i17.1973


