Copyright
©The Author(s) 2021.
World J Gastroenterol. Apr 21, 2021; 27(15): 1616-1629
Published online Apr 21, 2021. doi: 10.3748/wjg.v27.i15.1616
Published online Apr 21, 2021. doi: 10.3748/wjg.v27.i15.1616
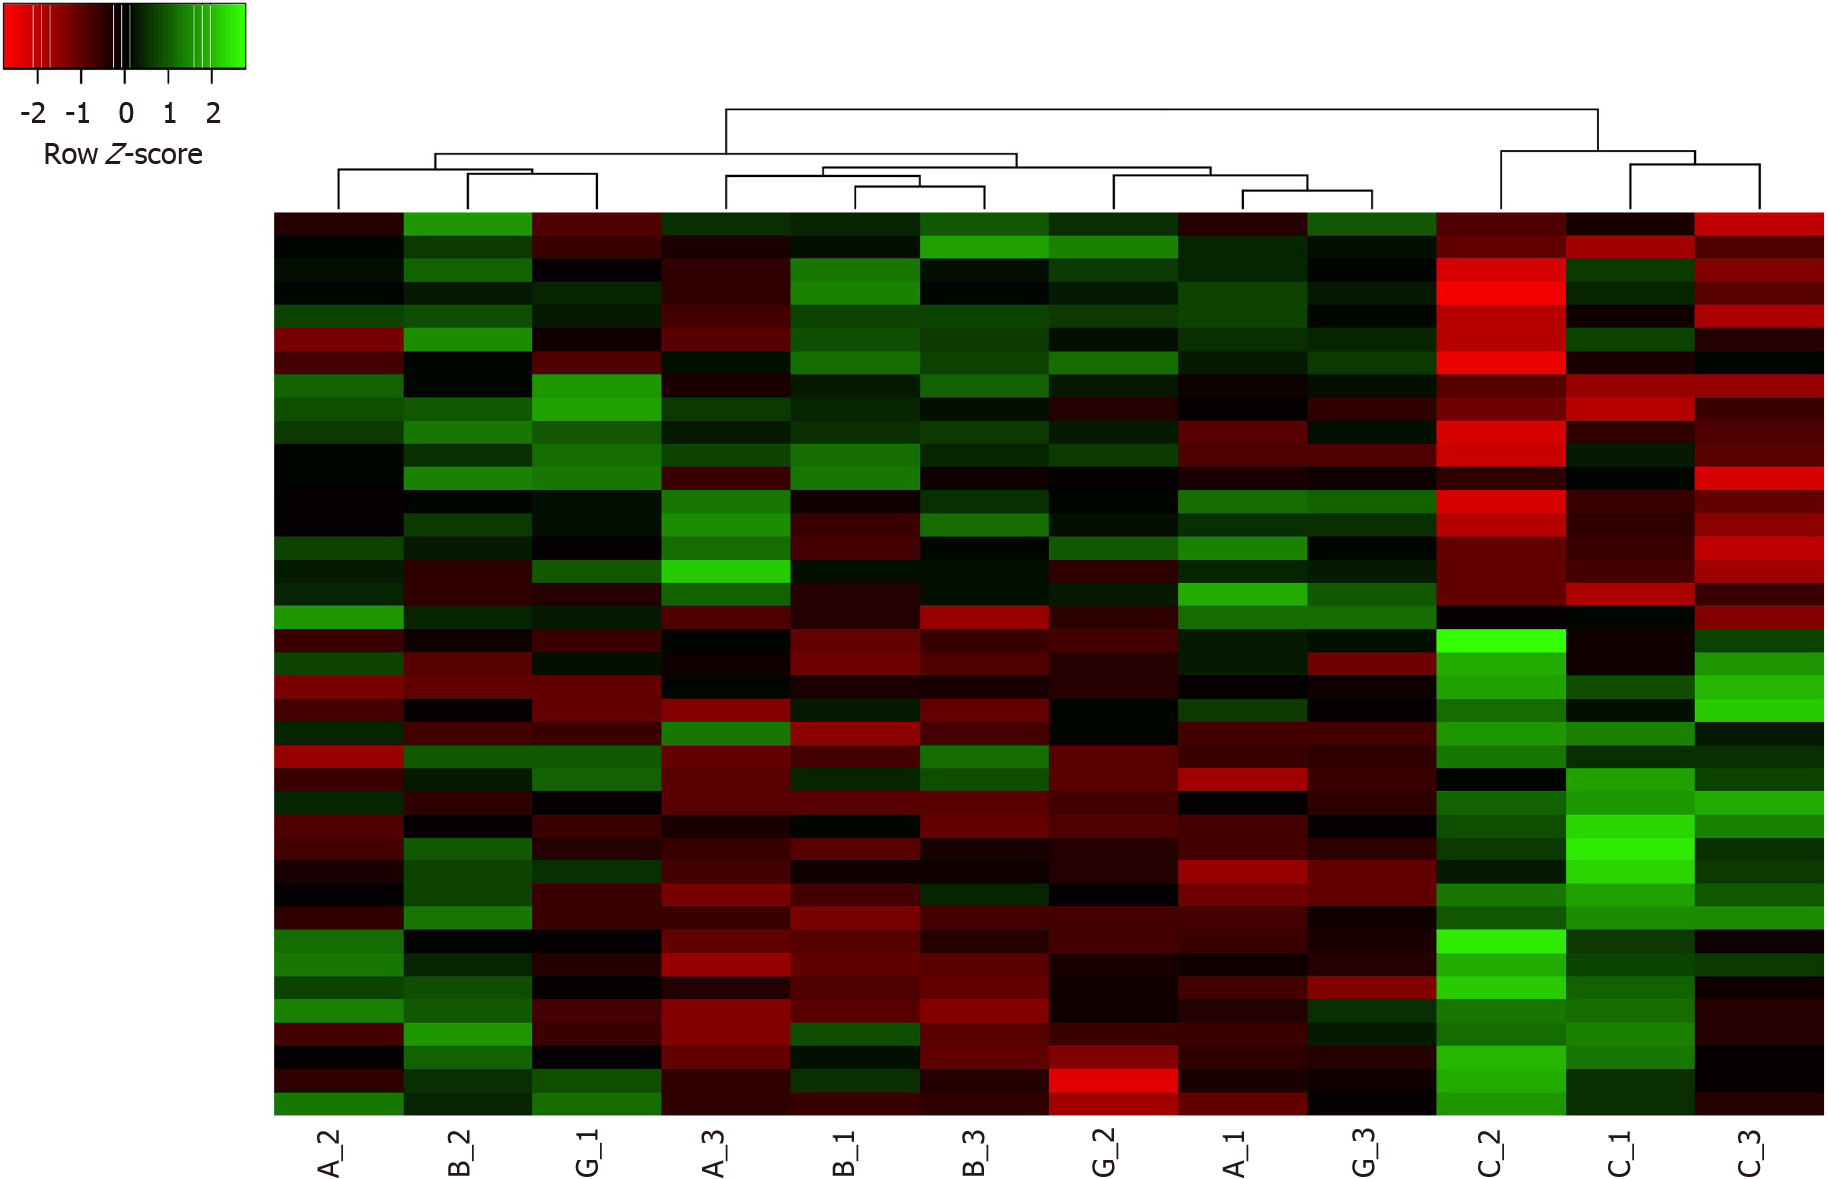
Figure 1 Hierarchical cluster heatmap of treated (α, β and γ isoforms) and control (C1, C2, C3) samples based on the obtained differentially expressed genes.
Distance measurement method: Pearson; Clustering method: Average linkage.
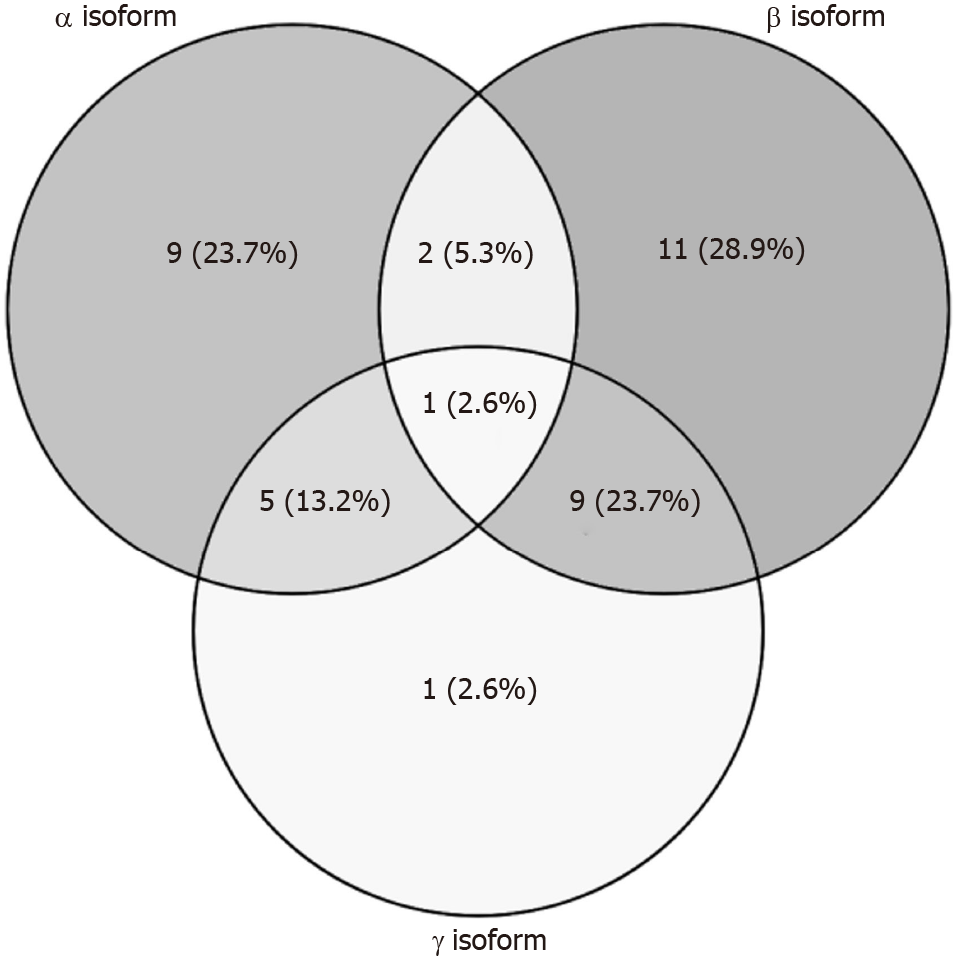
Figure 2 Comparison of the number of differentially expressed genes in all treatment conditions (α, β and γ CXCL12 isoforms) in hTERT-HPNE cells.
Differentially expressed genes were detected using an FDR-corrected P value threshold of P < 0.05.
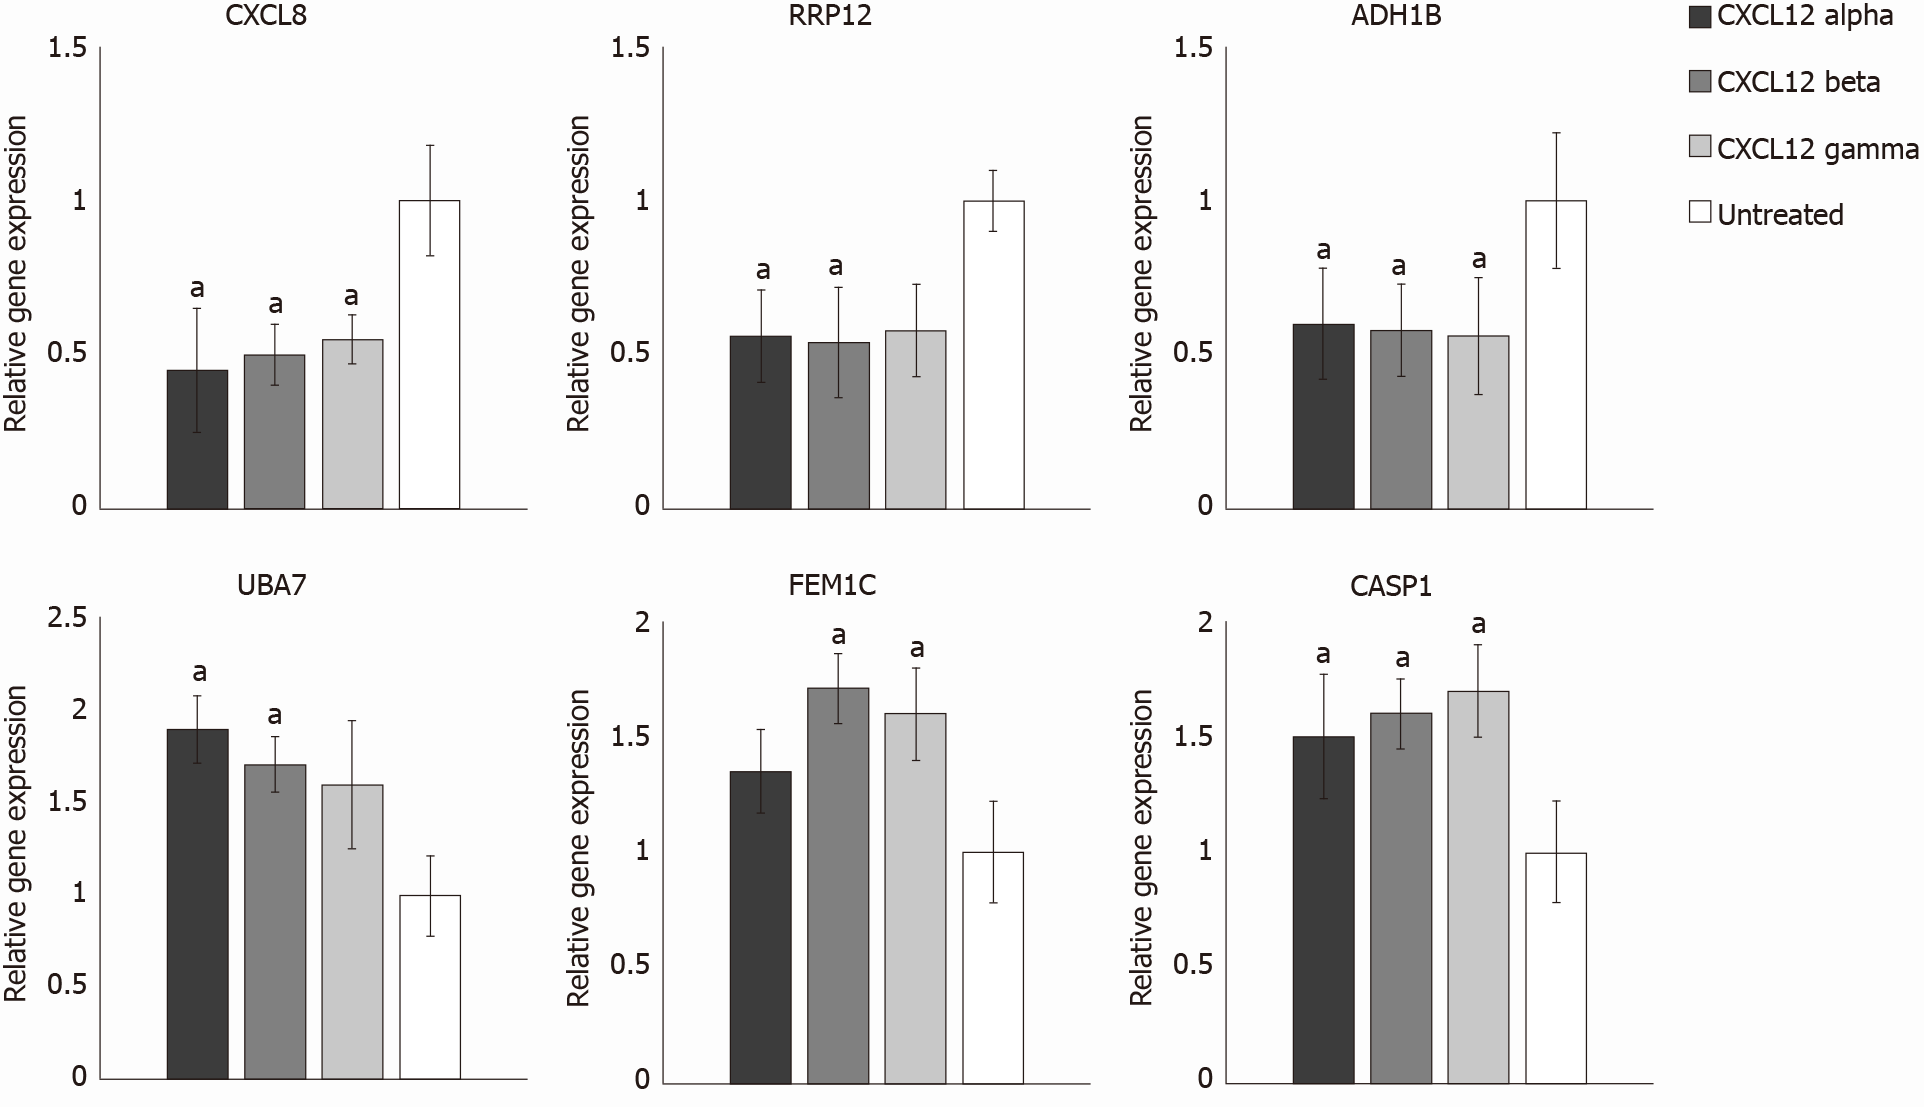
Figure 3 Real-Time polymerase chain reaction analysis of differentially expressed genes.
Expression levels of CXCL8, RRP12, ADH1B, UBA7, FEM1C, and CASP1 in treated and untreated hTERT-HPNE cells. All values are expressed as the mean ± SD. Values were considered to be significantly different respect to the control at aP < 0.05.
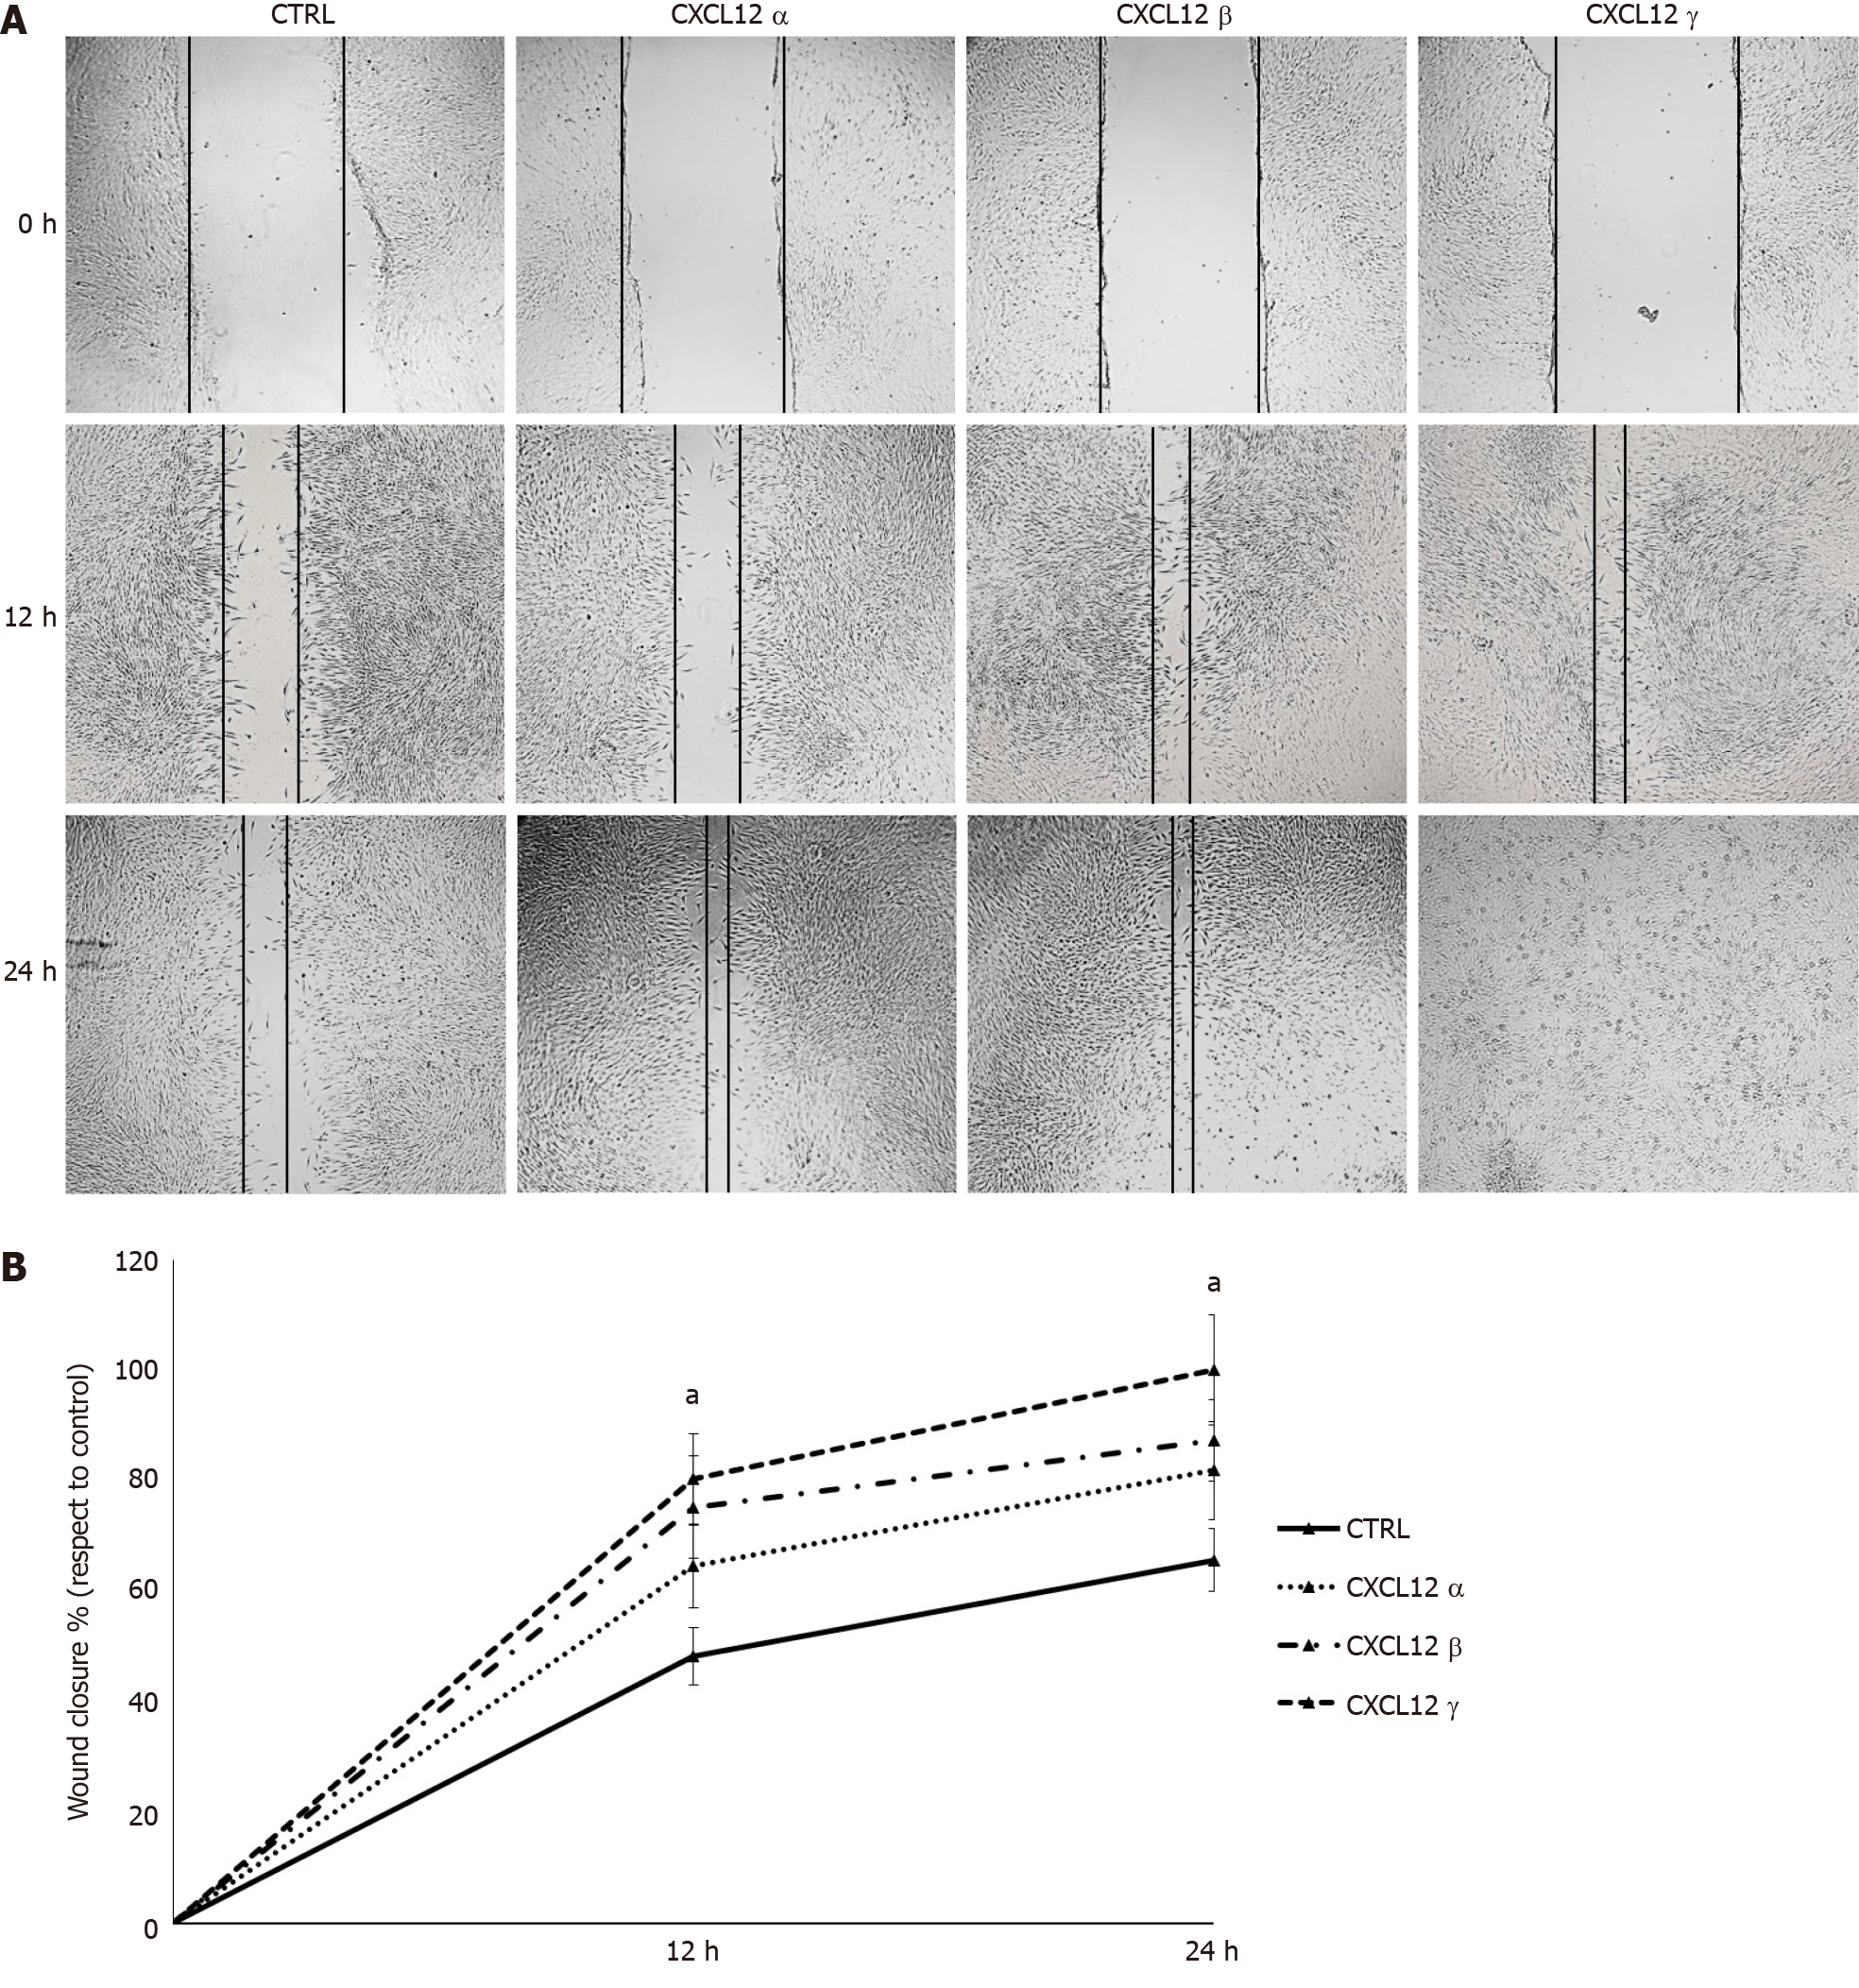
Figure 4 Migration ability of hTERT-HPNE cells.
Wound healing assay was used to assess the effect of CXCL12 isoform treatments on cell migration. A: The cells were photographed immediately (0 h) after wounding by a pipette tip and at different time points (12 h and 24 h); B: The migration ability of the treated cells was evaluated by measuring their efficiency in wound repair compared with that of the control. All values are expressed as the mean ± SD. Values were considered to be significantly different respect to the control at aP < 0.05.
- Citation: Cecati M, Giulietti M, Righetti A, Sabanovic B, Piva F. Effects of CXCL12 isoforms in a pancreatic pre-tumour cellular model: Microarray analysis. World J Gastroenterol 2021; 27(15): 1616-1629
- URL: https://www.wjgnet.com/1007-9327/full/v27/i15/1616.htm
- DOI: https://dx.doi.org/10.3748/wjg.v27.i15.1616


