Copyright
©The Author(s) 2021.
World J Gastroenterol. Apr 21, 2021; 27(15): 1595-1615
Published online Apr 21, 2021. doi: 10.3748/wjg.v27.i15.1595
Published online Apr 21, 2021. doi: 10.3748/wjg.v27.i15.1595
Figure 1 Diagram of Abelson interactor 1 isoforms and polymerase chain reaction primers used to measure expression levels of Abelson interactor 1.
A: Schematic comparison of the exons and functional domains of two major isoforms of Abelson interactor 1 (ABL1): ABL1 splice isoform L (ABI1-SiL) and ABL1 splice isoform A (ABI1-p65). ABI1-SiL has conserved WAVE2-binding and SH3 domains, but lacks the homeo-domain homologous region and the majority of the PxxP- and Pro-rich domain; B: Schematic showing locations of ABI1 universal 1 (ABI1-U1)-, ABI1 universal 2 (ABI1-U2)-, and ABI1-SiL-specific primers. Primers were selected to target exon 3, as it represents a major structural difference between ABI1-SiL and other ABI1 variants. Three sets of primers were designed to analyze the expression of ABI1-SiL in colorectal carcinoma cells and tissues. Transcript variant 12-specific primers were used for qualitative analysis, while transcript variant 1-12 universal (ABI1-U1) and transcript variant 1-11 universal (ABI1-U2) primers were used for quantitative analysis of ABI1-SiL expression. ABI1: Abelson interactor 1; HHR: Homeo-domain homologous region.
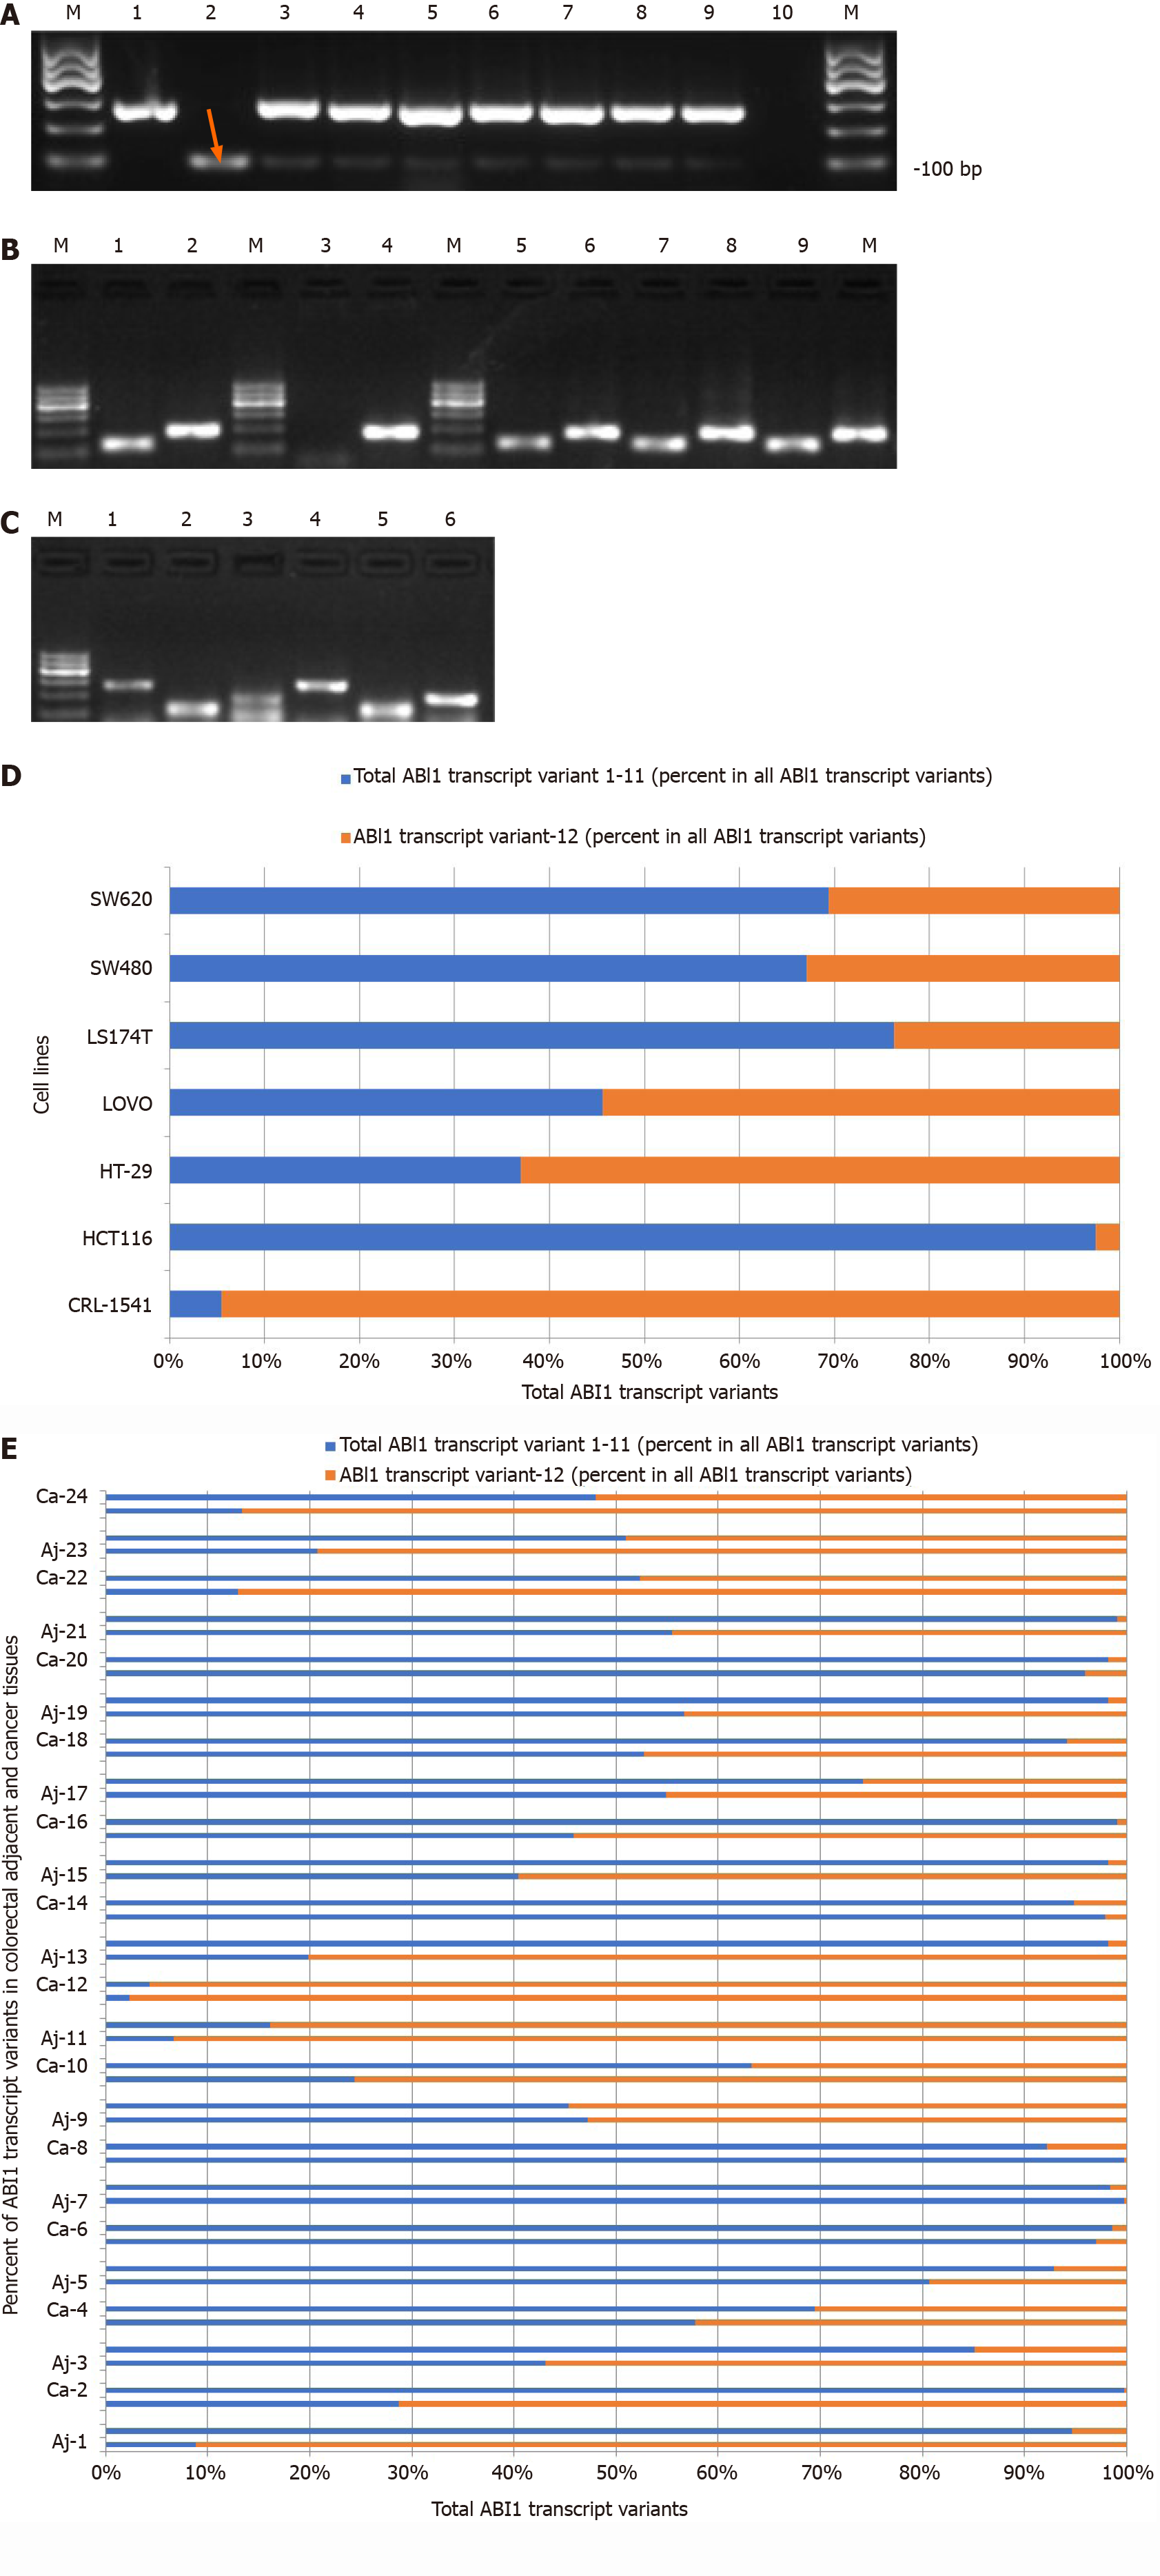
Figure 2 The proportion of Abelson interactor 1 splice isoform-L is significantly decreased in colon cancer tissues and cell lines compared to other Abelson interactor 1 splice isoforms.
A: Expression of endogenous Abelson interactor 1 splice isoform-L (ABI1-SiL) in colorectal carcinoma cells. M, 100 bp DNA Marker; 1, ABI1-Tv1 positive Ctrl (278 bp); 2, ABI1-SiL positive control (101 bp, orange arrow); 3, CRL-1541; 4, HCT-116; 5, HT-29; 6, LoVo; 7, LS174T; 8, SW480; 9, SW620; 10, negative control; B: ABI1-Tv1, ABI1-SiL, or a mixture of ABI1-Tv1 and ABI1-SiL were used as templates to confirm the feasibility of the ABI1-SiL quantitative polymerase chain reaction assay using the ABI1-U2 (lanes 1, 3, 5, 7, and 9) and ABI1-U1 primers (lanes 2, 4, 6, 8, and 10); C: ABI1-U1- (lanes 2 and 5) and ABI1-U2-specific (lanes 3 and 6) polymerase chain reaction products amplified from cDNA from CRL-1541 (lanes 1-3) and HCT116 (lanes 4-6) cells. Lanes 1 and 4 contain GAPDH (glyceraldehyde-3-phosphate dehydrogenase); D: The ratio of ABI1-SiL relative to all other ABI1 isoforms was significantly decreased in colorectal carcinoma cells compared with control CRL-1541 cells; E: The ratio of ABI1-SiL relative to other ABI1 isoforms was significantly decreased in 66.7% (16/24) of all tested colorectal tissues compared with adjacent tissues. M: Maker; ABI1: Abelson interactor 1; Aj: Adjacent; Ca: Cancer.
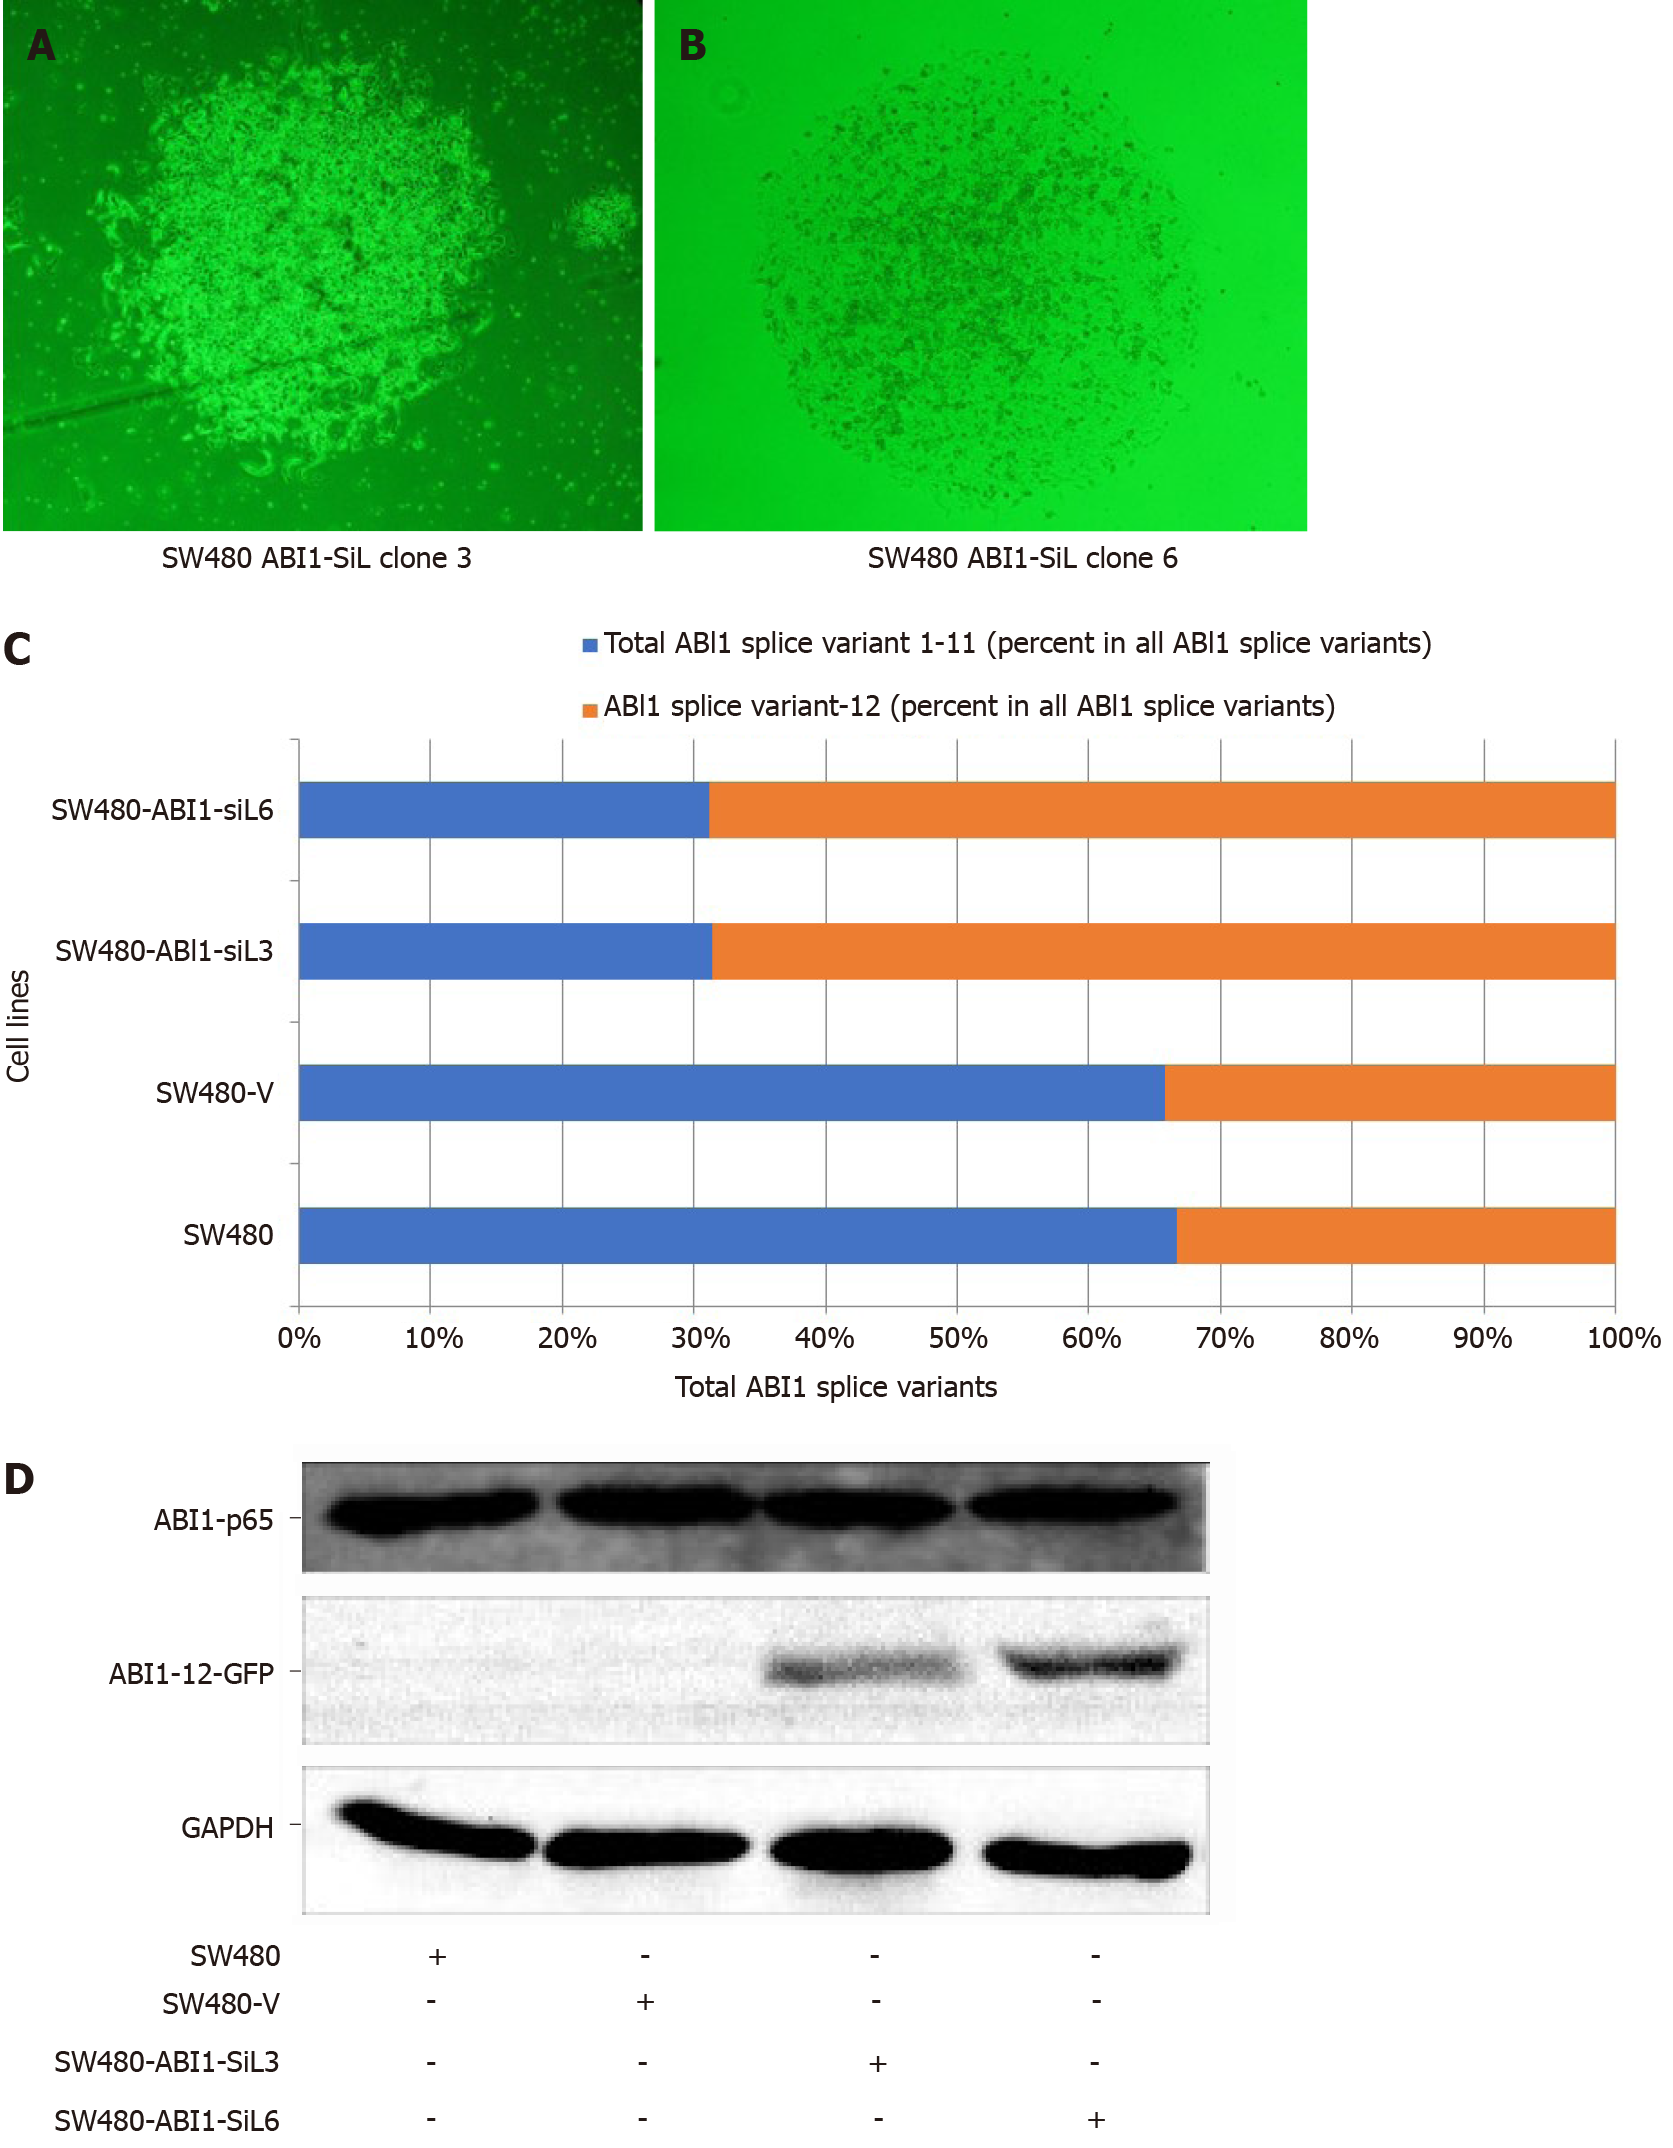
Figure 3 Construction of a human colon cancer SW480 cell model stably overexpressing Abelson interactor 1 splice isoform-L.
A: SW480 clone #3 overexpressing Abelson interactor 1 splice isoform-L (ABI1-SiL); B: SW480 clone #6 overexpressing ABI1-SiL; C: The ratio of ABI1-SiL to all Abelson interactor 1 (ABI1) isoforms was determined by quantitative polymerase chain reaction using ABI1 universal 1 and ABI1 universal 2 primers; D: Western blot demonstrating efficacy of ABI1-SiL overexpression. Lysates from 1 × 10⁶ cells were separated by sodium dodecyl sulfate-polyacrylamide gel electrophoresis and transferred to a nitrocellulose membrane. The membrane was probed with the indicated antibodies. ABI1-SiL: Abelson interactor 1 splice isoform-L; ABI1: Abelson interactor 1; GFP: Green fluorescence protein; GAPDH: Glyceraldehyde-3-phosphate dehydrogenase.
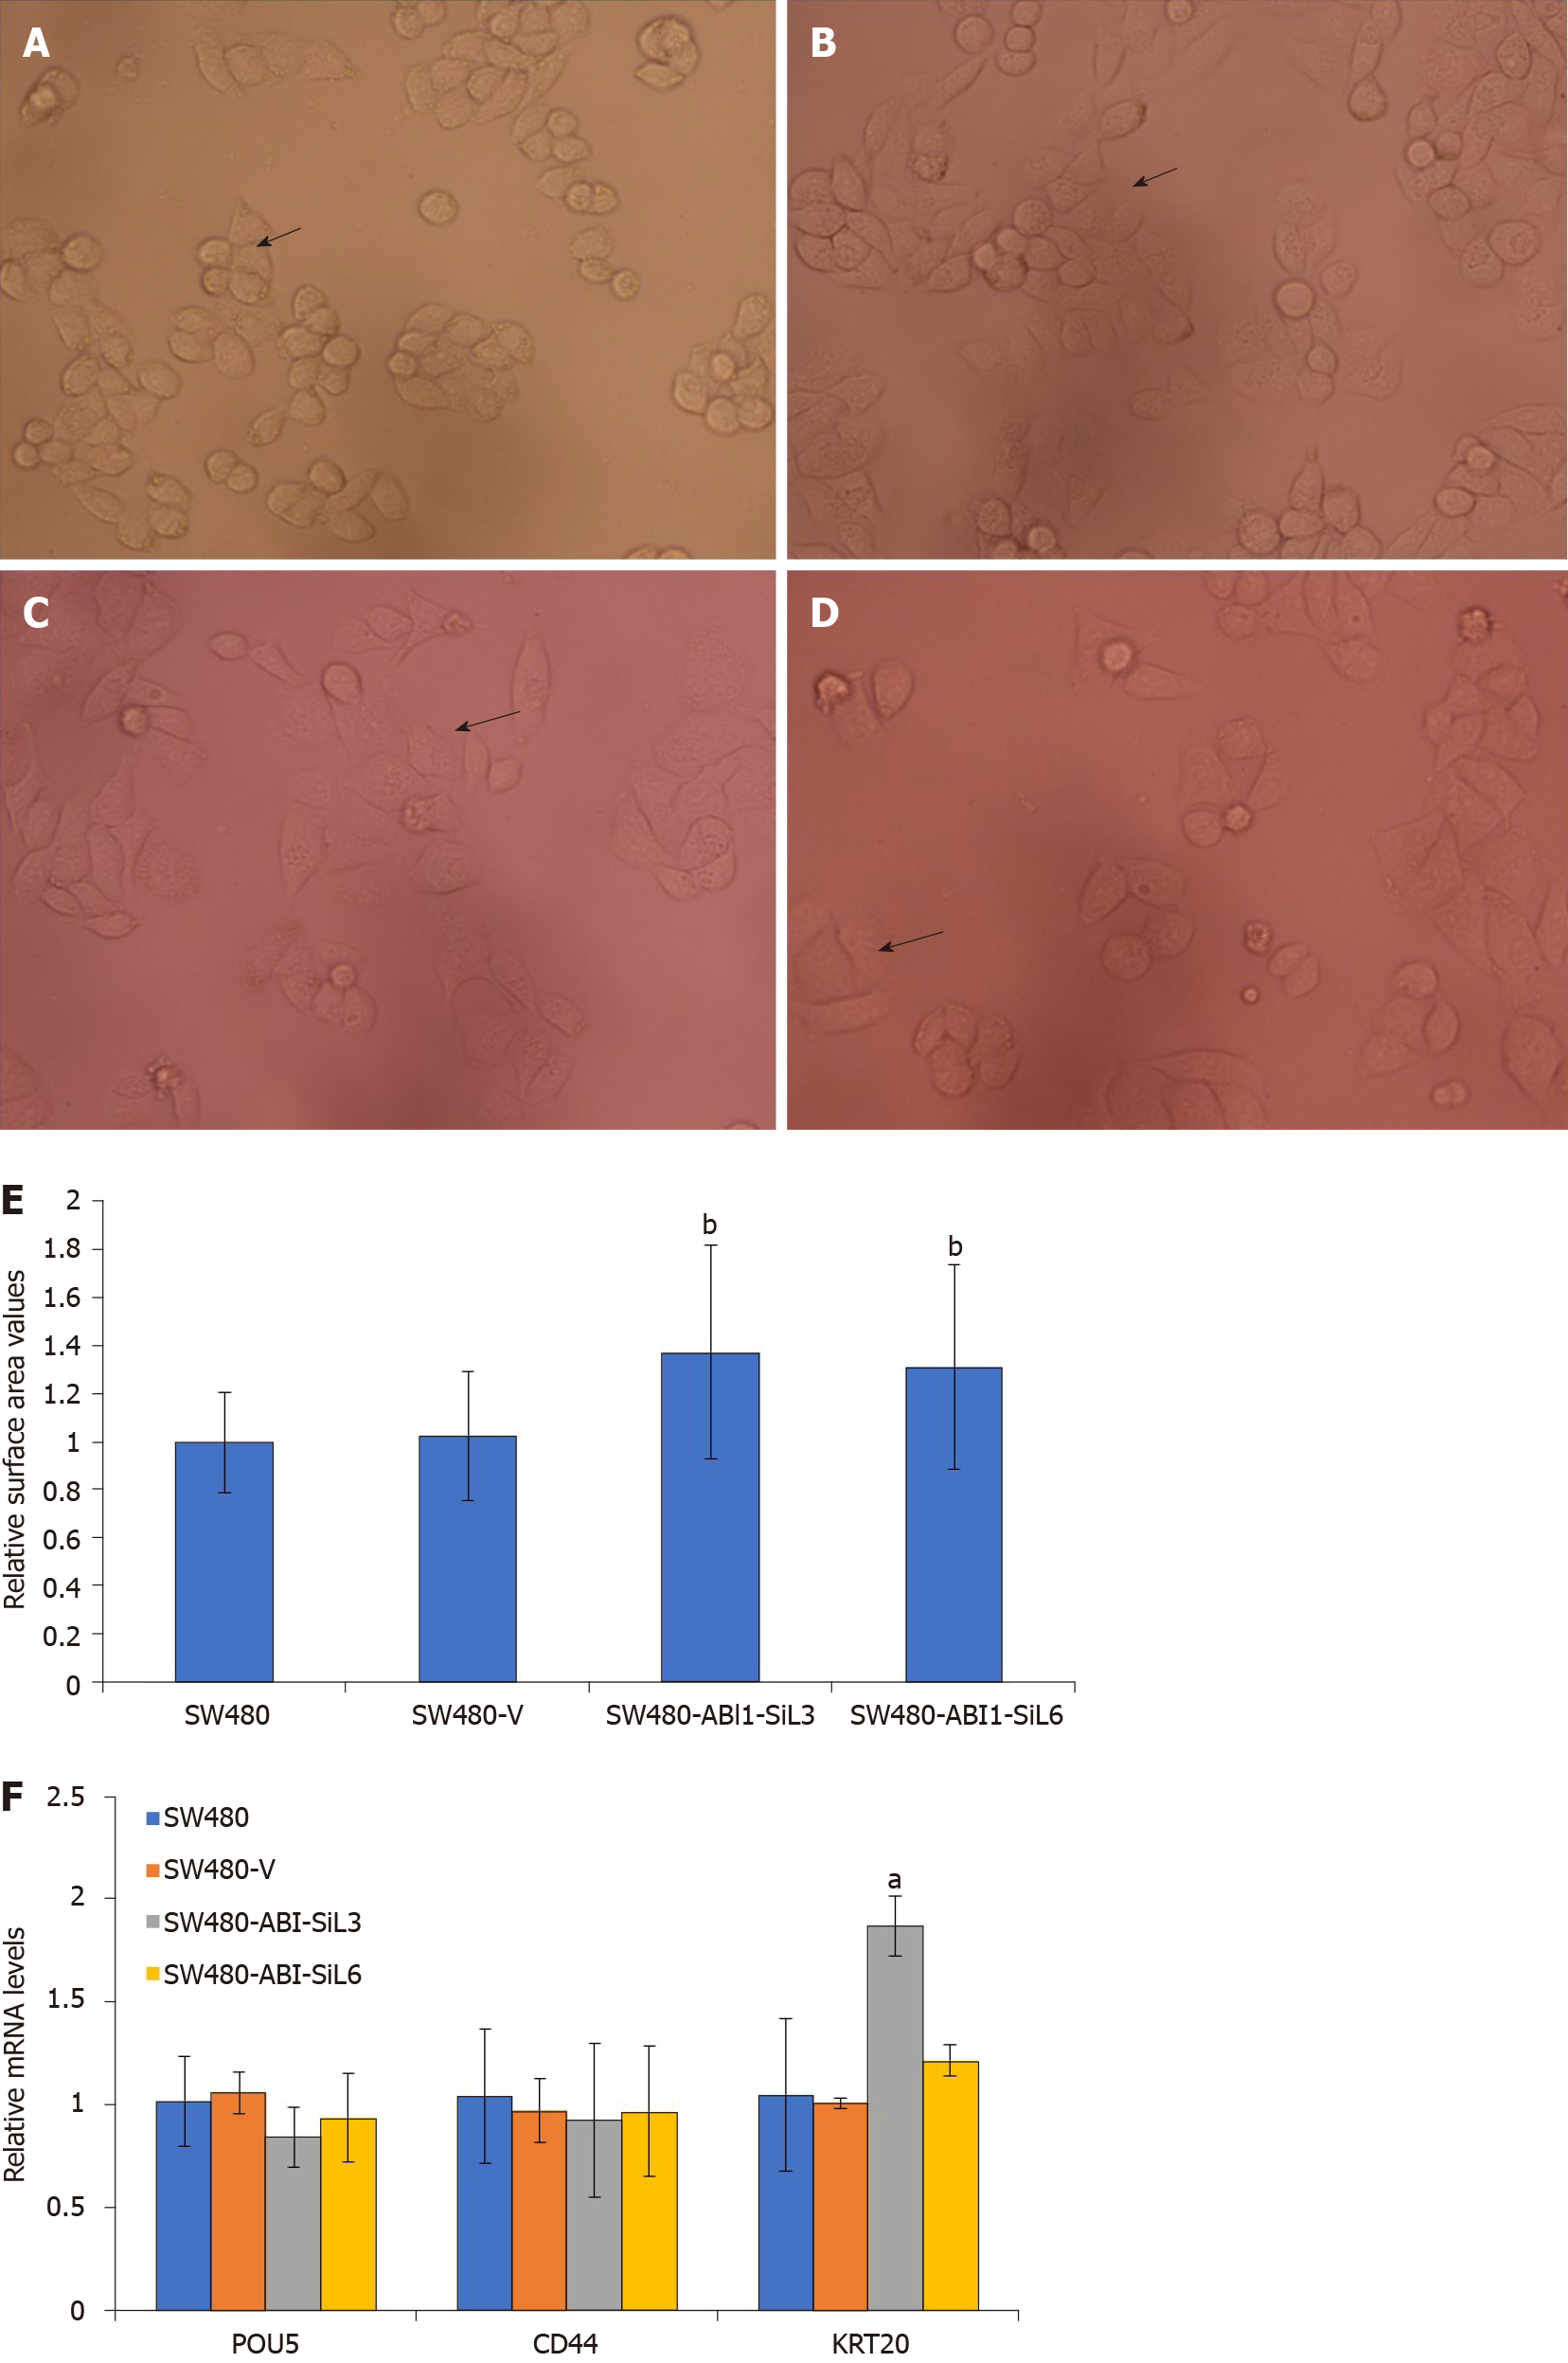
Figure 4 Alterations in cellular morphology occur with exogenous Abelson interactor 1 splice isoform-L expression in SW480 colon cancer cells.
A: SW480; B: SW480-V; C: SW480-ABI1-SiL3; D: SW480-ABI1-SiL6 cells; E: Cell surface area measured using ImageJ software. The mean values are normalized to those of parental SW480 cells. Data represent the mean ± SD of triplicate experiments. SW480 cells overexpressing Abelson interactor 1 splice isoform-L (ABI1-SiL) showed a 1.4 folds increase in cell surface area, bP < 0.01; F: Expression levels of stem-cell and cell differentiation markers determined by quantitative polymerase chain reaction using gene-specific primers. No significant differences were observed between SW480-ABI1-SiL (3 and 6) cells and parental SW480 cells or SW480-V cells (P > 0.05), except for KRT20 in the SW480-ABI1-SiL3 cells (aP < 0.05).
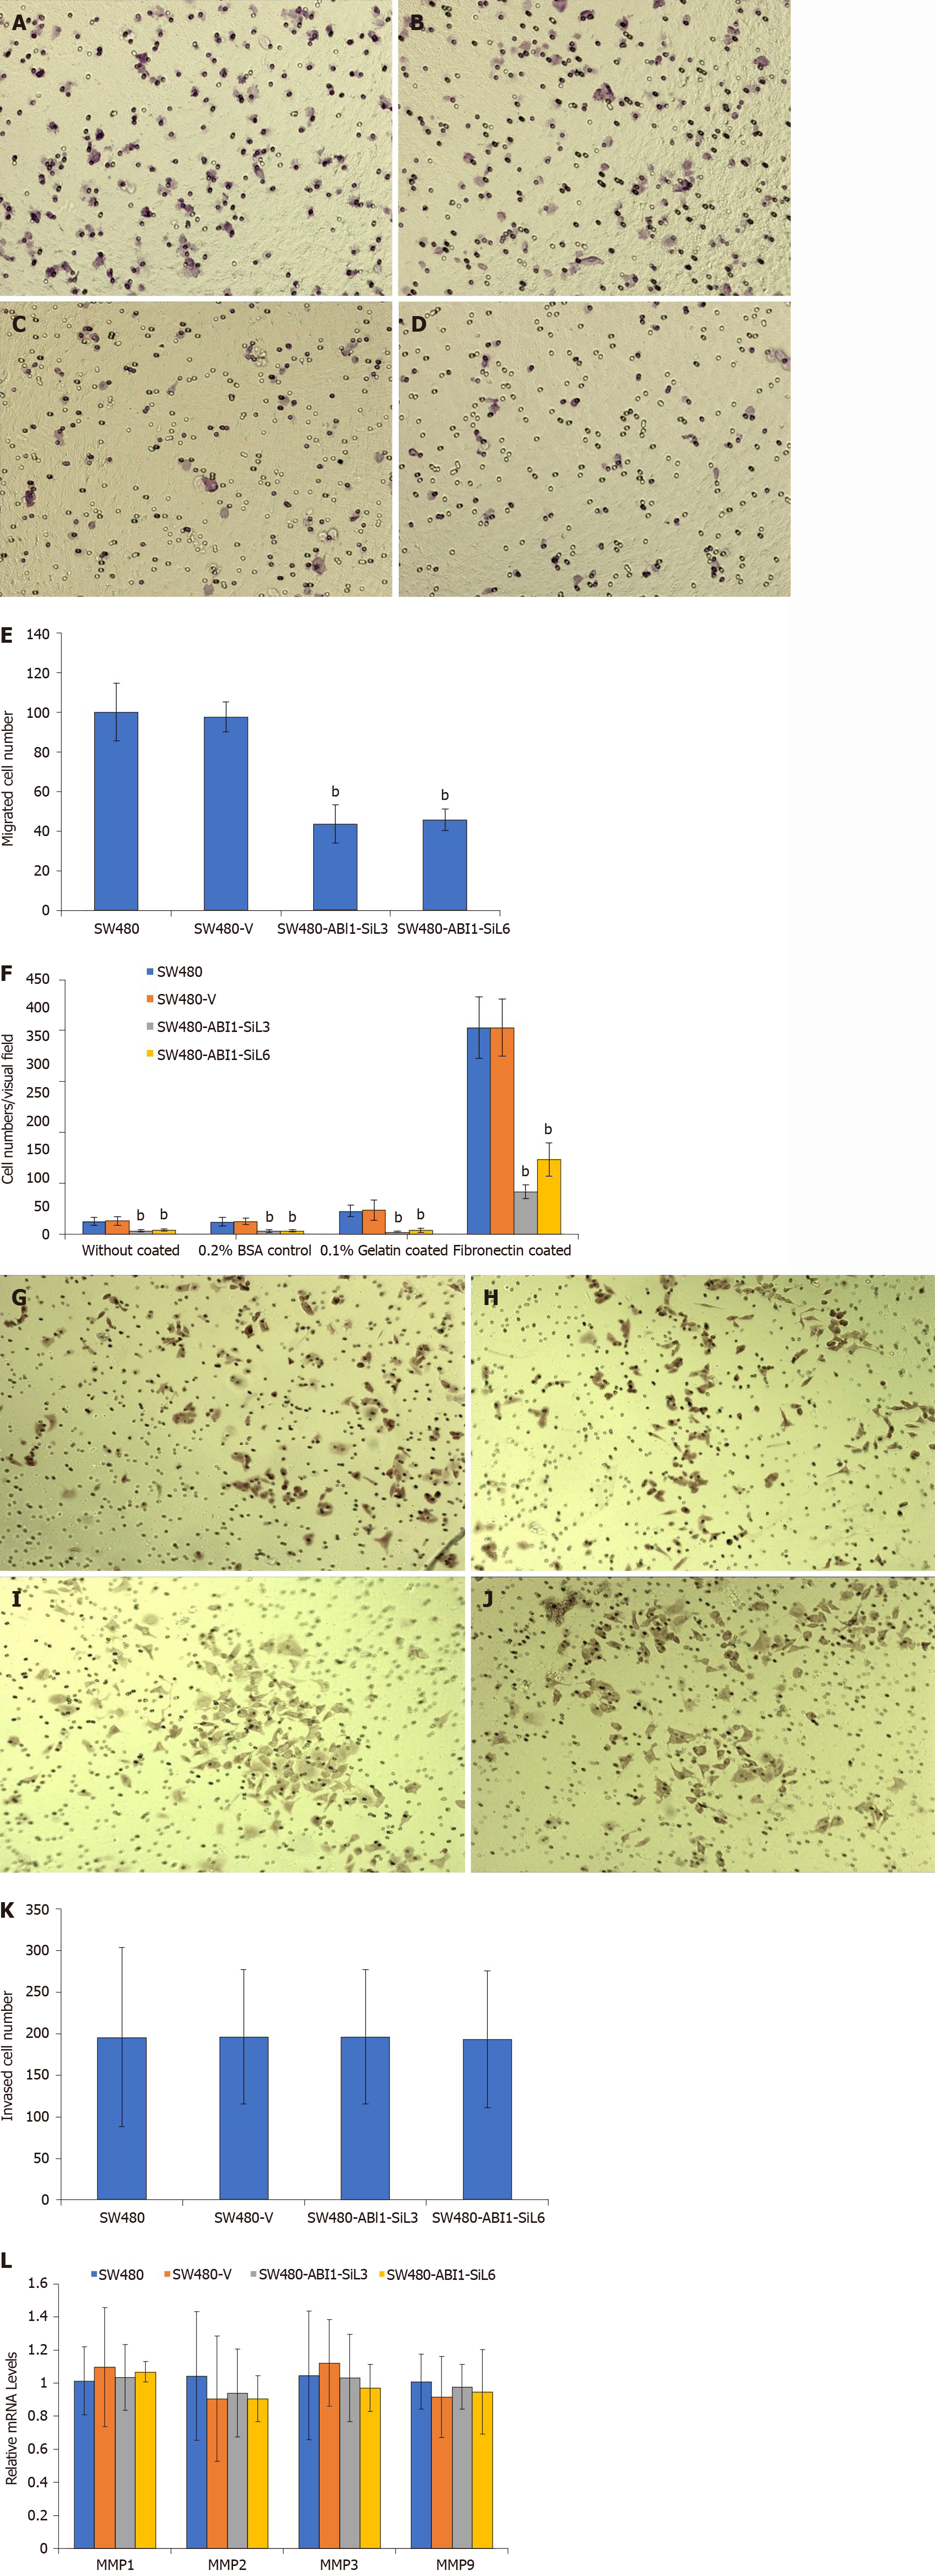
Figure 5 Overexpression of Abelson interactor 1 splice isoform-L inhibits migration and adhesion, but not invasion, of SW480 human colon cancer cells.
A-F: Effect of Abelson interactor 1 splice isoform-L (ABI1-SiL) overexpression on migration of SW480 cells in vitro. A migration assay was conducted over 24 h with 2.5 × 10⁴ cells using a transwell chamber. Cells on the lower surface of the filter were imaged. SW480 (A), SW480-V (B), SW480-ABI1-SiL3 (C), and SW480-ABI1-SiL6 (D) were used. The number of migrating cells that penetrated the transwell chamber is expressed as the mean number of cells from five random fields. Representative results from one experiment of three are shown (E). The effects of ABI1-SiL overexpression on SW480 cell adhesion on 0.2% BSA, 0.1% gelatin, or fibronectin-coated surfaces were assessed (F). All tested cell lines were cultured in 0.2% BSA, 0.1% gelatin, or 5 μg/mL fibronectin-coated six-well plates (2.5 × 10⁵ cells per well) for 6 h. The total number of cells that were adherent in each condition were counted. The vertical axis shows the number of the adherent cells per field (from five random fields) and is expressed as the mean ± SD of triplicate wells; G-L: Effect of ABI1-SiL overexpression on invasion of SW480 cells in vitro. An invasion assay was conducted over 48 h with 2.5 × 10 4 cells using Matrigel filters. Results shown here are for one representative experiment. Cells on the lower surface of the filter were imaged. SW480 (G), SW480-V (H), SW480-ABI1-SiL3 (I), and SW480-ABI1-SiL6 (J) were used. The number of migrated cells that penetrated through Matrigel-coated filters is expressed as the mean number of cells in five random fields (K). ABI1-SiL overexpression in SW480 cells has no effect on the mRNA expression of MMPs (L). aP < 0.05 and bP < 0.01 indicate significant differences between SW480, SW480-V, SW480-ABI1-SiL3, and SW480-ABI1-SiL6 cells. ABI1-SiL: Abelson interactor 1 splice isoform-L.
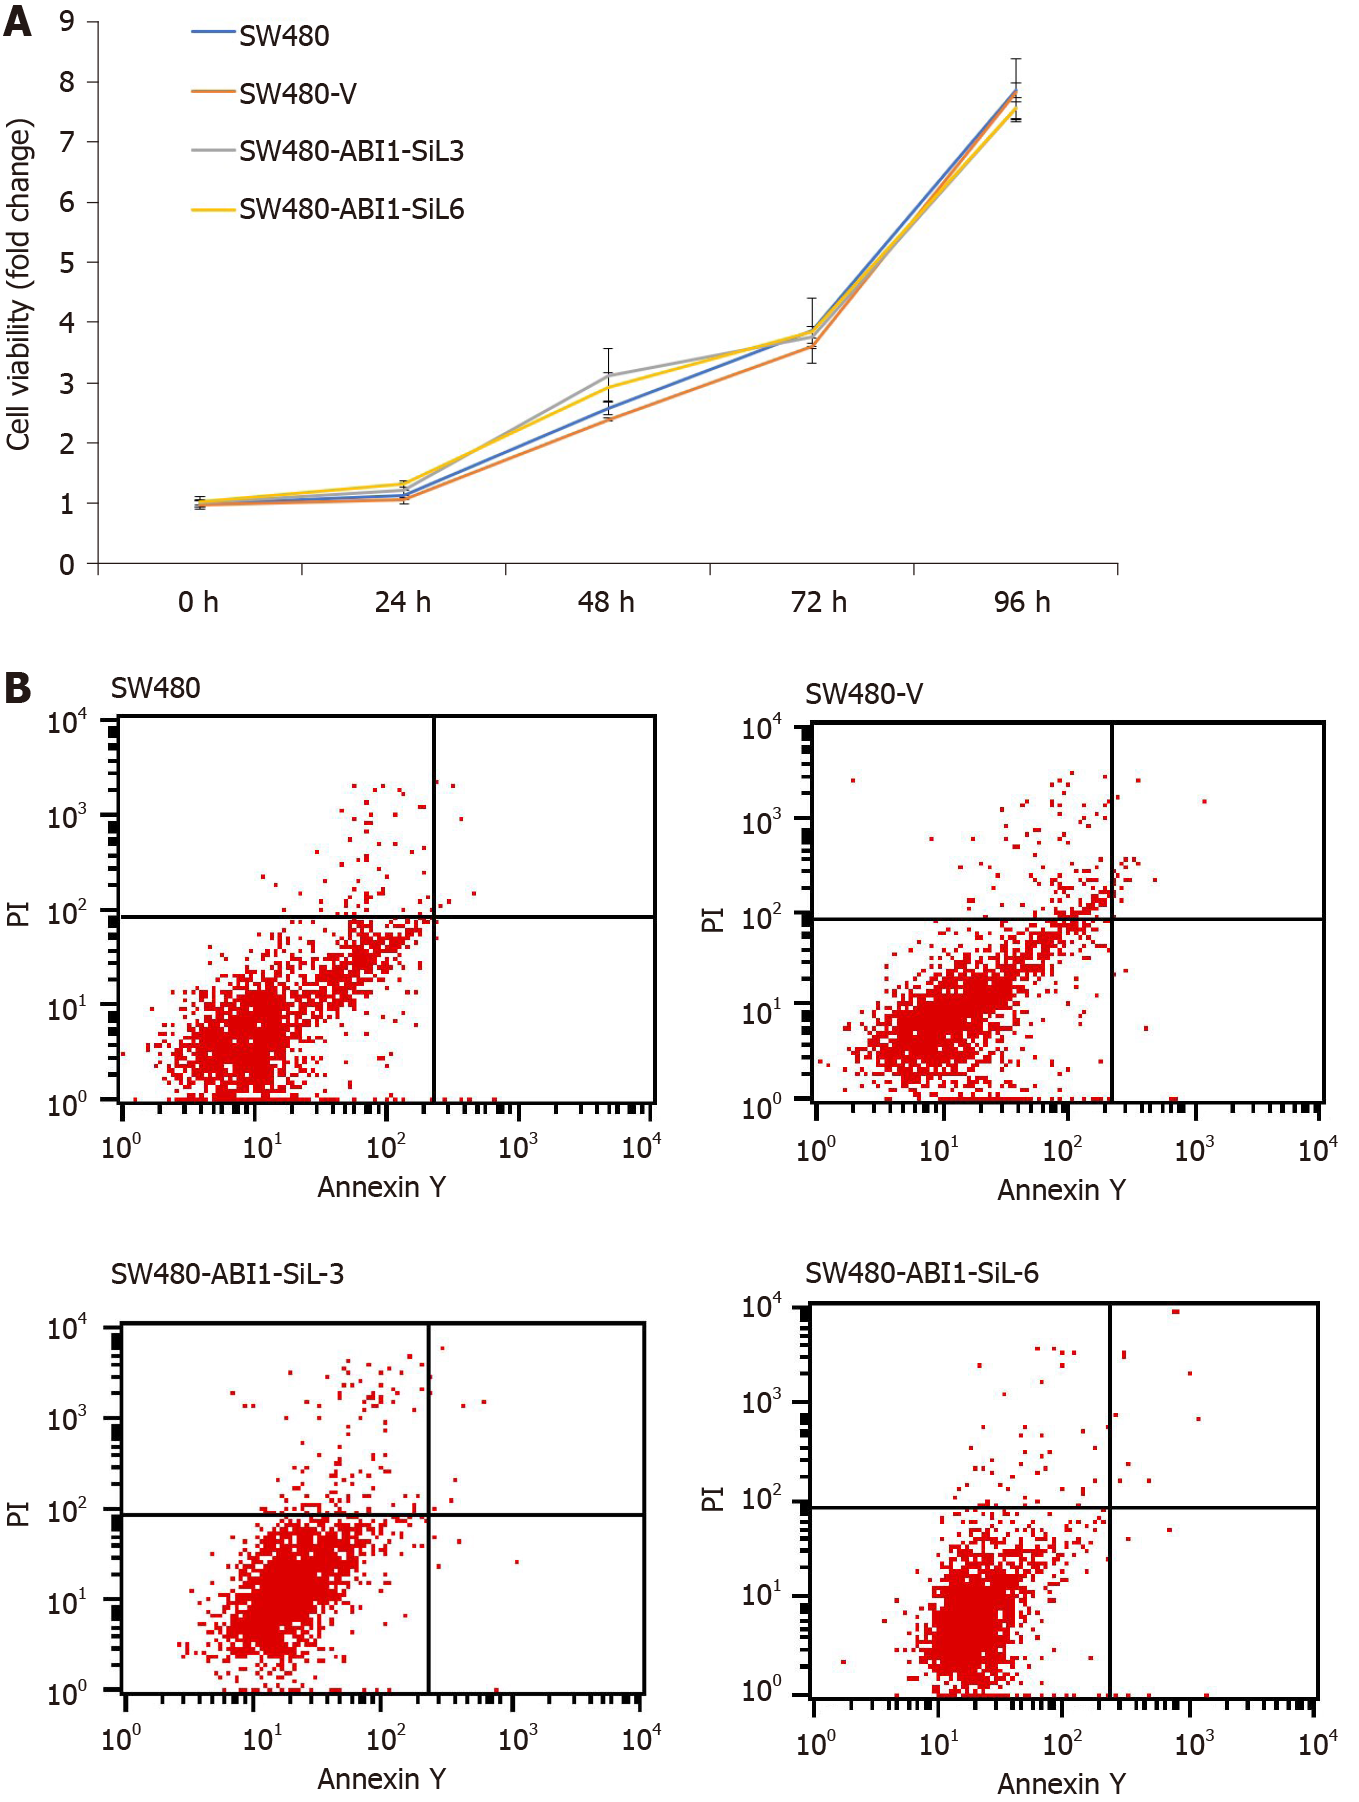
Figure 6 Overexpression of Abelson interactor 1 splice isoform-L does not alter proliferation or death of SW480 cells.
Abelson interactor 1 splice isoform-L (ABI1-SiL) overexpression did not impair the proliferation of SW480 cells in vitro. Proliferative assay was performed with a Cell Counting Kit-8. A: Cell viability (fold change) is shown in the vertical axis as the mean ± SD of triplicate wells (n = 3). ABI1-SiL overexpression did not induce the apoptosis of SW480 cells in vitro; B: Cell apoptosis was assessed by Annexin-V assay. ABI1-SiL: Abelson interactor 1 splice isoform-L.
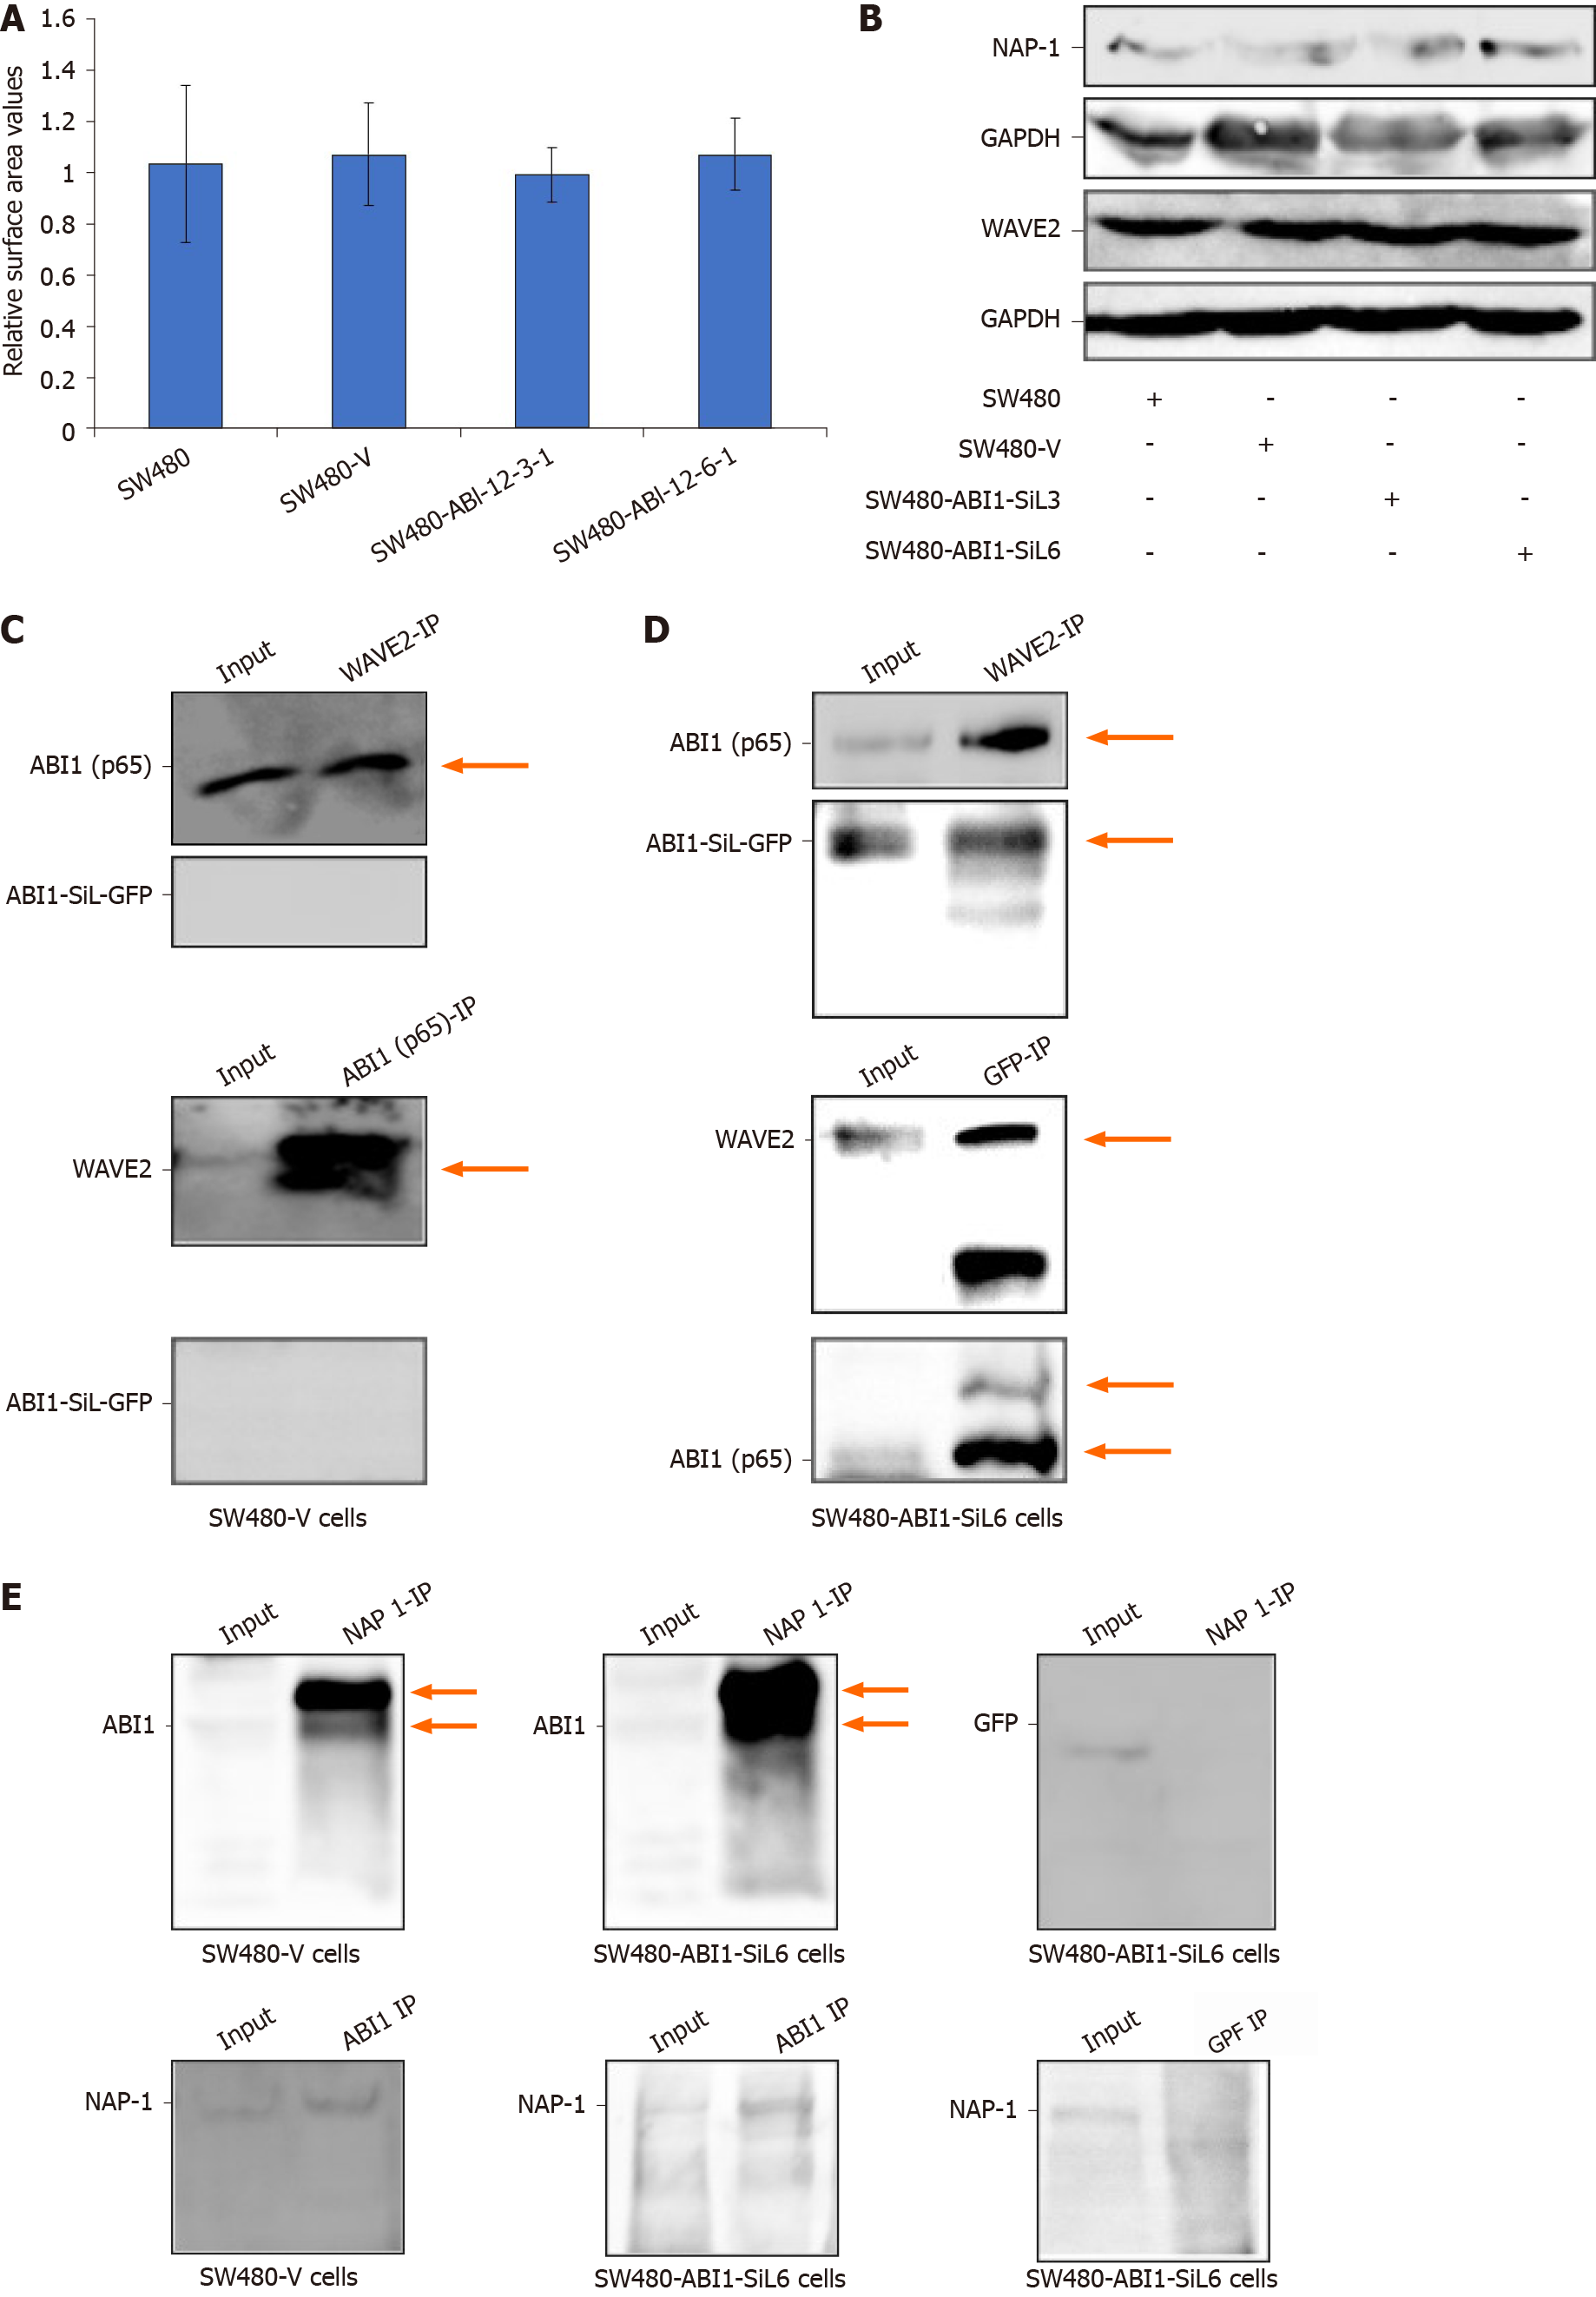
Figure 7 Abelson interactor 1 splice isoform-L interacts with WAVE2, phosphorylated or non-phosphorylated Abelson interactor 1-p65, and NAP-1 in SW480 cells.
A and B: Abelson interactor 1 splice isoform-L (ABI1-SiL) overexpression does not change the mRNA (A) or protein (B) expression of WAVE2; C and D: Co-immunoprecipitates (IP) were subjected to Western blot using the indicated antibodies. Bidirectional co-IP and Western blot analysis show that both ABI1-p65 and ABI1-SiL bind to WAVE2 in SW480-V (C) and SW480-ABI1-SiL6 cells (D); E: ABI1-SiL interacts with phosphorylated and non-phosphorylated ABI1-p65 in SW480 cells (arrows). ABI1-SiL does not bind to NAP-1, but ABI1-p65 does. ABI1-SiL: Abelson interactor 1 splice isoform-L; ABI1: Abelson interactor 1; GFP: Green fluorescence protein; GAPDH: Glyceraldehyde-3-phosphate dehydrogenase.
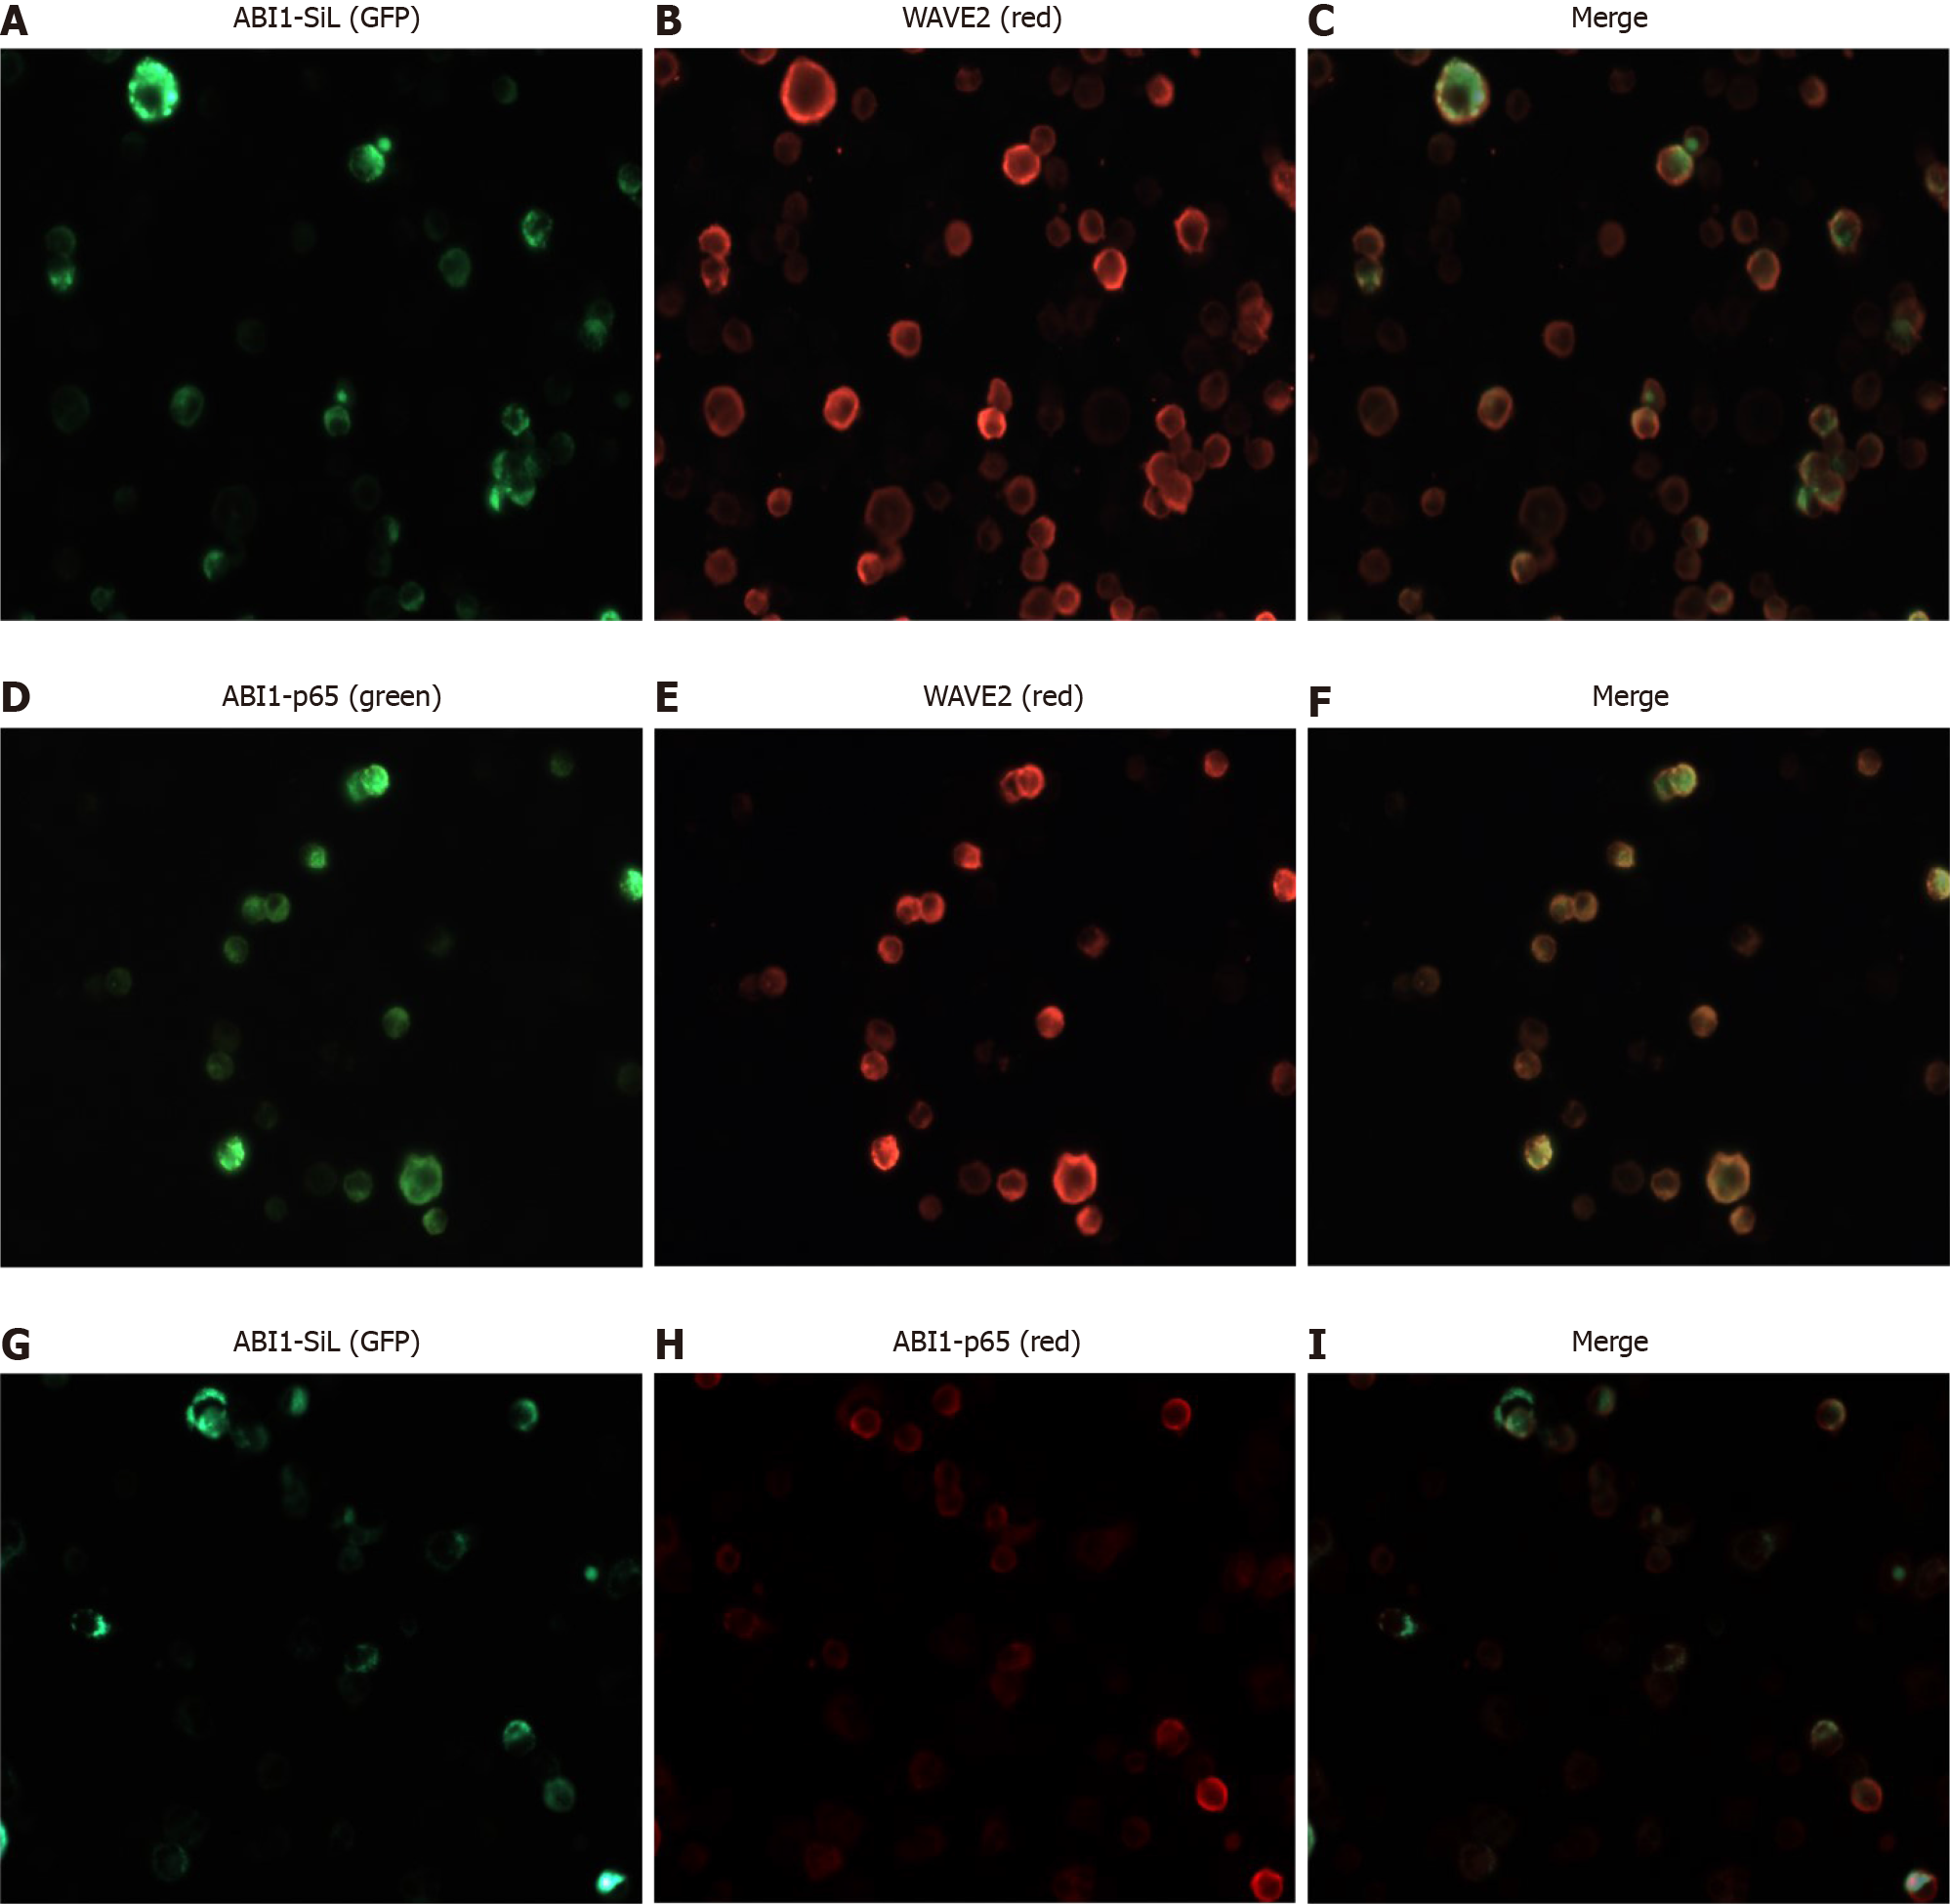
Figure 8 Abelson interactor 1 splice isoform-L co-localizes with WAVE2 and Abelson interactor 1-p65 in 293T cells.
A-I: Abelson interactor 1 splice isoform-L-GFP (green fluorescence protein) co-localizes with WAVE2 and ABI1-p65. Samples of 293T cells transiently transfected with Abelson interactor 1 splice isoform-L were probed with WAVE2 (A, B, and C) and Abelson interactor 1-p65 (G, H, and I) antibodies, respectively, while 293T cells were probed for WAVE2 and Abelson interactor 1-p65 (D, E, and F). Magnification × 400. ABI1-SiL: Abelson interactor 1 splice isoform-L; ABI1: Abelson interactor 1; GFP: Green fluorescence protein.
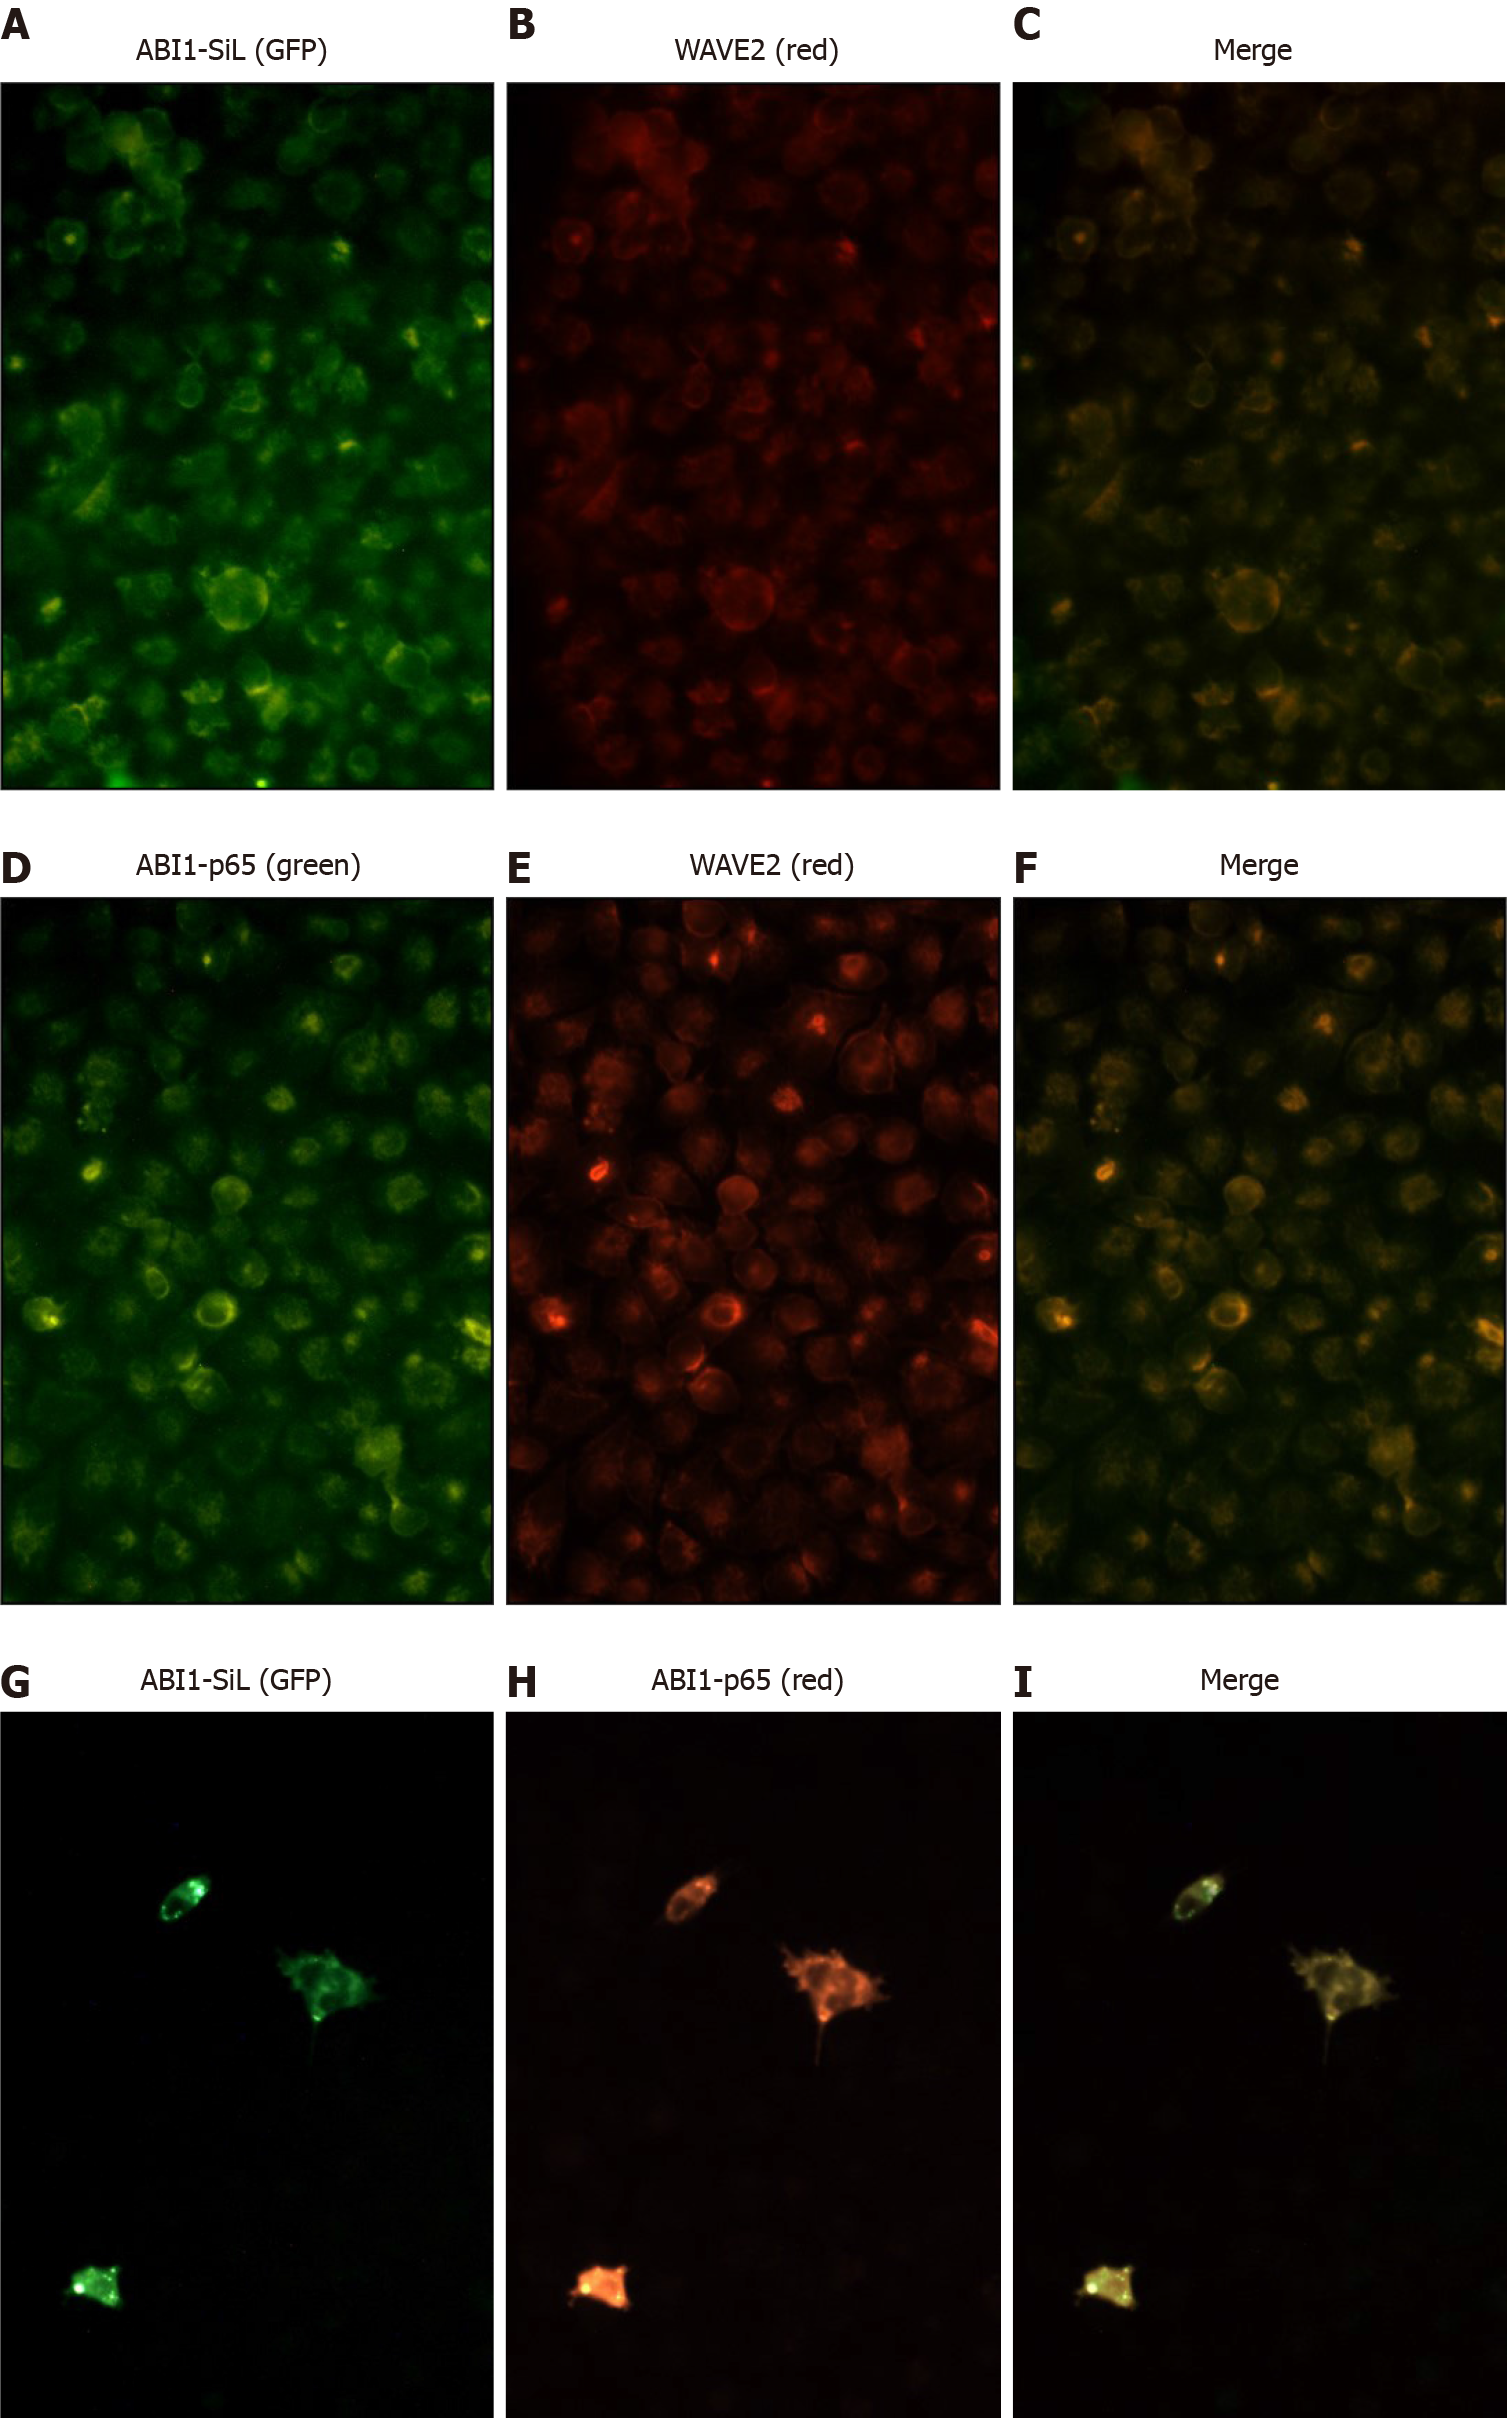
Figure 9 Abelson interactor 1 splice isoform-L co-localizes with WAVE2 and Abelson interactor 1-p65 in SW480-ABI1-SiL6 cells.
A-I: Abelson interactor 1 splice isoform-L (ABI1-SiL)-GFP (green fluorescence protein) co-localizes with WAVE2 and ABI1-p65. SW480-ABI1-SiL6 cells were probed with WAVE2 (A, B, and C) and ABI1-p65 (G, H, and I) antibodies, while SW480 cells were similarly probed for WAVE2 and ABI1-p65 (D, E, and F). Magnification × 400. ABI1-SiL: Abelson interactor 1 splice isoform-L; ABI1: Abelson interactor 1; GFP: Green fluorescence protein.
- Citation: Li K, Peng YF, Guo JZ, Li M, Zhang Y, Chen JY, Lin TR, Yu X, Yu WD. Abelson interactor 1 splice isoform-L plays an anti-oncogenic role in colorectal carcinoma through interactions with WAVE2 and full-length Abelson interactor 1. World J Gastroenterol 2021; 27(15): 1595-1615
- URL: https://www.wjgnet.com/1007-9327/full/v27/i15/1595.htm
- DOI: https://dx.doi.org/10.3748/wjg.v27.i15.1595


