Copyright
©The Author(s) 2021.
World J Gastroenterol. Apr 14, 2021; 27(14): 1507-1523
Published online Apr 14, 2021. doi: 10.3748/wjg.v27.i14.1507
Published online Apr 14, 2021. doi: 10.3748/wjg.v27.i14.1507
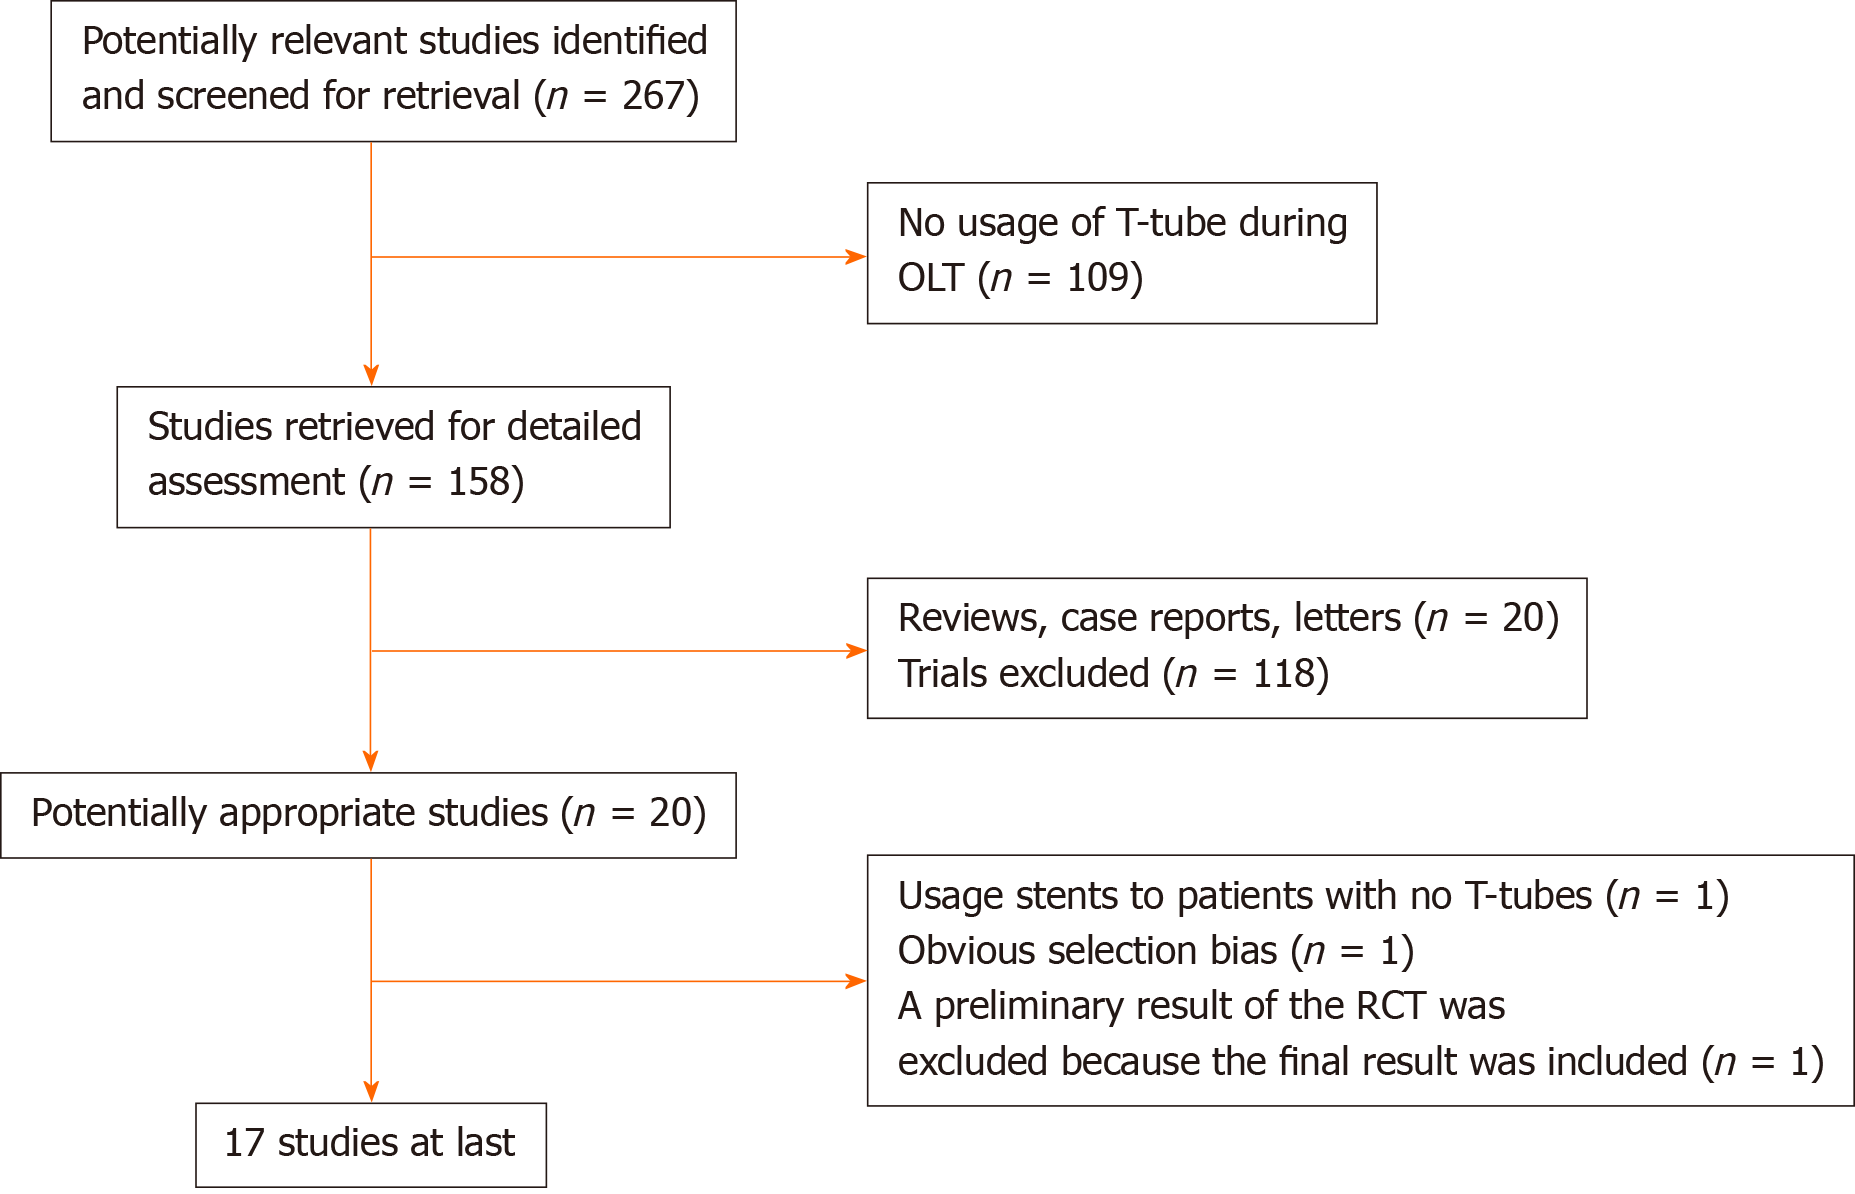
Figure 1 Flowchart of selection process of randomized control trials and comparative studies.
RCT: Randomized control trials; OLT: Orthotopic liver transplantation.
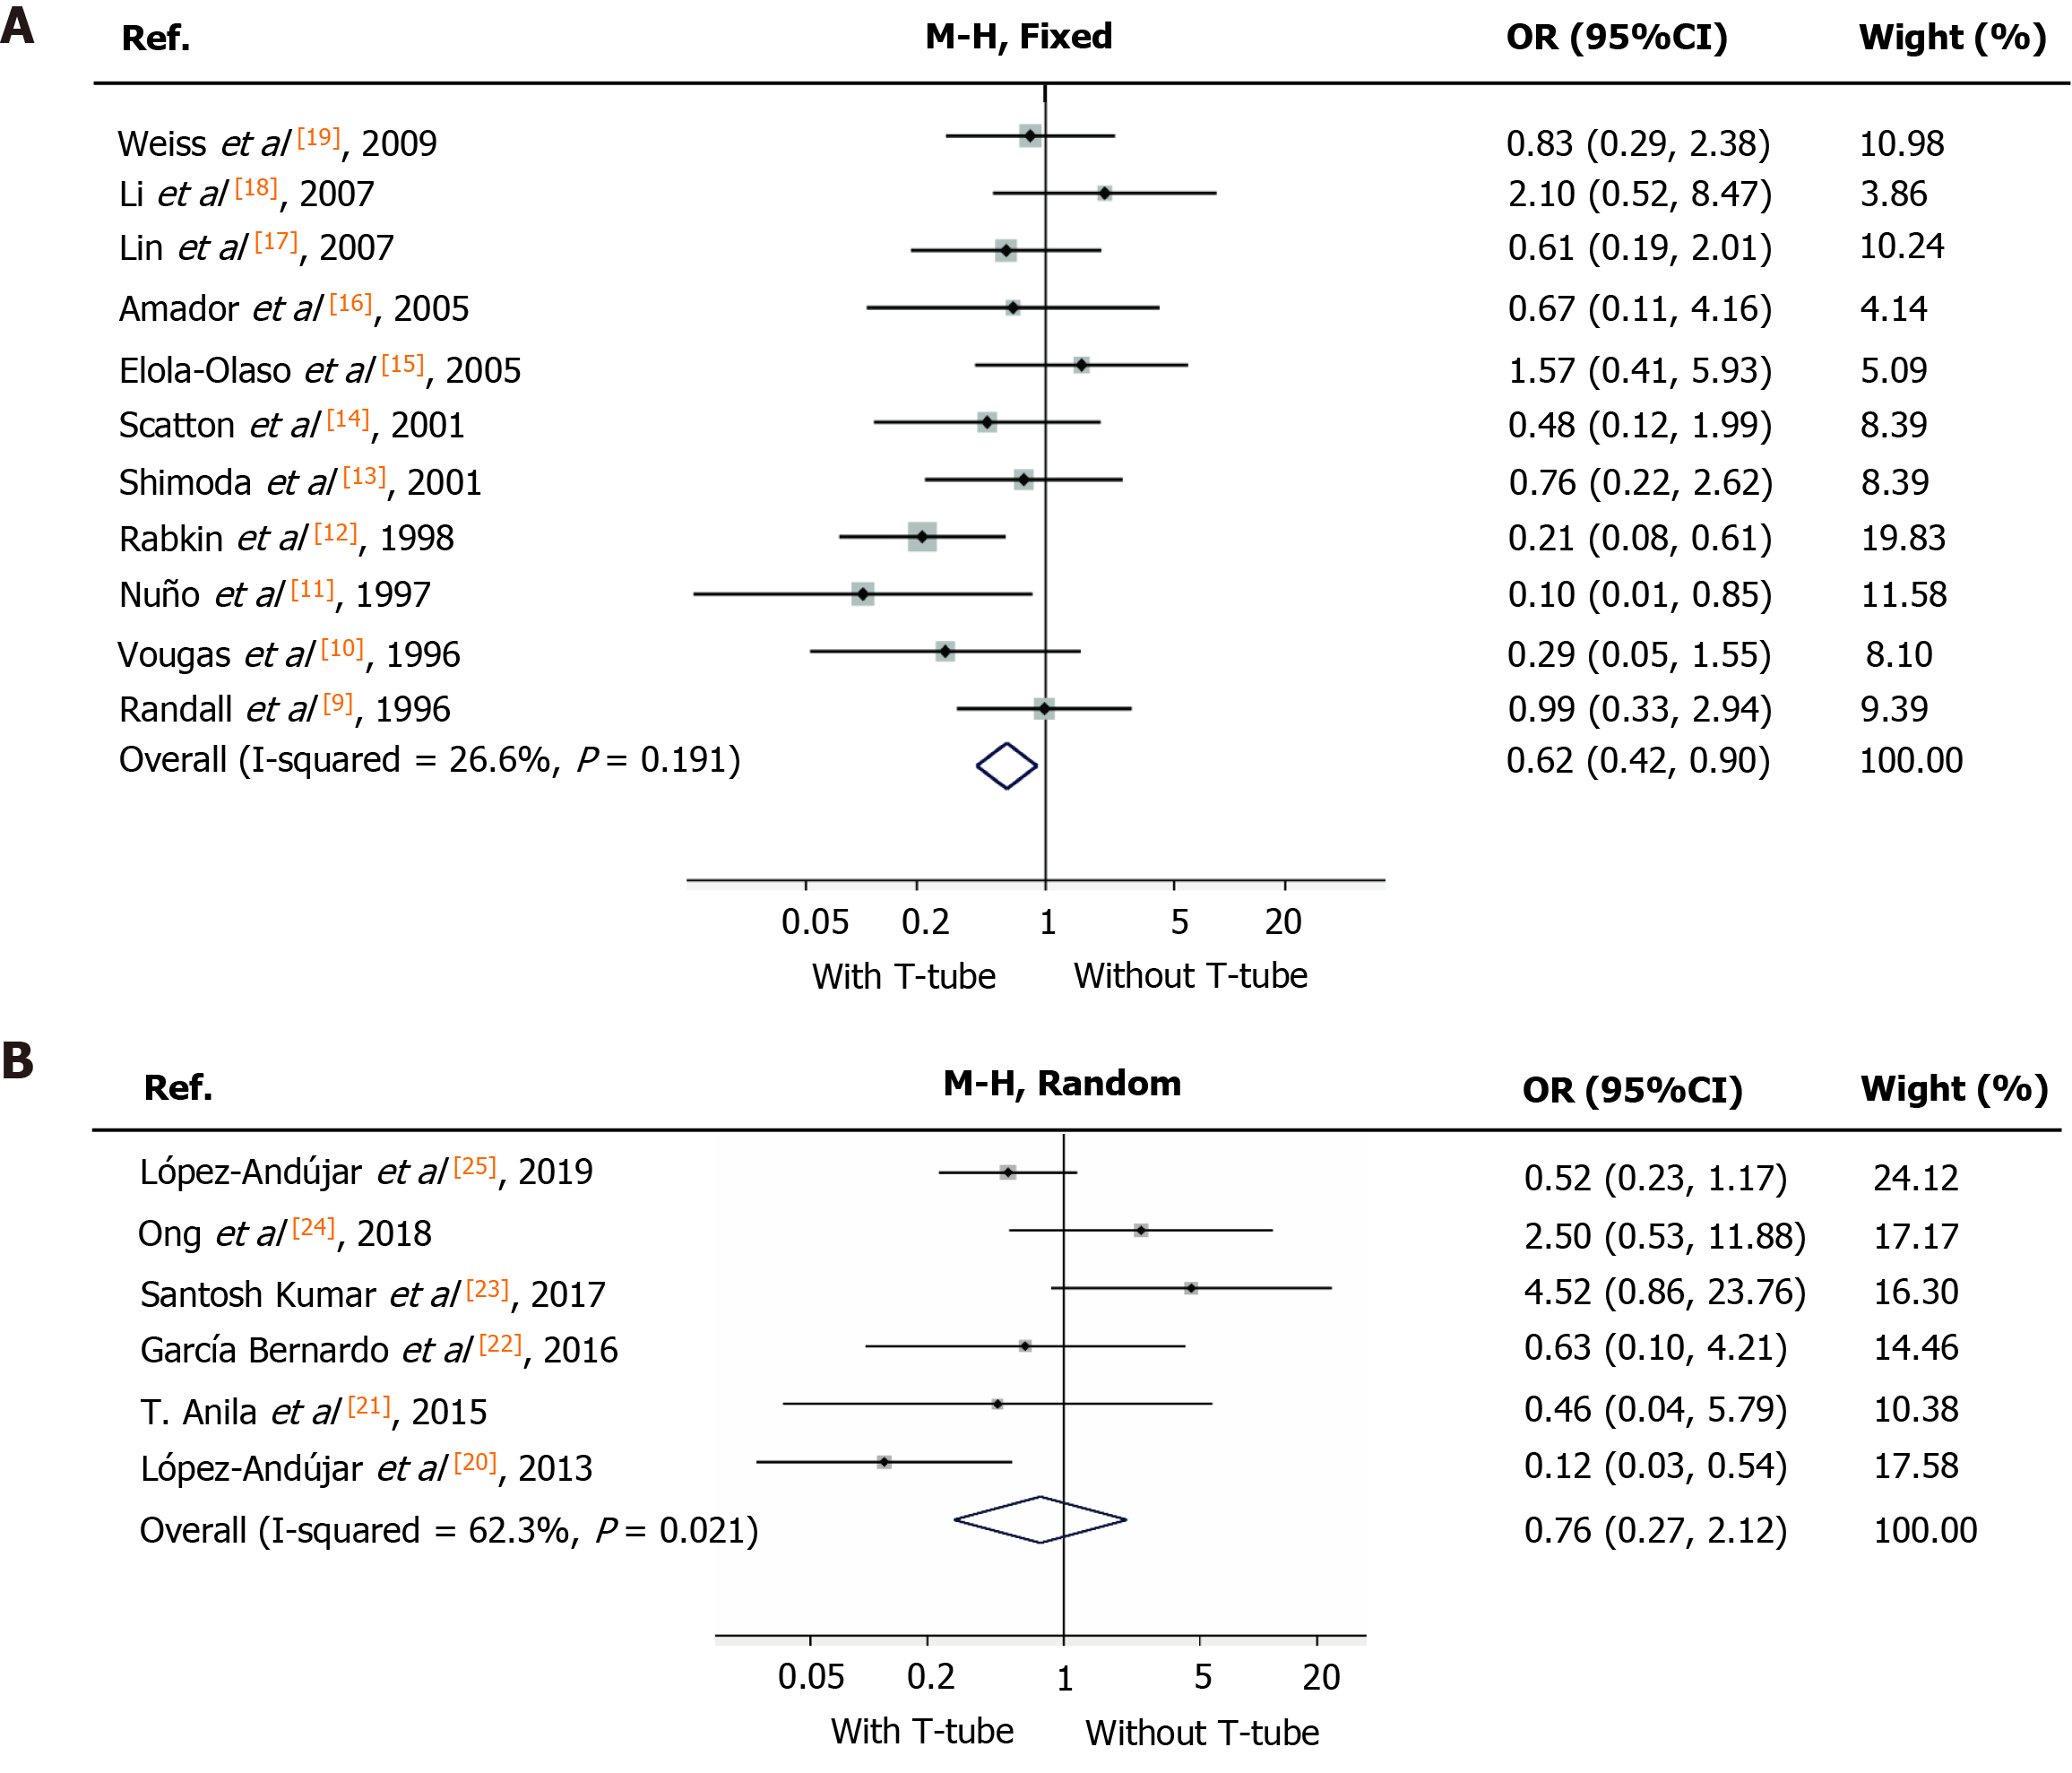
Figure 2 Biliary strictures.
A: In the period from 1995 to 2010, odds ratio (OR) for biliary strictures between “T-tube” group and “without T-tube” group was calculated with a fixed-effects model. The shape of diamond represents the overall effect of OR with 95% confidence interval (CI). The use of T-tube decreased the incidence of biliary strictures; B: In the period from 2010 to 2020, OR for biliary strictures between “T-tube” group and “without T-tube” group was calculated with a random-effects model. The shape of diamond represents the overall effect of OR with 95%CI. There was no significant difference between the two groups. OR: Odds ratio; CI: Confidence interval.
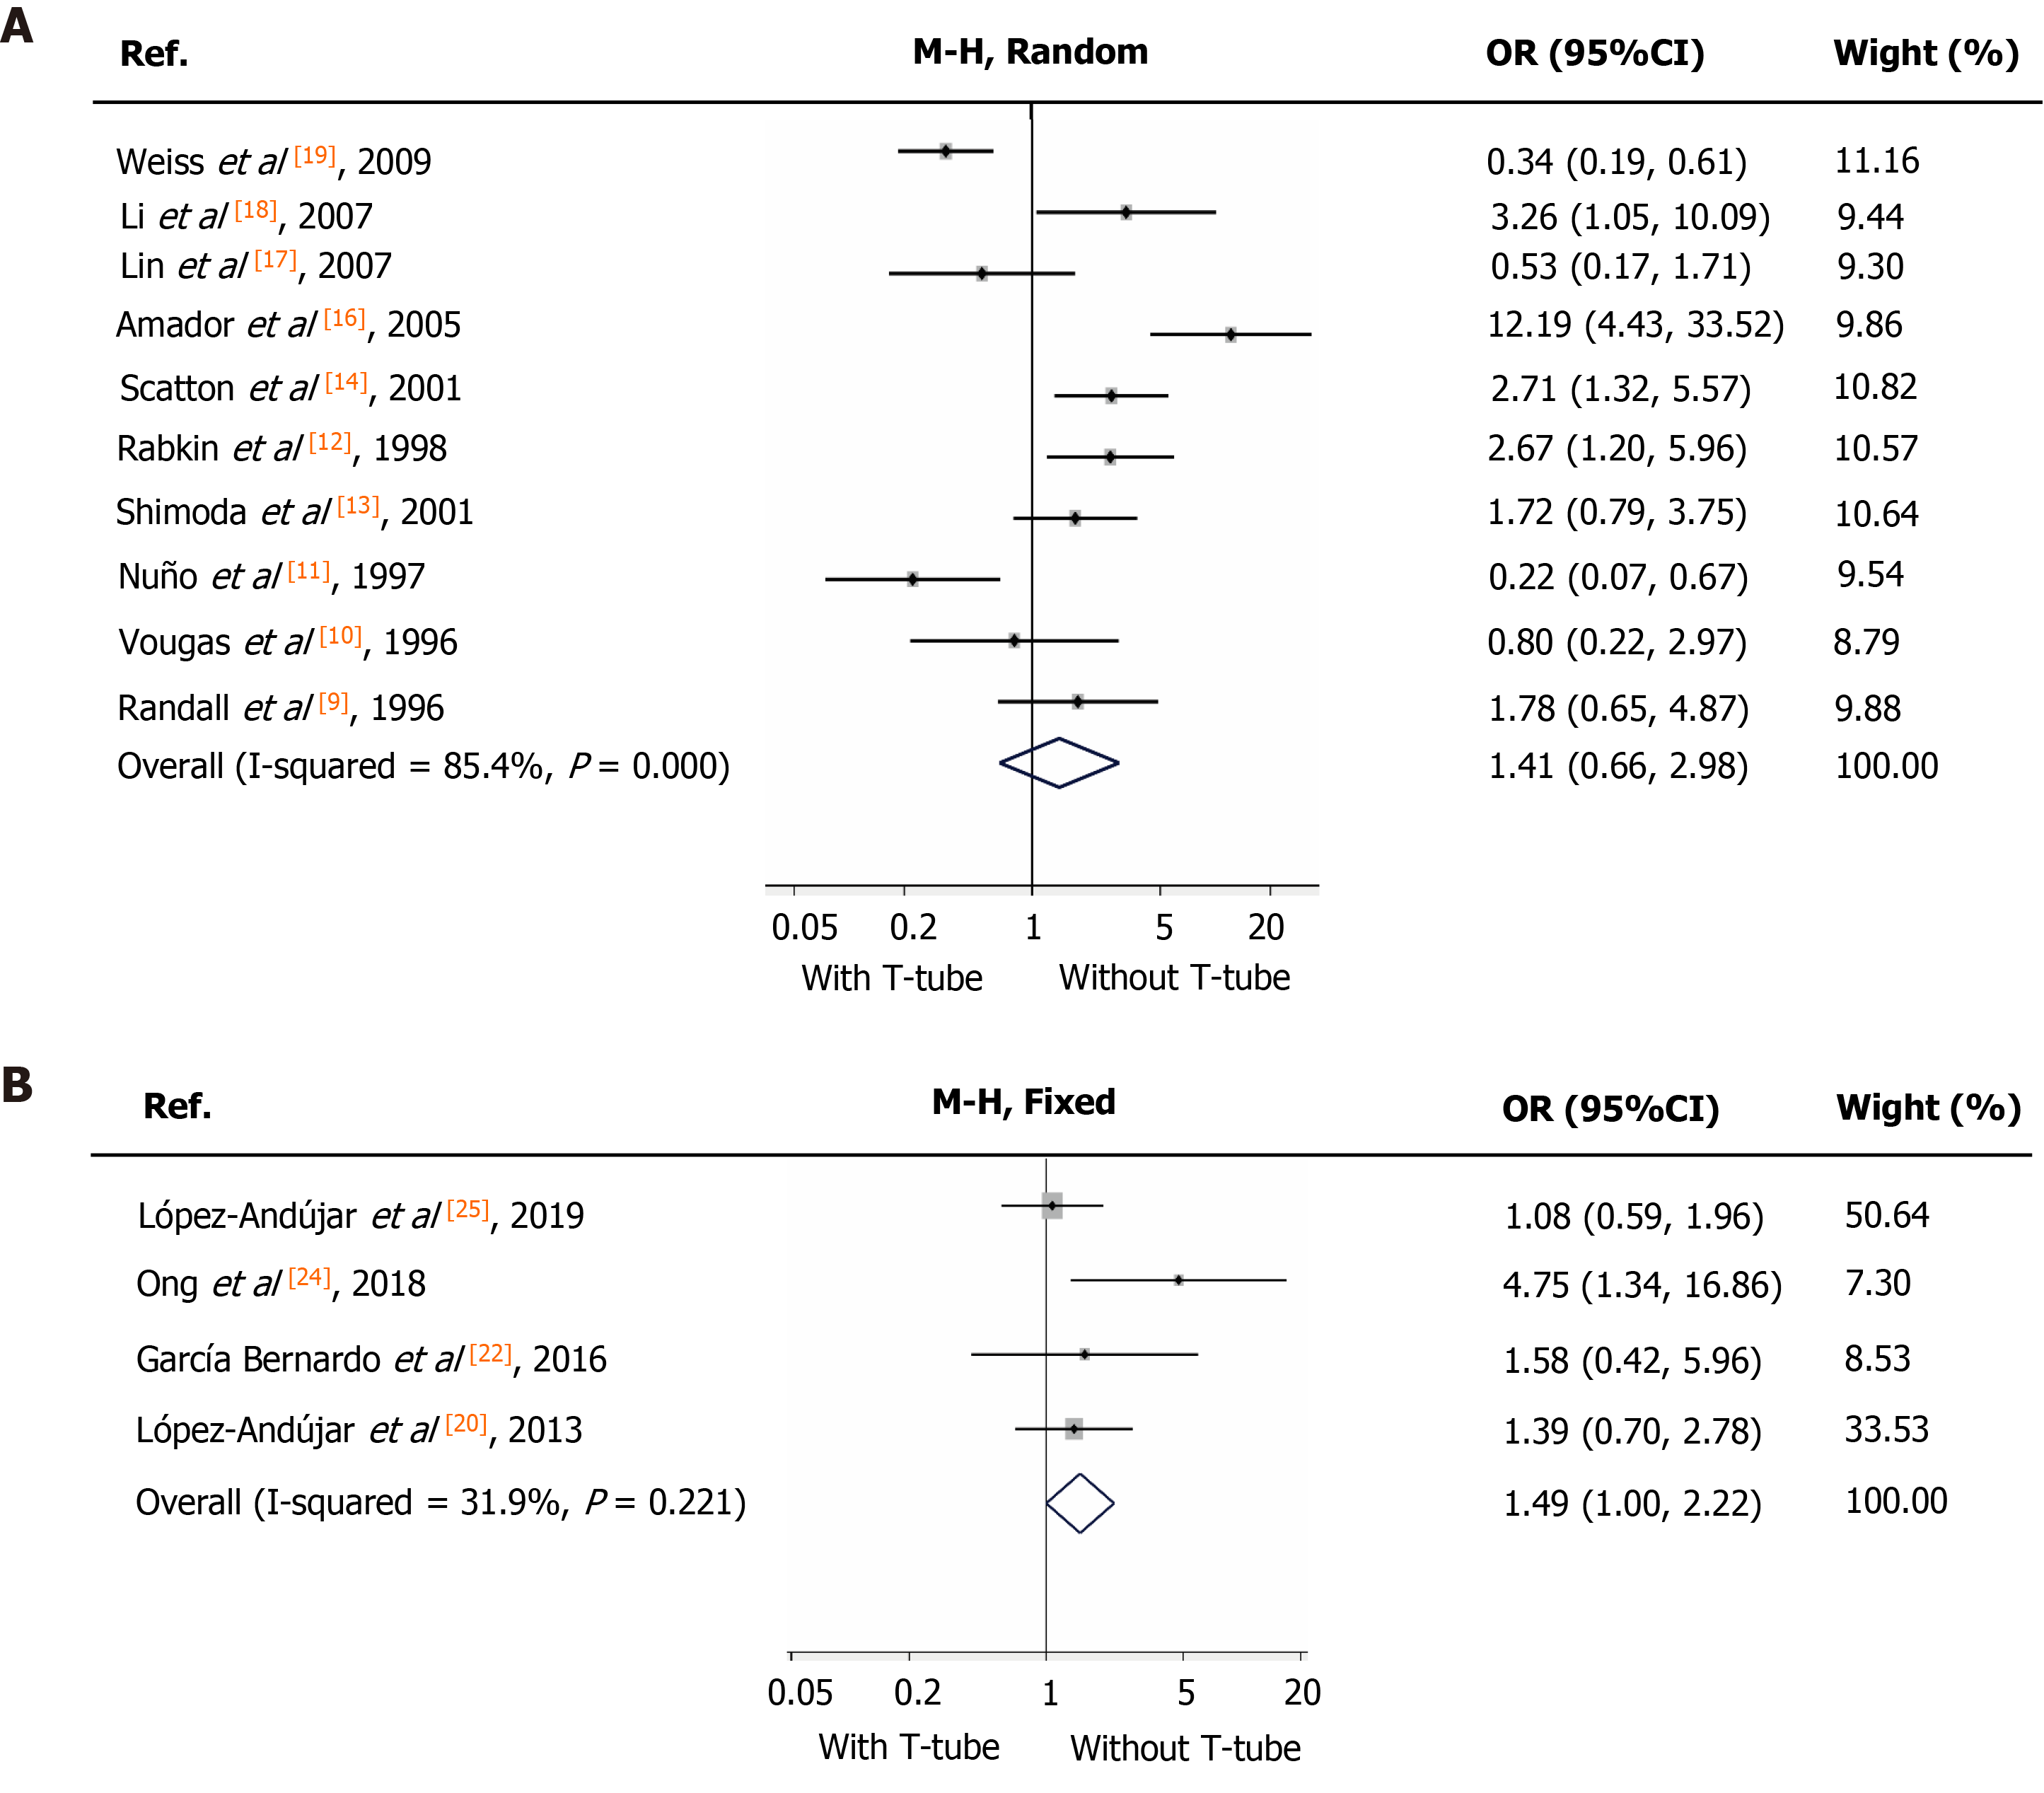
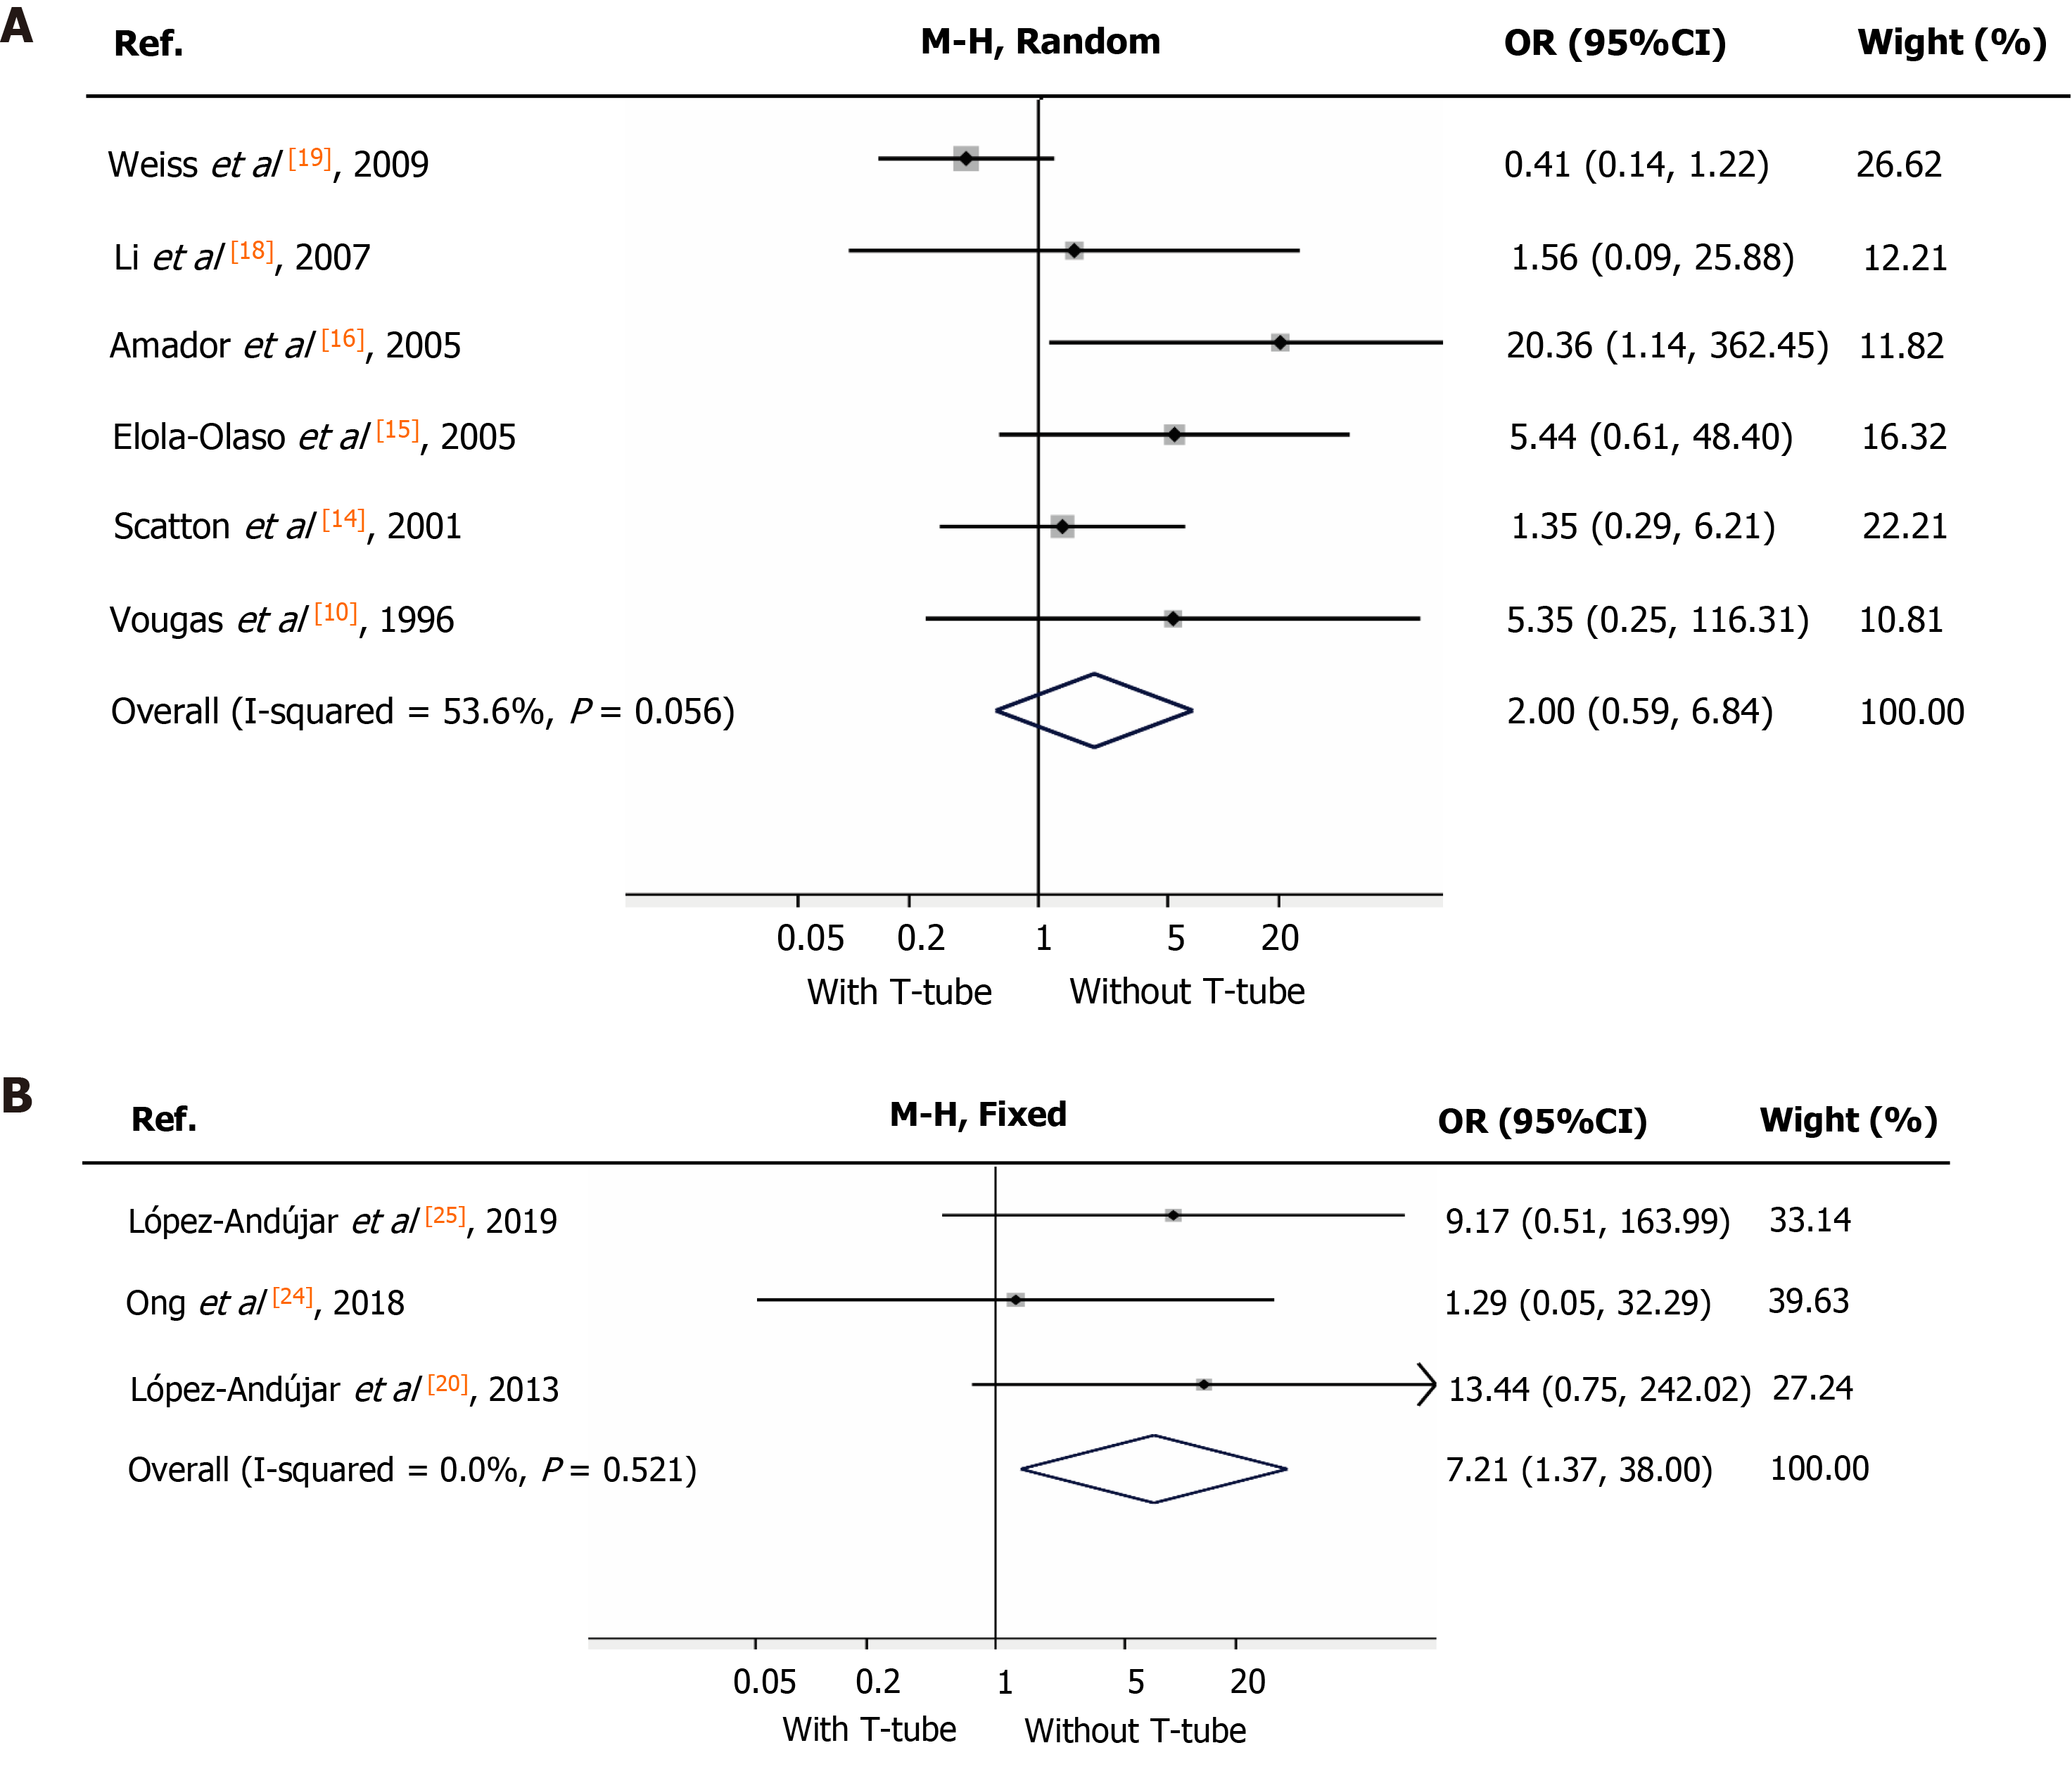
Figure 3 Overall biliary complications.
A: In the period from 1995 to 2010, odds ratio (OR) for overall biliary complications between “T-tube” group and “without T-tube” group was calculated with a random-effects model. The shape of diamond represents the overall effect of OR with 95% confidence interval (CI). The use of T-tube had no influence on occurrence of overall biliary complication; B: In the period from 2010 to 2020, OR for overall biliary complications between “T-tube” group and “without T-tube” group was calculated with a fixed-effects model. The shape of diamond represents the overall effect of OR with 95%CI. The occurrence of overall biliary complications was significantly higher in “T-tube” group. OR: Odds ratio; CI: Confidence interval.
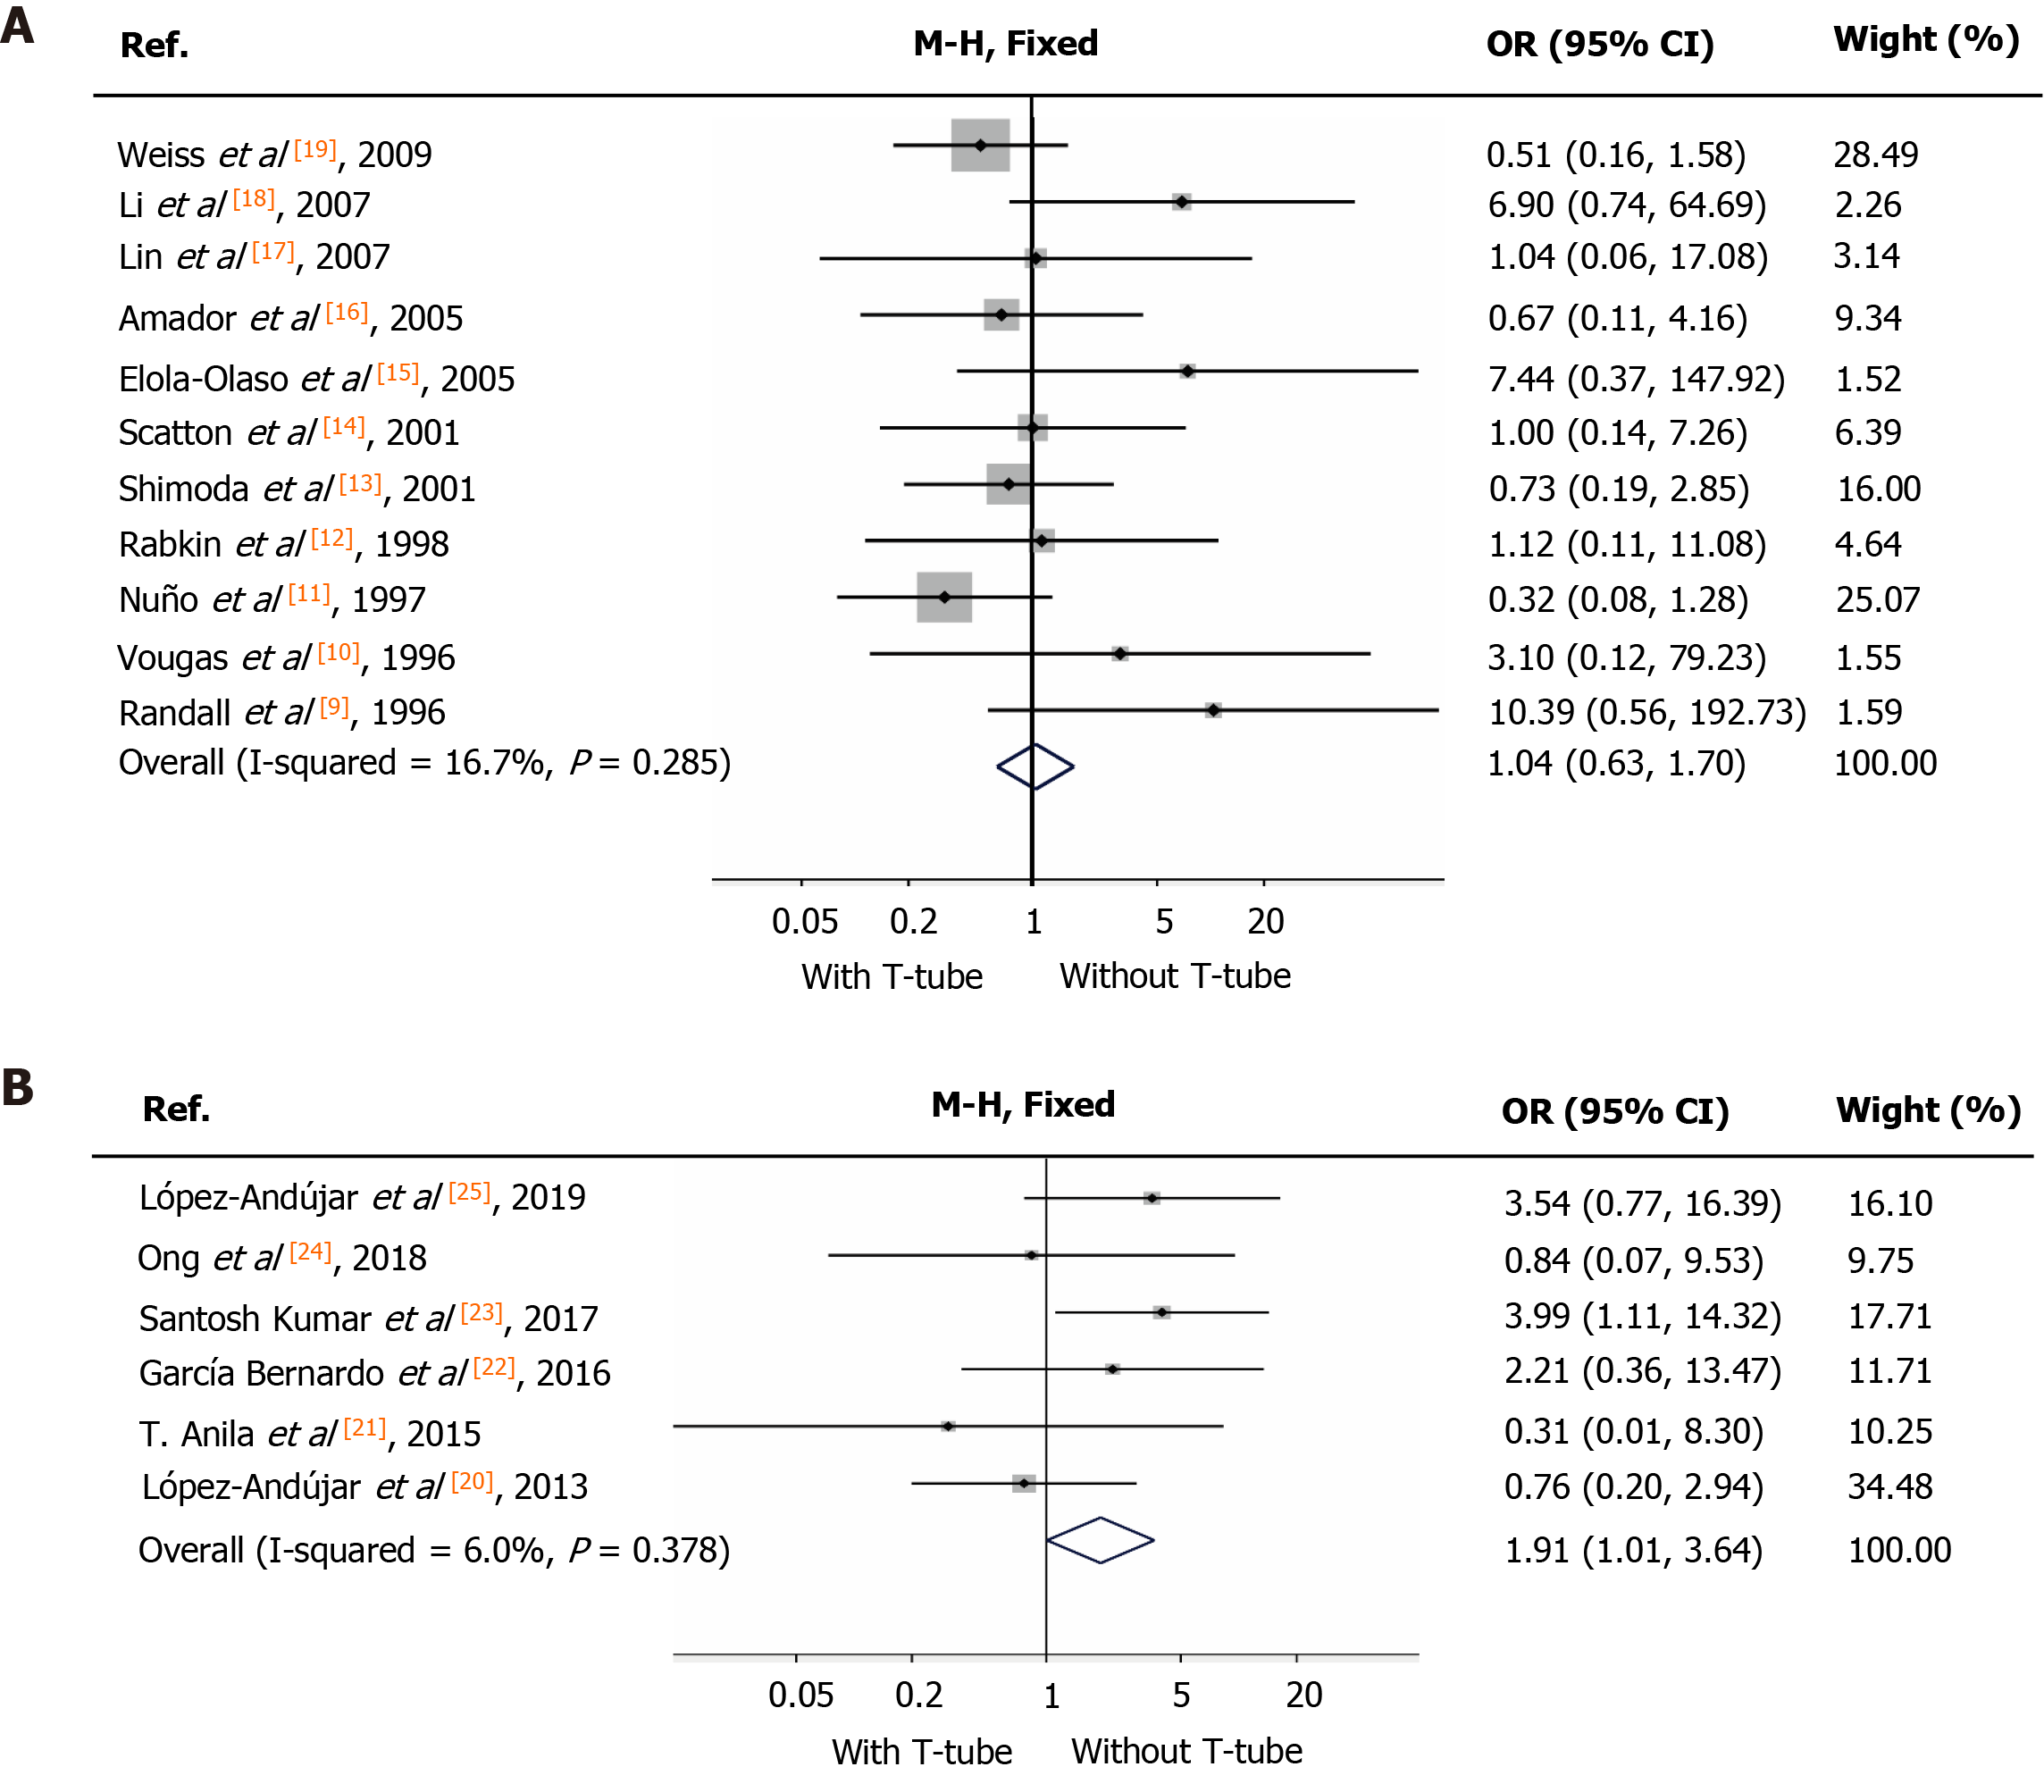
Figure 4 Bile leaks.
A: In the period from 1995 to 2010, odds ratio (OR) for peritonitis between “T-tube” group and “without T-tube” group was calculated with the fixed model. The shape of diamond represents the overall effect of OR with 95% confidence interval (CI). There was no significant difference between the two groups; B: In the period from 2010 to 2020, OR for peritonitis between “T-tube” group and “without T-tube” group was calculated with the fixed model. The shape of diamond represents the overall effect of OR with 95%CI. The incidence rate of bile leaks was significantly higher in “T-tube” group. OR: Odds ratio; CI: Confidence interval.
Figure 5 Cholangitis.
A: In the period from 1995 to 2010, odds ratio (OR) for cholangitis between “T-tube” group and “without T-tube” group was calculated with a random-effects model. The shape of diamond represents the overall effect of OR with 95% confidence interval (CI). There was no significant difference between the two groups; B: In the period from 2010 to 2020, OR for peritonitis between “T-tube” group and “without T-tube” group was calculated with a fixed-effects model. The shape of diamond represents the overall effect of OR with 95%CI. The incidence rate of bile leaks was significantly higher in “T-tube” group. OR: Odds ratio; CI: Confidence interval.
- Citation: Zhao JZ, Qiao LL, Du ZQ, Zhang J, Wang MZ, Wang T, Liu WM, Zhang L, Dong J, Wu Z, Wu RQ. T-tube vs no T-tube for biliary tract reconstruction in adult orthotopic liver transplantation: An updated systematic review and meta-analysis. World J Gastroenterol 2021; 27(14): 1507-1523
- URL: https://www.wjgnet.com/1007-9327/full/v27/i14/1507.htm
- DOI: https://dx.doi.org/10.3748/wjg.v27.i14.1507


