Copyright
©The Author(s) 2021.
World J Gastroenterol. Apr 7, 2021; 27(13): 1341-1353
Published online Apr 7, 2021. doi: 10.3748/wjg.v27.i13.1341
Published online Apr 7, 2021. doi: 10.3748/wjg.v27.i13.1341
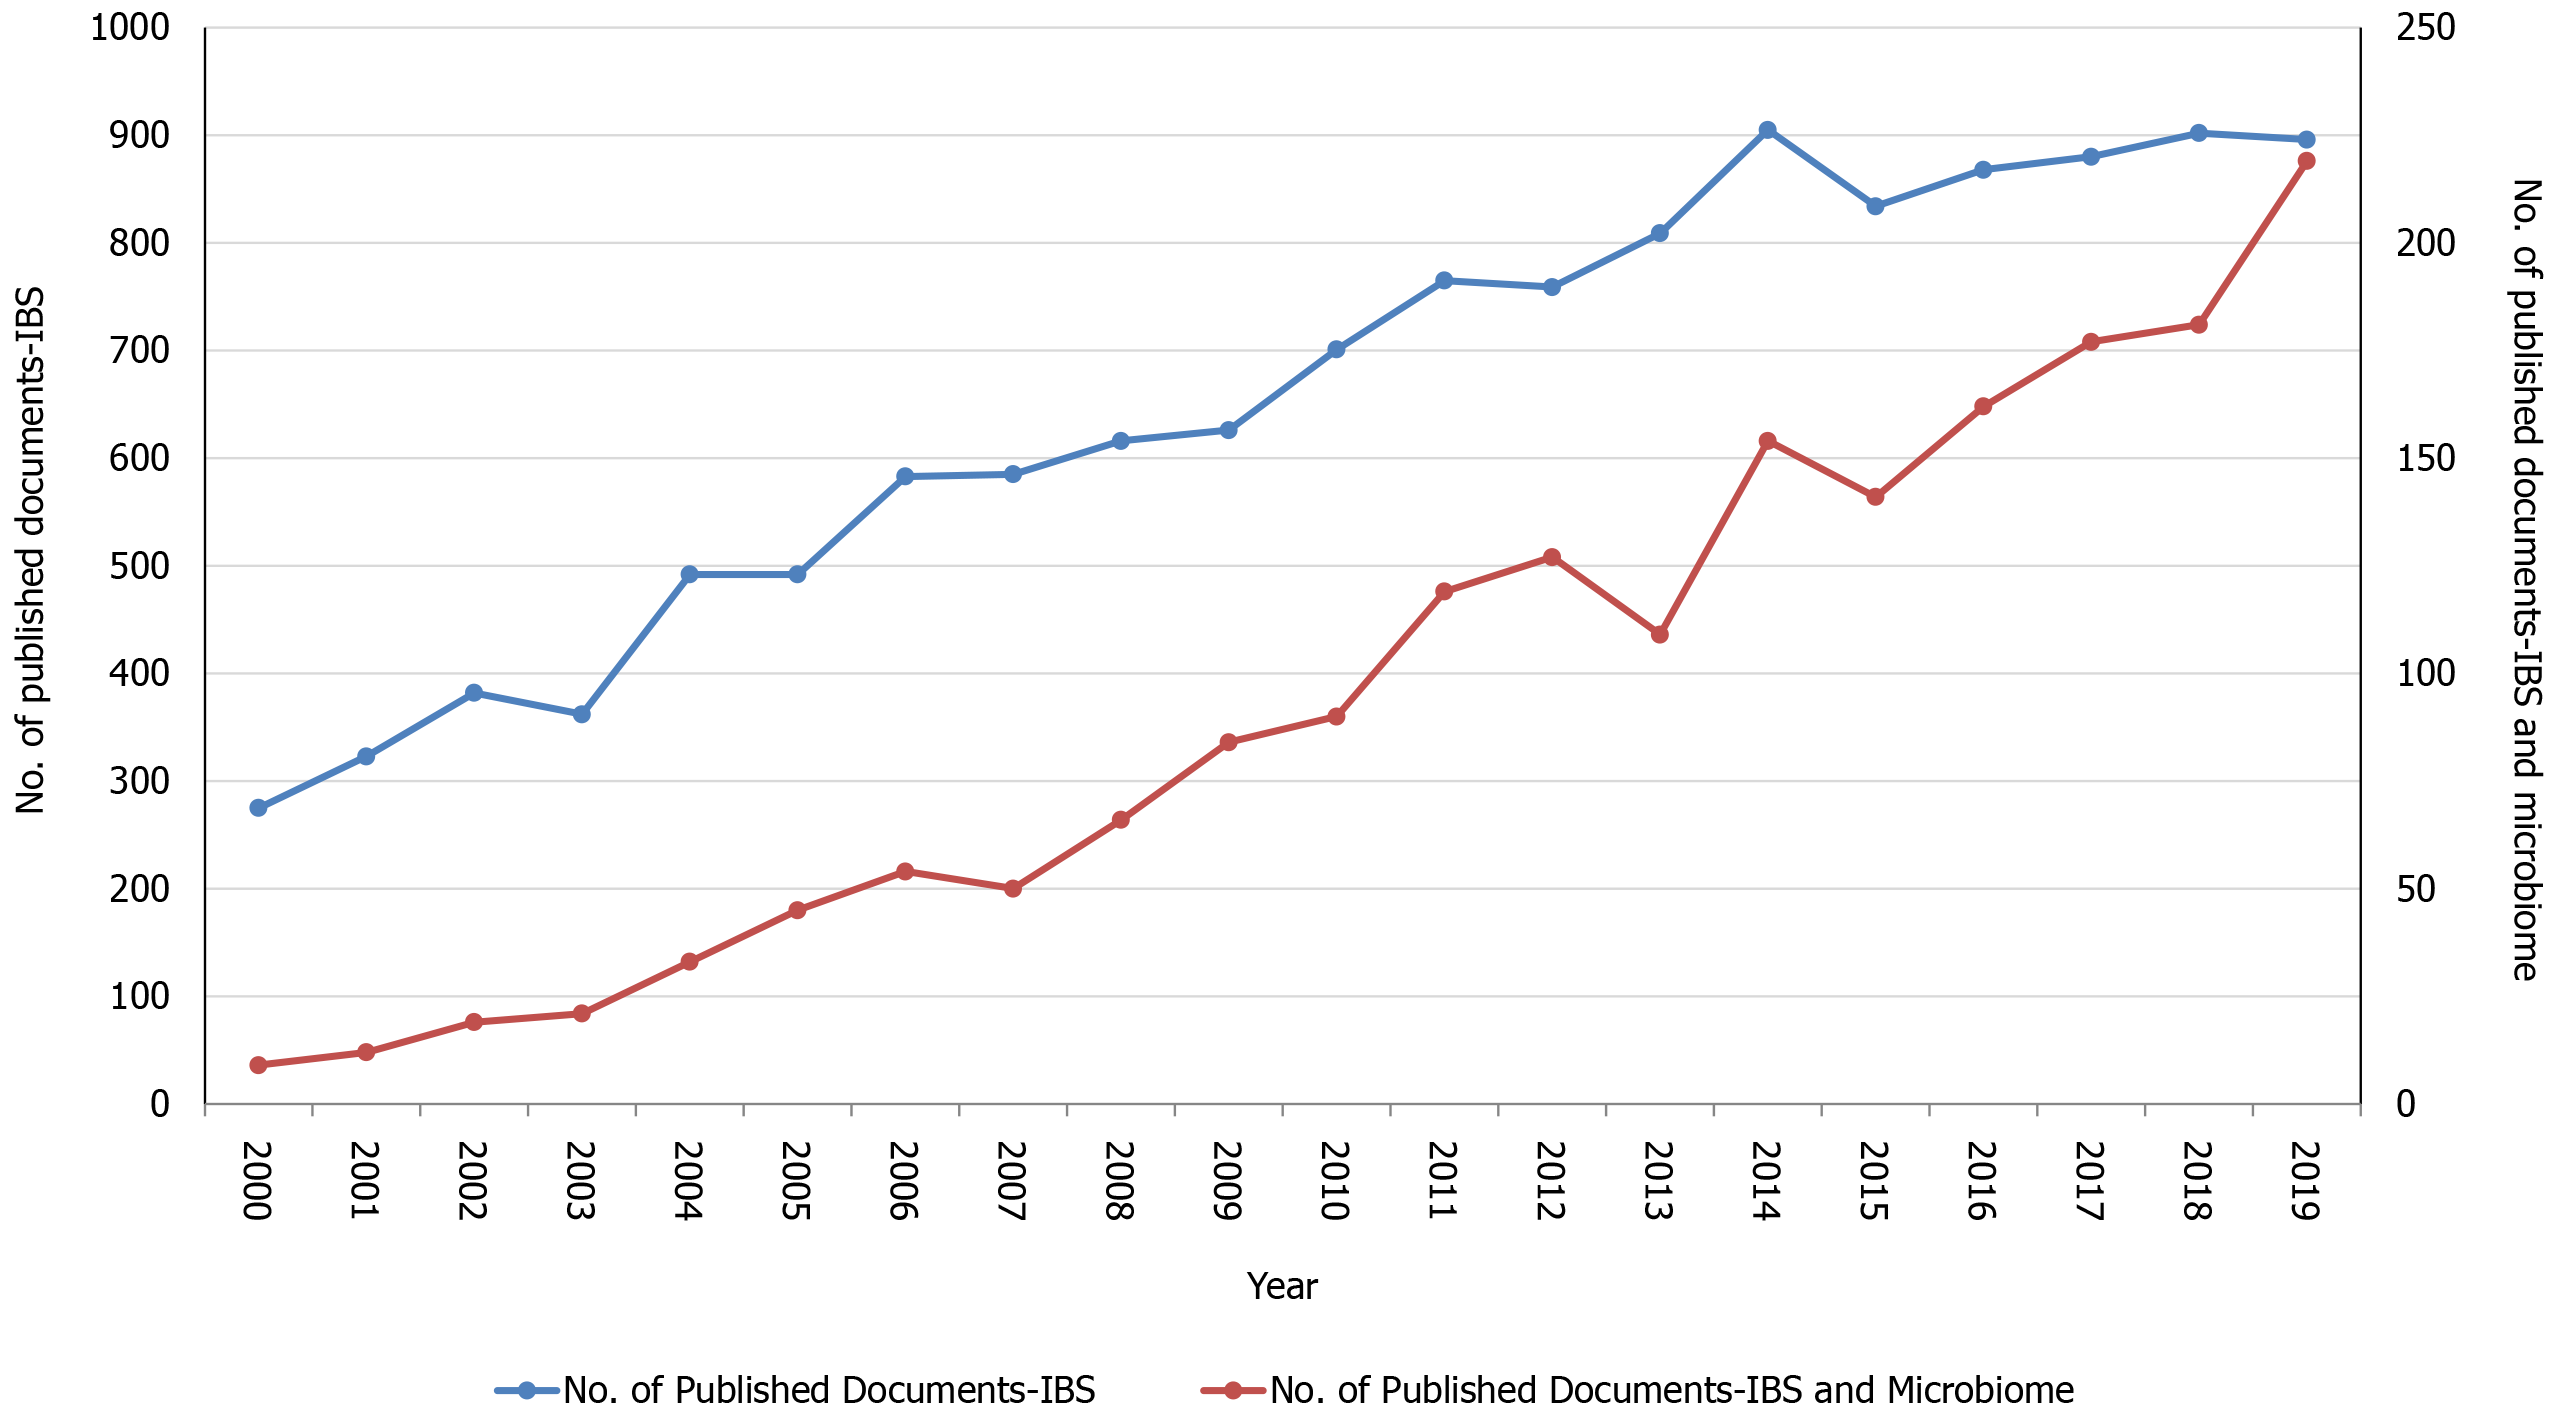
Figure 1 The annual number of publications related to irritable bowel syndrome and the microbiome from 2000 to 2019.
IBS: Irritable bowel syndrome.
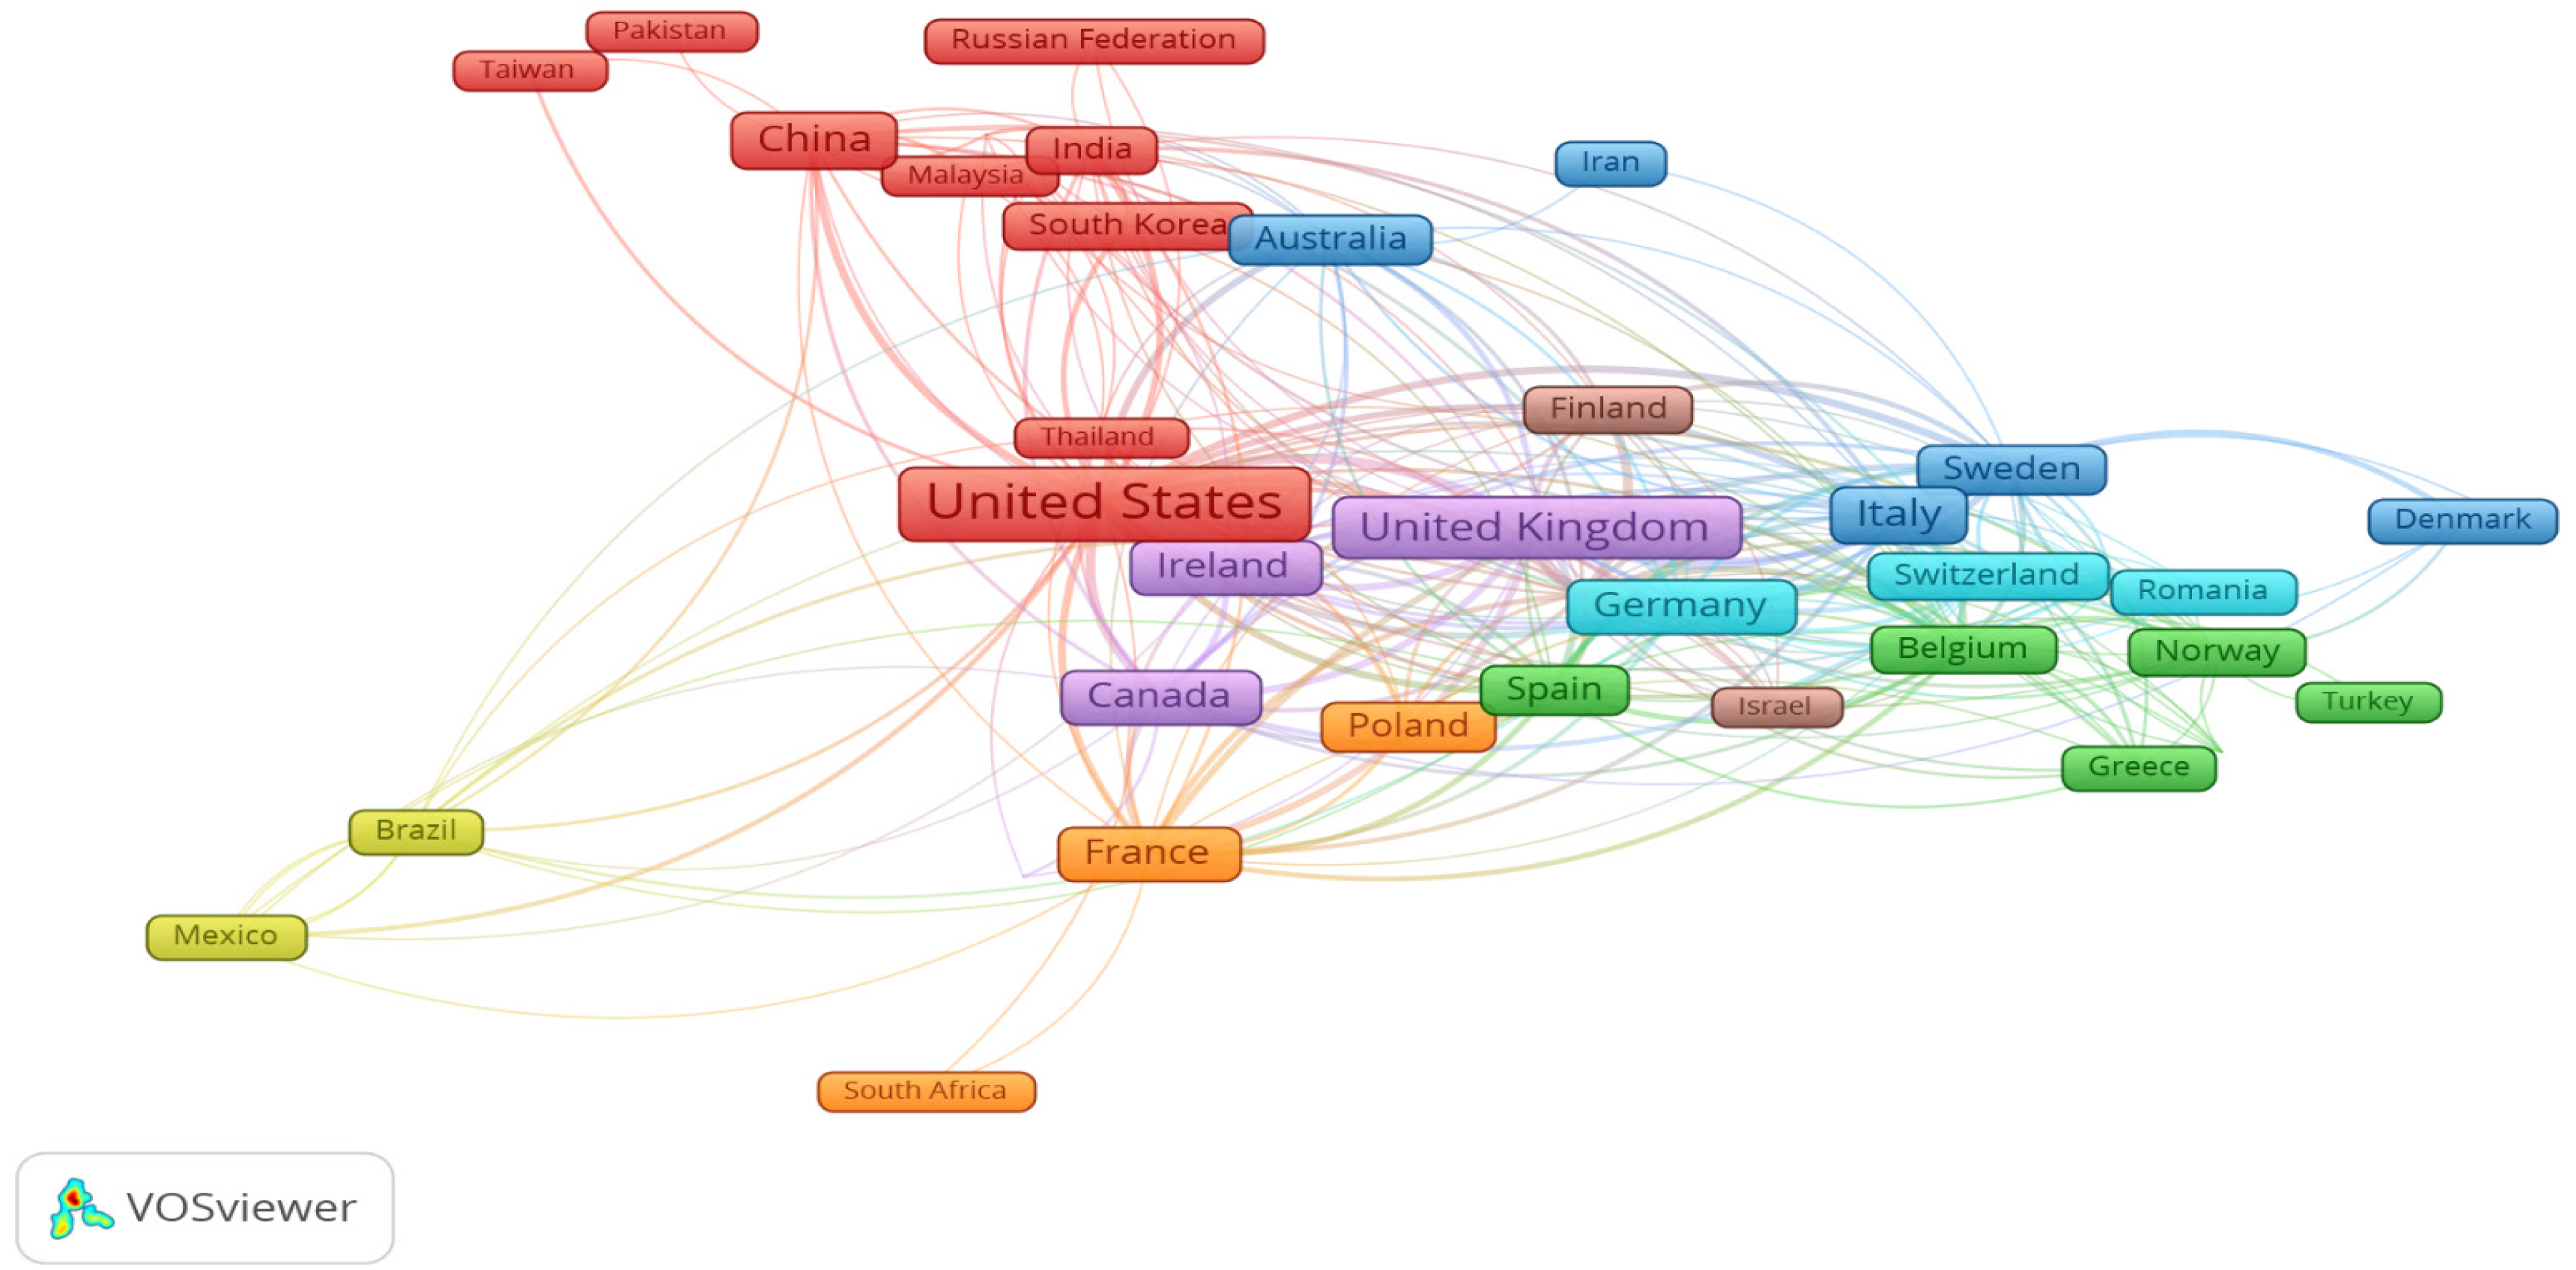
Figure 2 Network visualization map for the collaboration among the 40 most productive countries on the microbiome in irritable bowel syndrome research according to the number of publications in the last two decades (2000–2019).
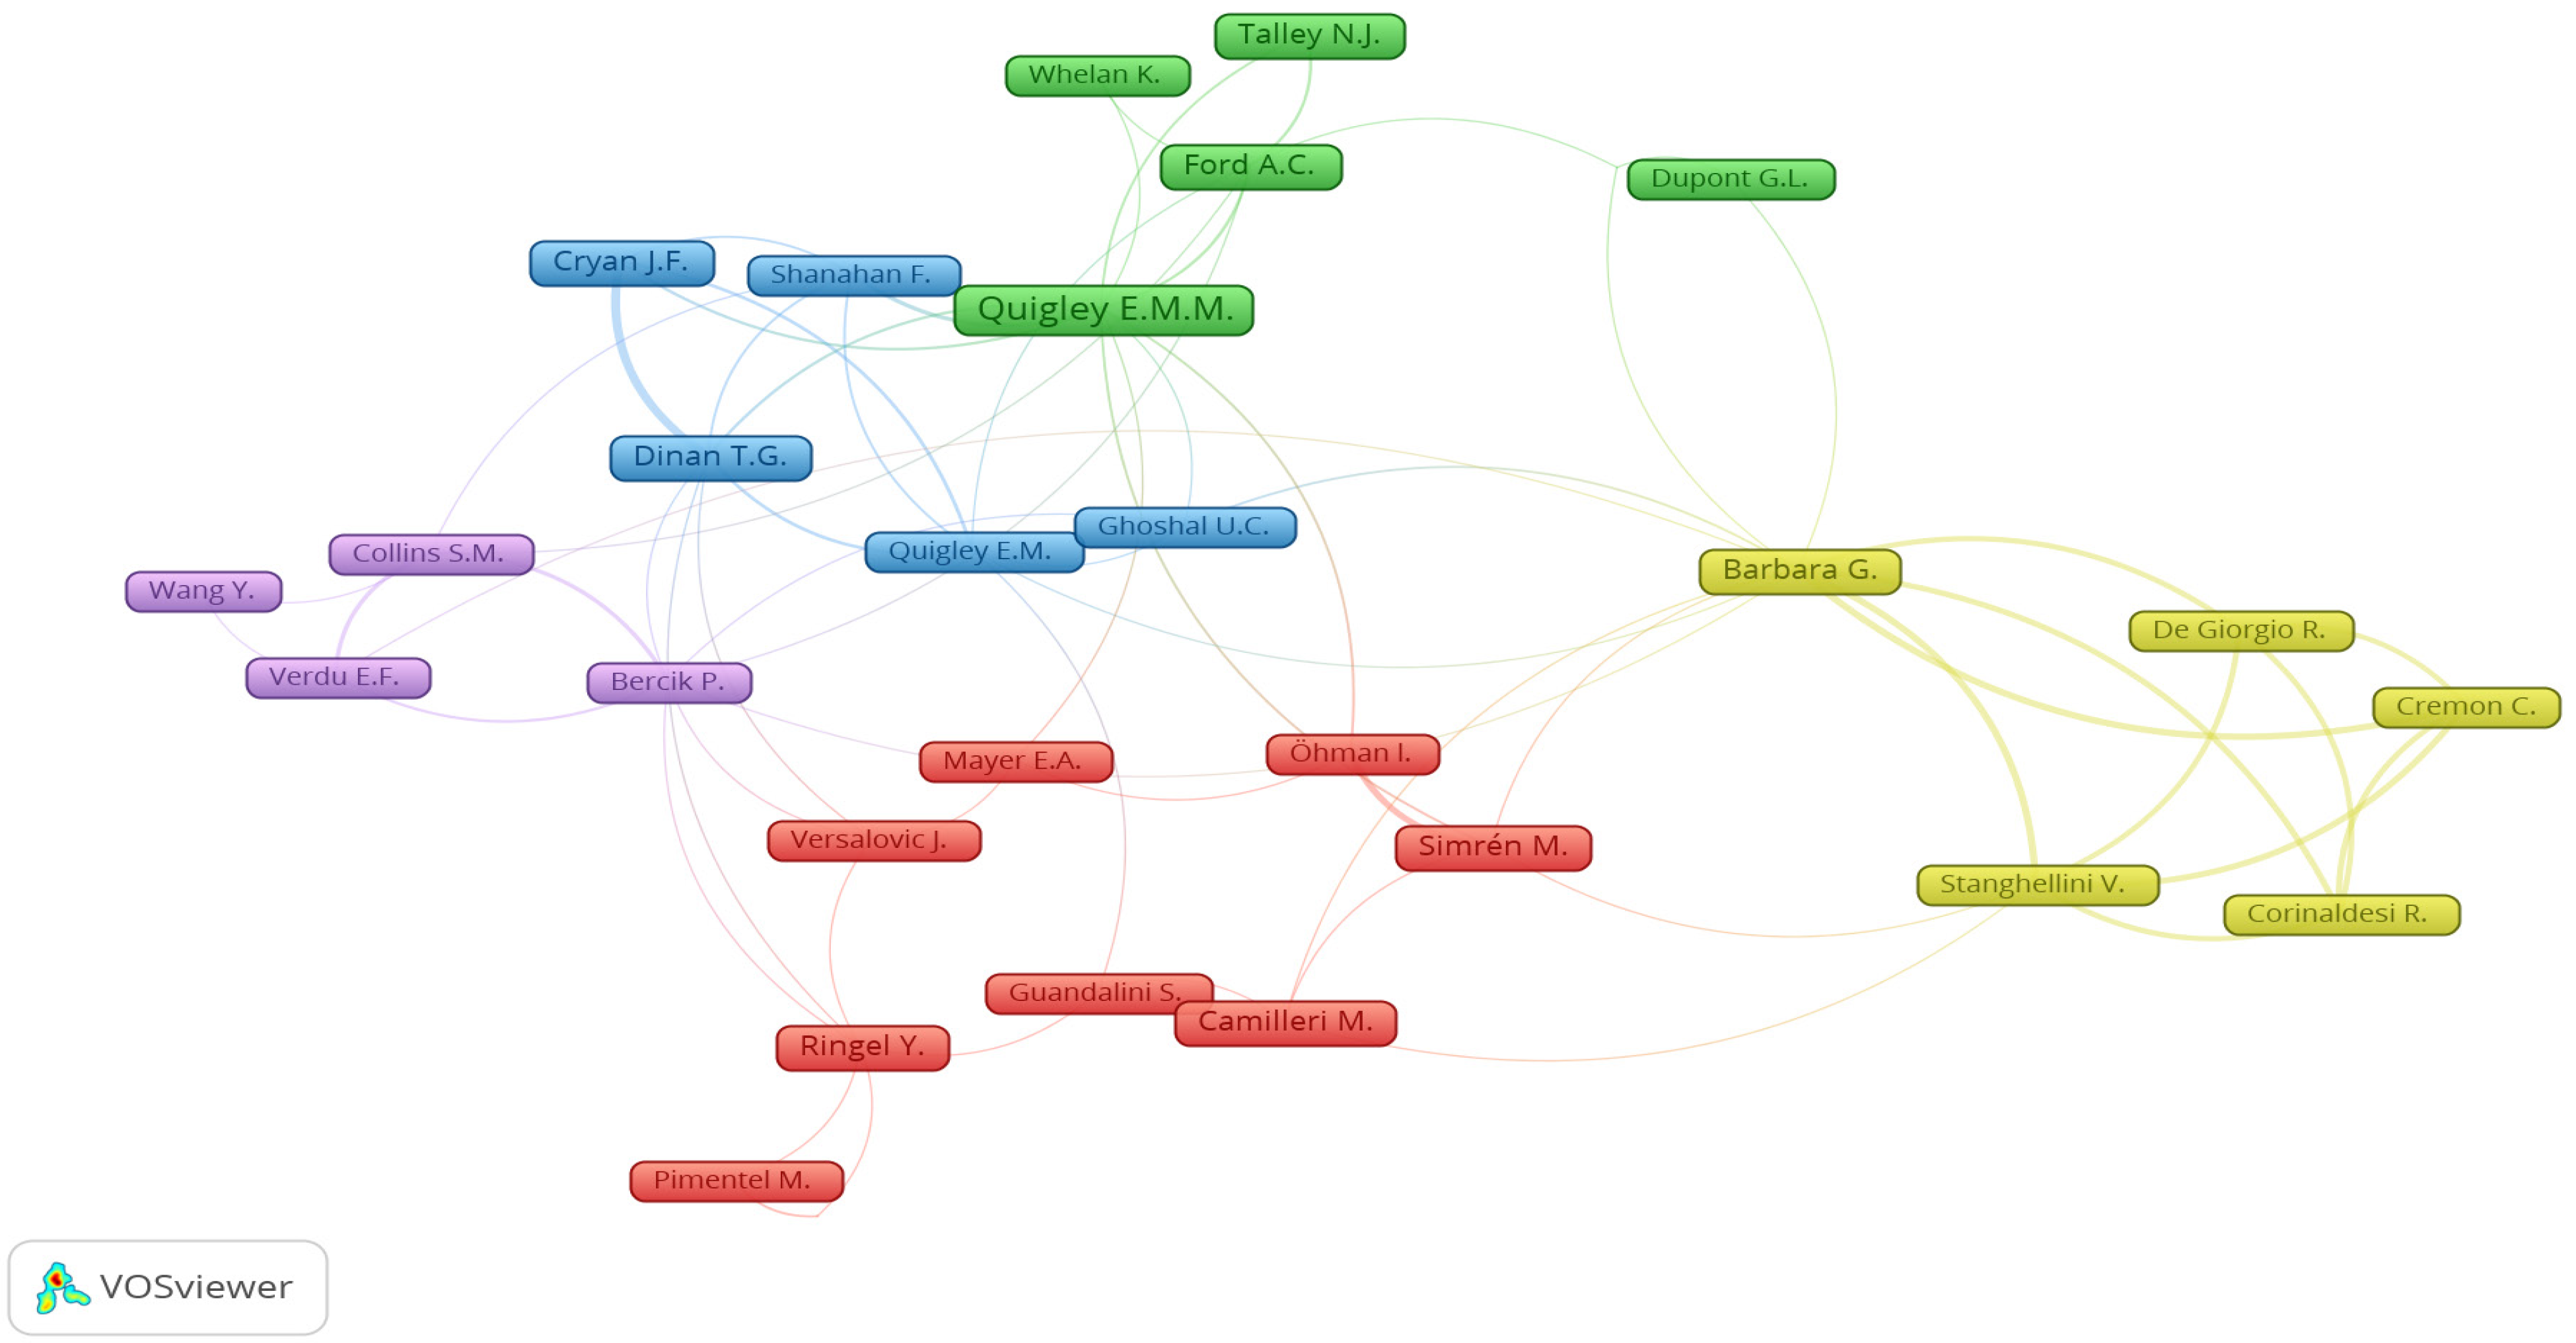
Figure 3 Network visualization map for the collaboration among the 32 most productive authors on the microbiome in irritable bowel syndrome research according to the number of publications in the last two decades (2000–2019).
Figure 4 Network visualization map for the terms with high co-occurrence frequencies, based on the titles and abstracts of documents related to the microbiome in irritable bowel syndrome research published in the last two decades (2000–2019).
- Citation: Zyoud SH, Smale S, Waring WS, Sweileh W, Al-Jabi SW. Global research trends in the microbiome related to irritable bowel syndrome: A bibliometric and visualized study. World J Gastroenterol 2021; 27(13): 1341-1353
- URL: https://www.wjgnet.com/1007-9327/full/v27/i13/1341.htm
- DOI: https://dx.doi.org/10.3748/wjg.v27.i13.1341


