Copyright
©The Author(s) 2021.
World J Gastroenterol. Mar 28, 2021; 27(12): 1240-1254
Published online Mar 28, 2021. doi: 10.3748/wjg.v27.i12.1240
Published online Mar 28, 2021. doi: 10.3748/wjg.v27.i12.1240
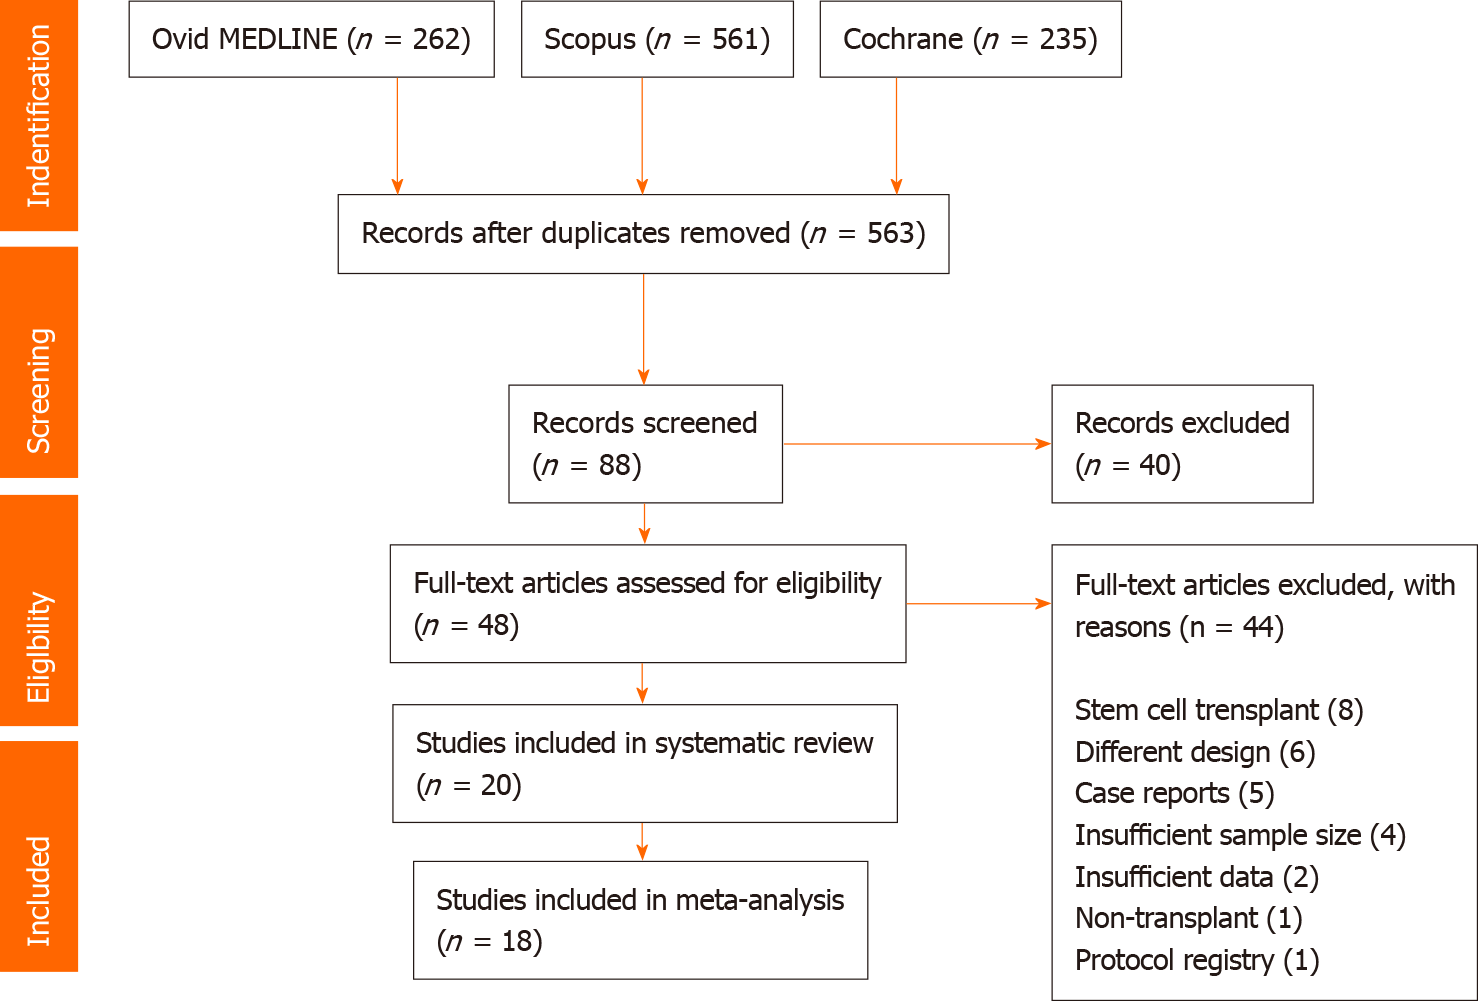
Figure 1
PRISMA flowchart of article search and selection.
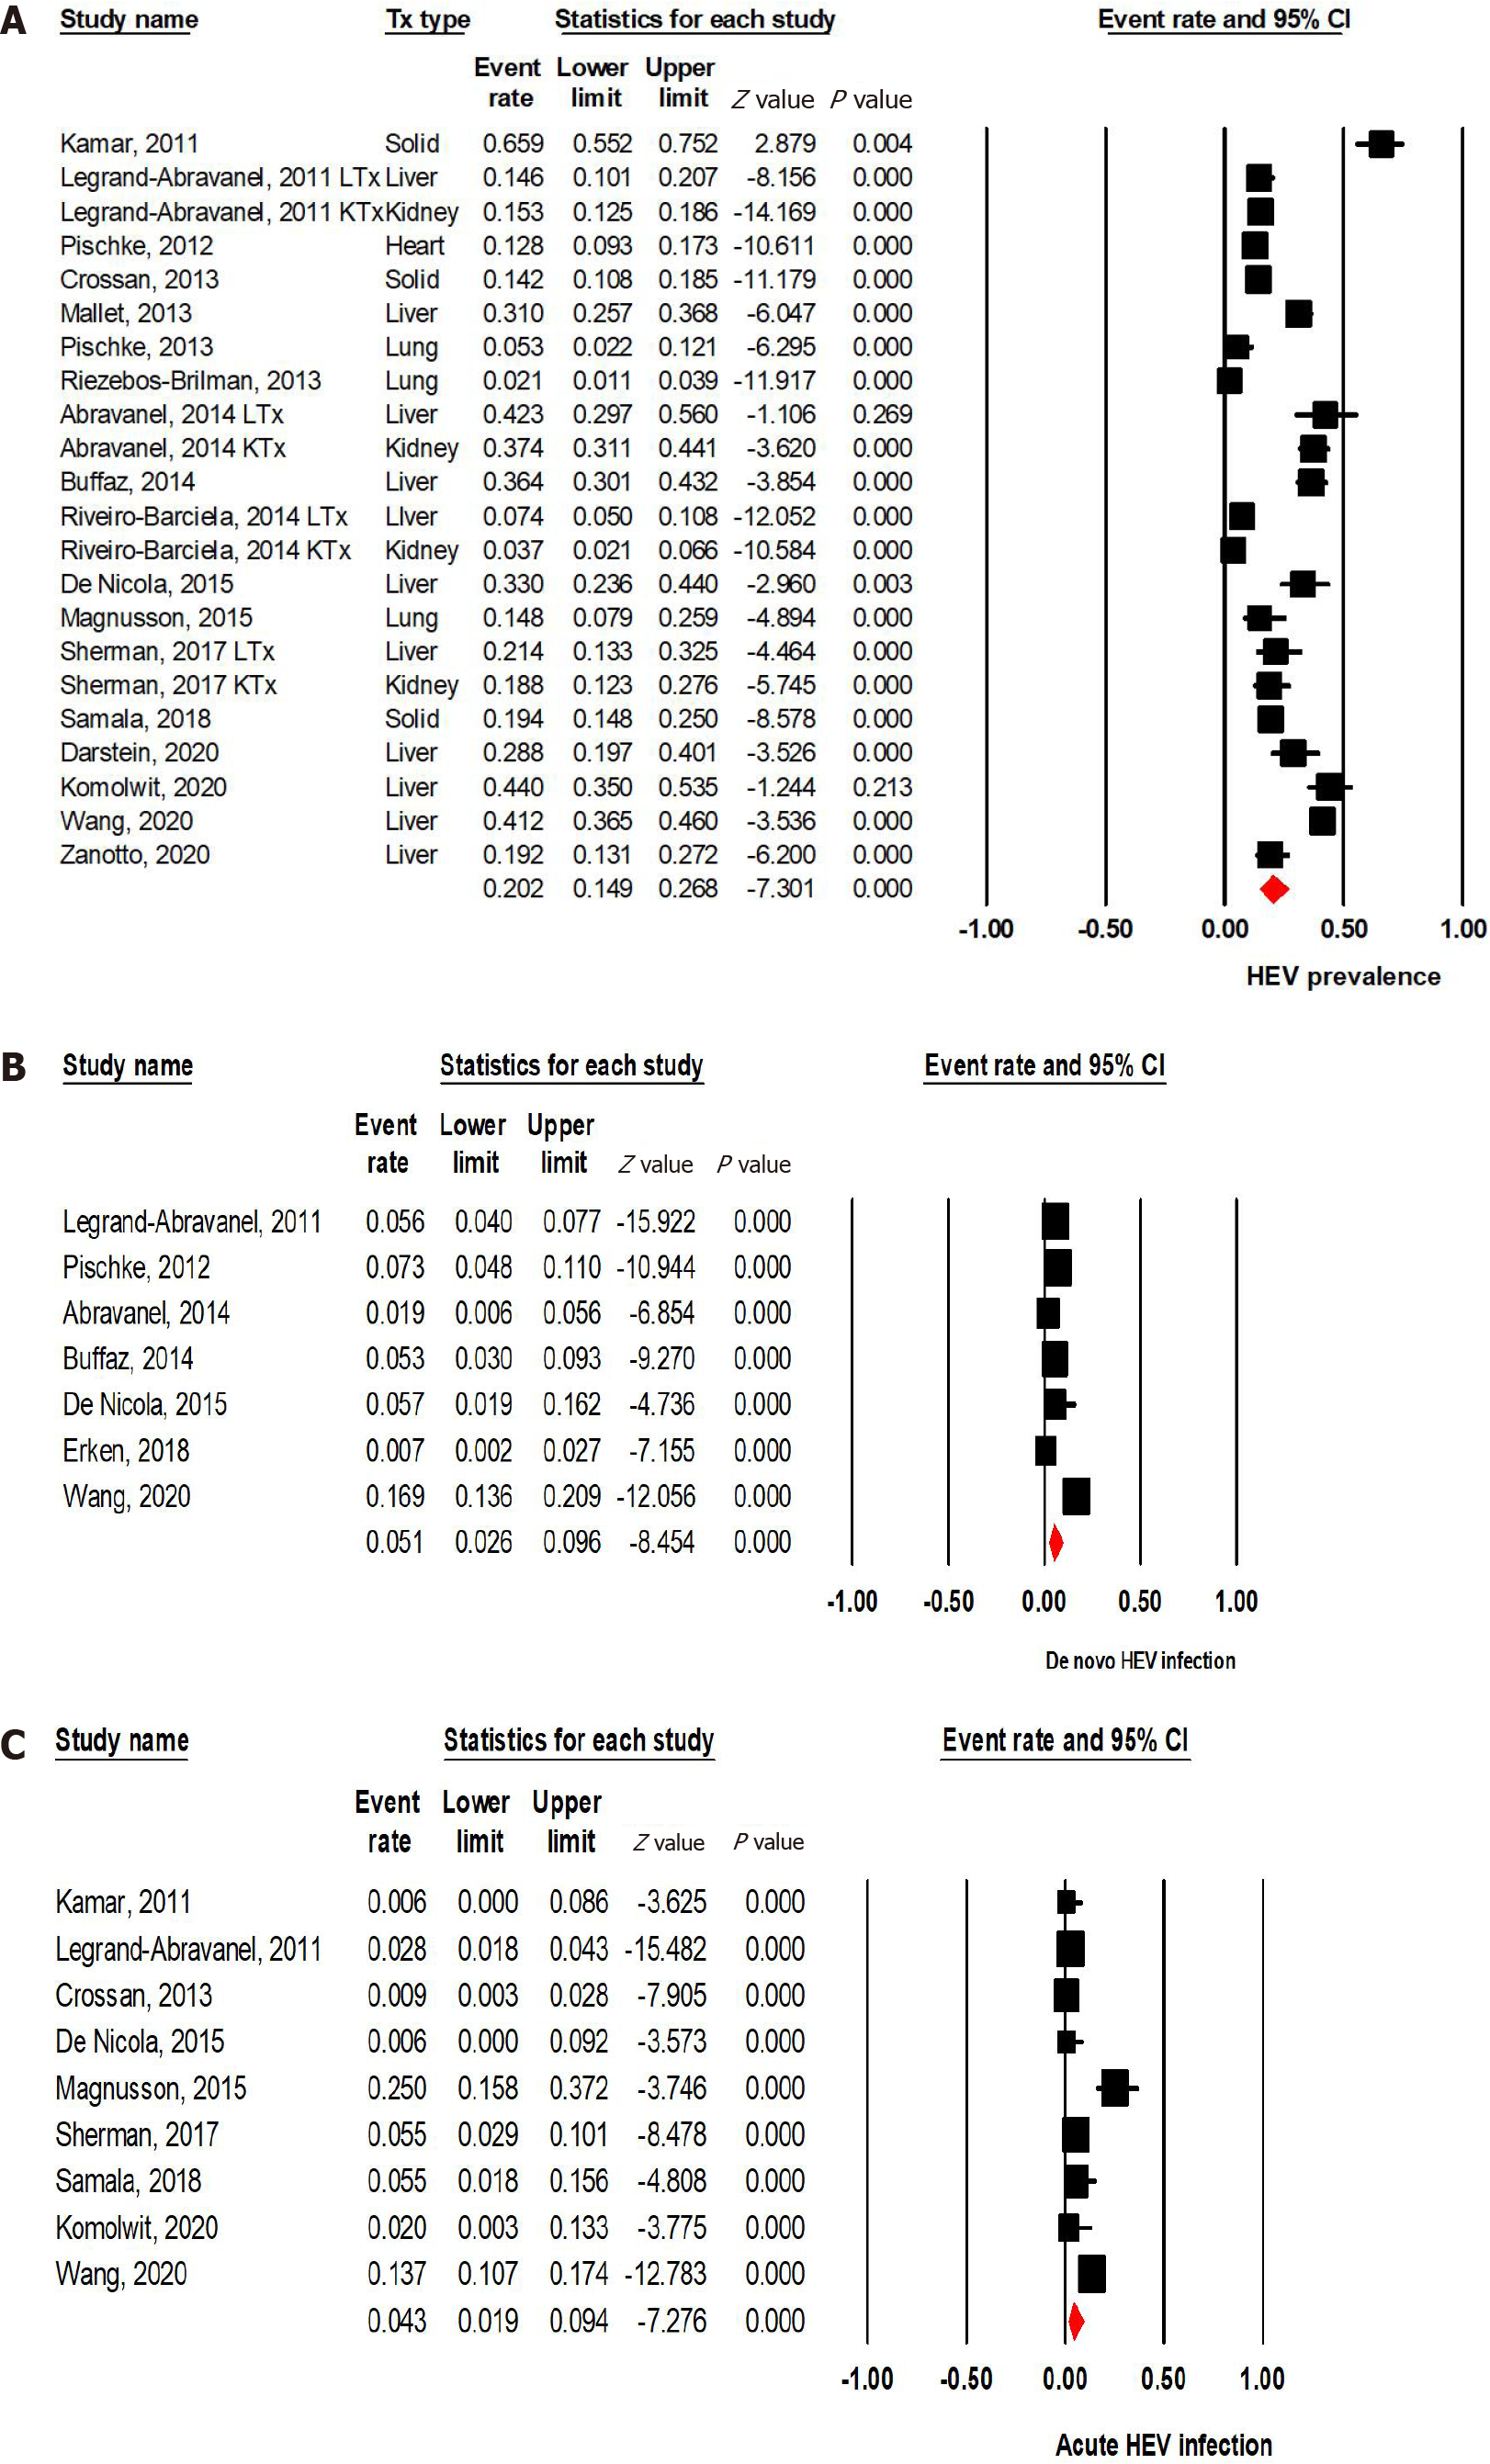
Figure 2 Forest plots of meta-analysis.
A: The pooled prevalence of hepatitis E virus (HEV) infection (I2 95.3%; Egger’s intercept 0.060); B: The pooled prevalence of de novo HEV infection (I2 90.8%; Egger’s intercept 0.054); C: The pooled prevalence of acute HEV infection (I2 90.7%; Egger’s intercept 0.136). CI: Confidence interval; HEV: Hepatitis E virus.
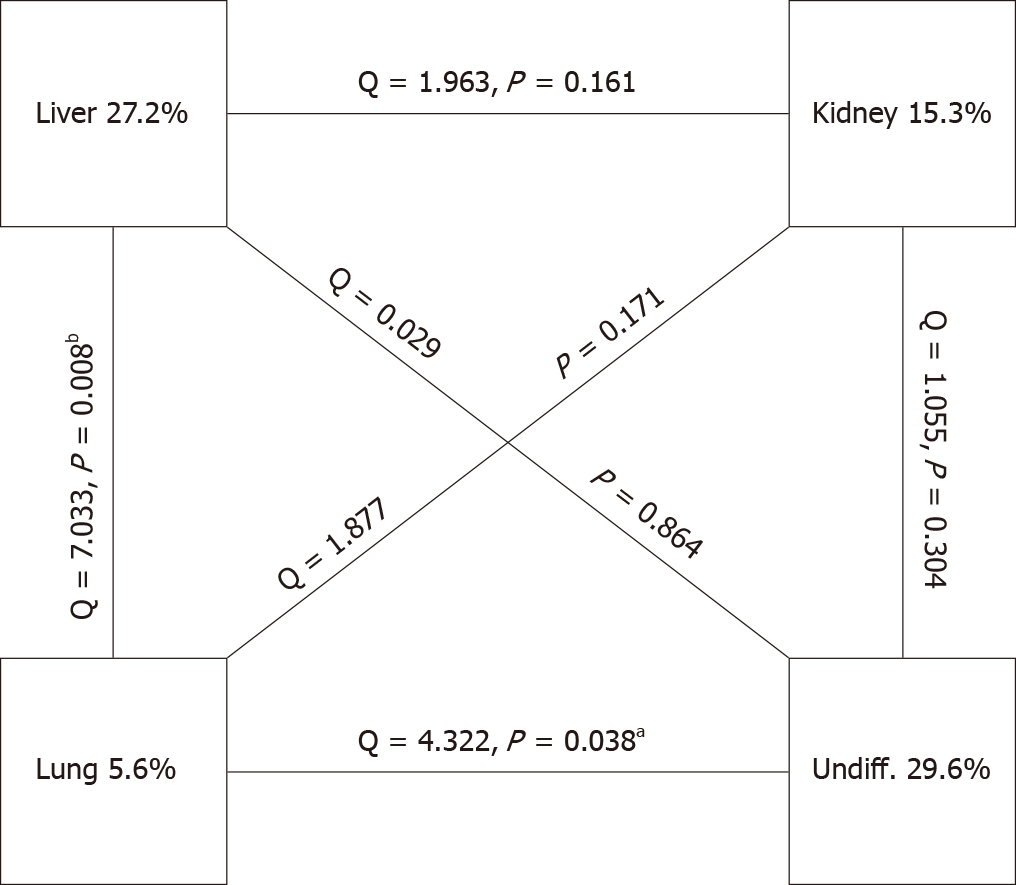
Figure 3 Network association analysis.
aP < 0.05; bP < 0.01.
- Citation: Hansrivijit P, Trongtorsak A, Puthenpura MM, Boonpheng B, Thongprayoon C, Wijarnpreecha K, Choudhury A, Kaewput W, Mao SA, Mao MA, Jadlowiec CC, Cheungpasitporn W. Hepatitis E in solid organ transplant recipients: A systematic review and meta-analysis. World J Gastroenterol 2021; 27(12): 1240-1254
- URL: https://www.wjgnet.com/1007-9327/full/v27/i12/1240.htm
- DOI: https://dx.doi.org/10.3748/wjg.v27.i12.1240


