Copyright
©The Author(s) 2021.
World J Gastroenterol. Mar 21, 2021; 27(11): 1076-1089
Published online Mar 21, 2021. doi: 10.3748/wjg.v27.i11.1076
Published online Mar 21, 2021. doi: 10.3748/wjg.v27.i11.1076
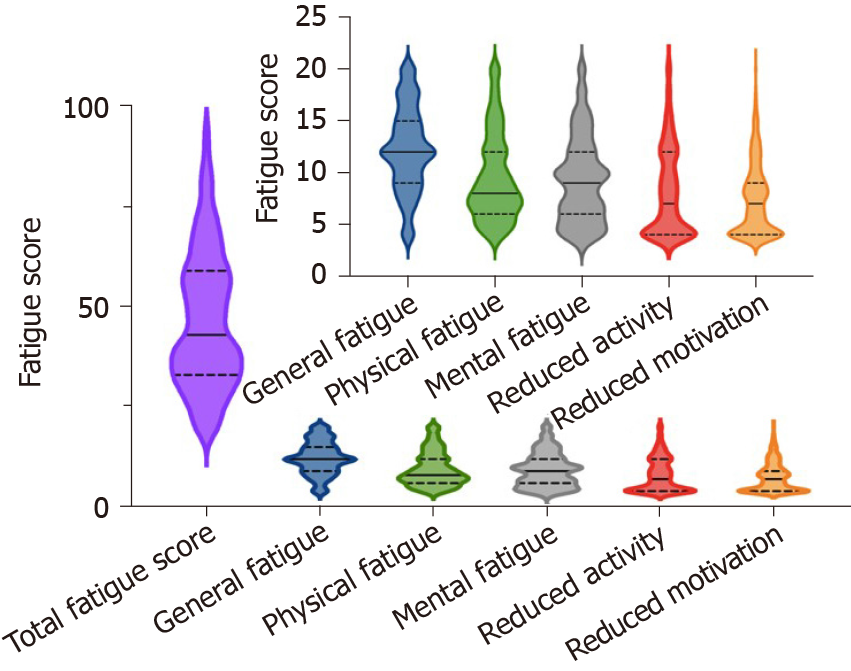
Figure 1 Fatigue score in the inflammatory bowel disease patients.
The solid line indicates the median, and the dotted line indicates the interquartile range. The small insert within the graphs in Figure 1 enlarges the scores of the five subscales of multidimensional fatigue inventory (general fatigue, physical fatigue, reduced activity, reduced motivation, and mental fatigue) in the inflammatory bowel disease patients.
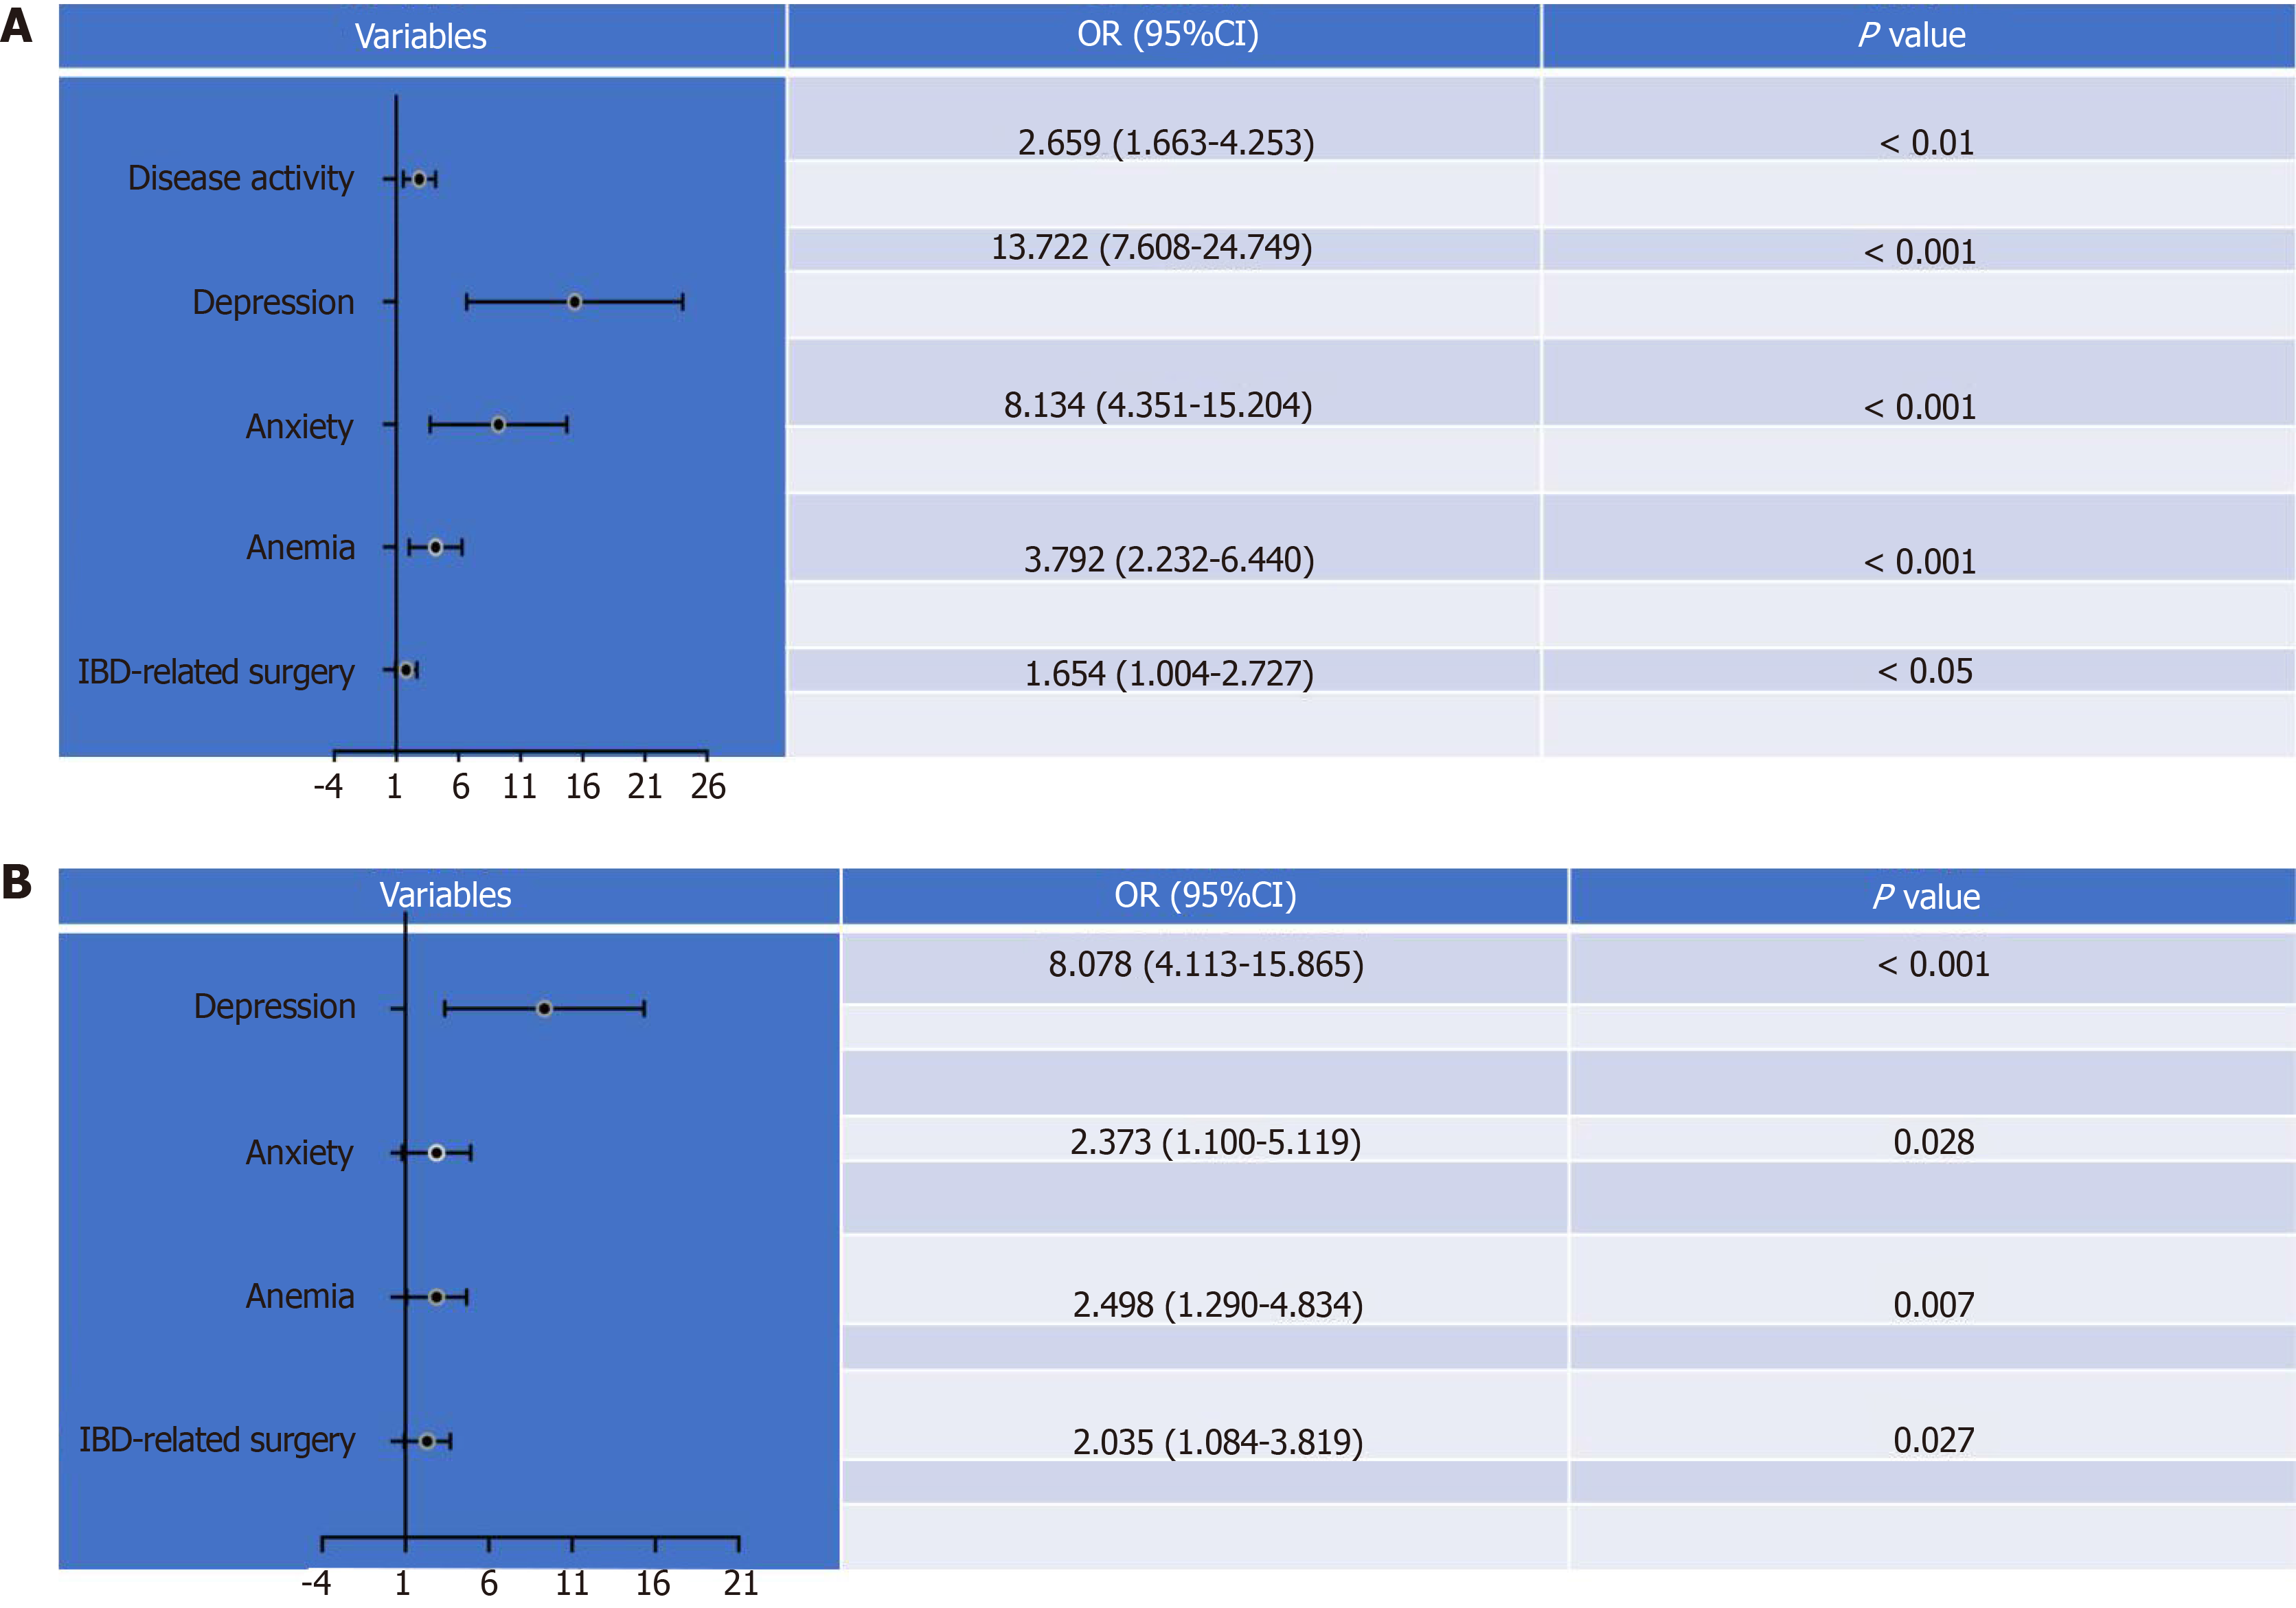
Figure 2 Factors associated with the presence of fatigue.
A: Univariate analysis; B: Multivariate analysis. OR: Odds ratio; IBD: Inflammatory bowel disease.
Figure 3 Quality of life score in the inflammatory bowel disease patients.
The solid line indicates the median, and the dotted line indicates the interquartile range. The small insert within the graphs in Figure 3 enlarges the scores of the four domains of short inflammatory bowel disease questionnaire (bowel symptoms, systemic symptoms, emotional function, and social function) in the inflammatory bowel disease patients.
Figure 4 Fatigue and quality of life.
A: Correlation between total fatigue scores and quality of life scores (total quality of life scores: Spearman’s r = -0.831, P < 0.0001; emotional function: Spearman’s r = -0.721, P < 0.0001) in the inflammatory bowel disease patients; B: Correlation between total quality of life scores and fatigue (general fatigue: Spearman’s r = -0.785, P < 0.0001; reduced activity: Spearman’s r = -0.731, P < 0.0001; psychological fatigue: Spearman’s r = -0.704, P < 0.0001) in the inflammatory bowel disease patients.
Figure 5 Fatigue score in inflammatory bowel disease patients with full-time jobs.
The solid line indicates the median, and the dotted line indicates the interquartile range. The small insert within the graphs in Figure 5 enlarges the scores of the five subscales of multidimensional fatigue inventory (general fatigue, physical fatigue, reduced activity, reduced motivation, and mental fatigue) in the inflammatory bowel disease patients.
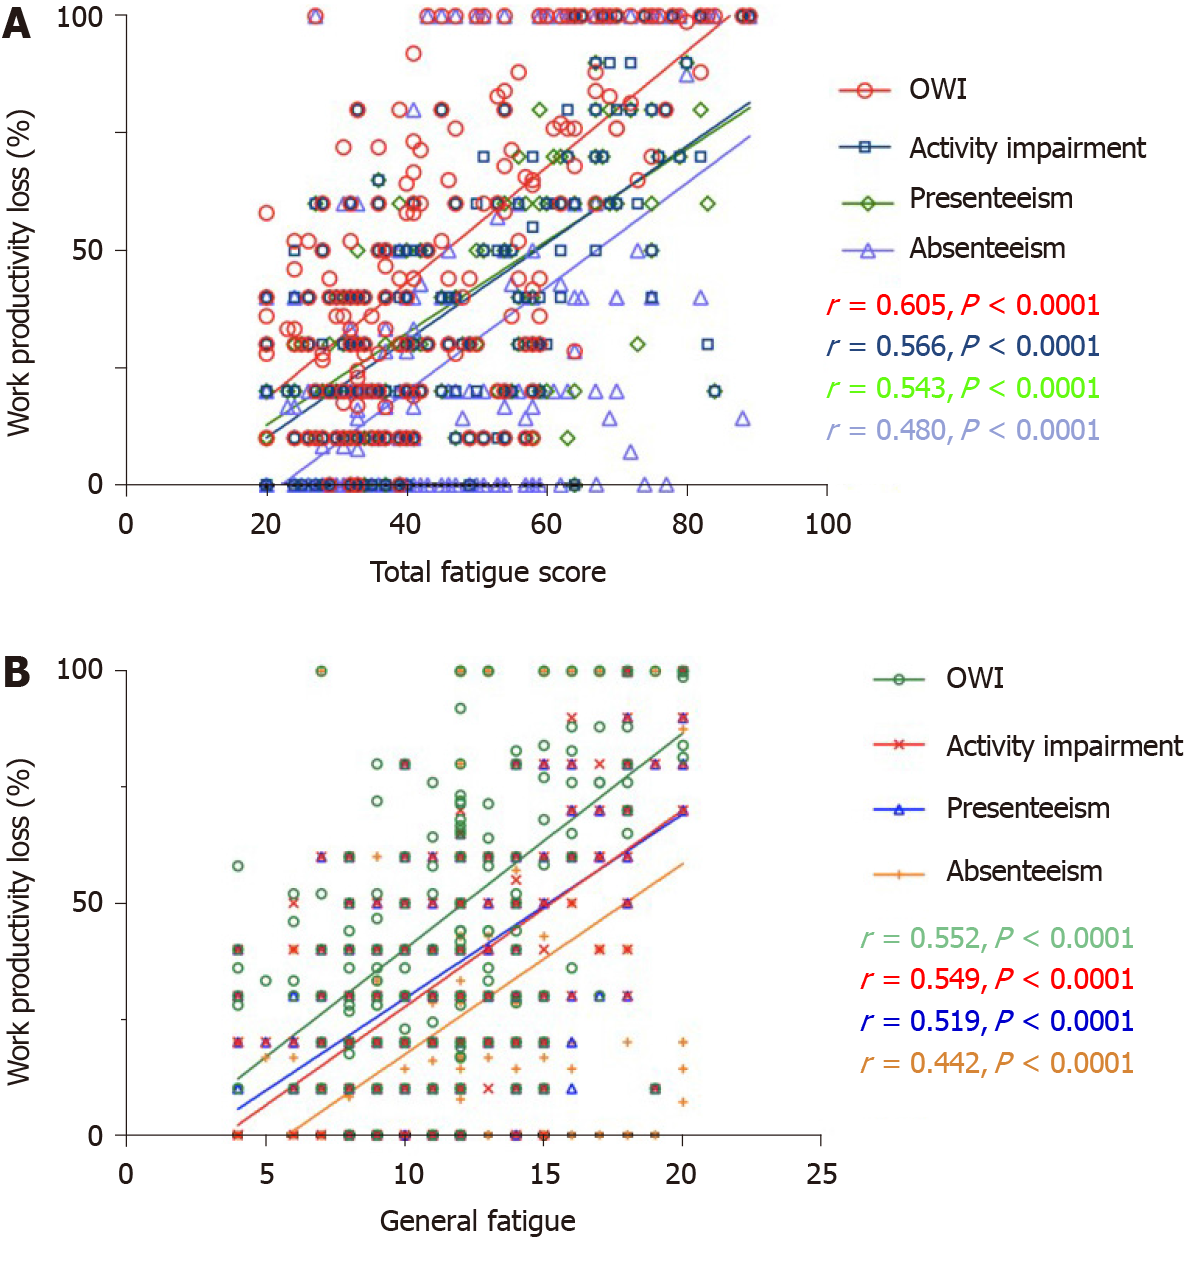
Figure 6 Fatigue and work productivity.
A: Correlation between total fatigue scores and work productivity loss [overall work impairment: Spearman’s r = 0.605, P < 0.0001; activity impairment: Spearman’s r = 0.566, P < 0.0001; presenteeism: Spearman’s r = 0.543, P < 0.0001; absenteeism: Spearman’s r = 0.480, P < 0.0001] in inflammatory bowel disease patients with full-time jobs; B: Correlation between general fatigue and work productivity loss (overall work impairment: Spearman’ s r = 0.552, P < 0.0001; activity impairment: Spearman’s r = 0.552, P < 0.0001; presenteeism: Spearman’s r = 0.552, P < 0.0001; absenteeism: Spearman’s r = 0.552, P < 0.0001) in inflammatory bowel disease patients with full-time jobs. OWI: Overall work impairment.
- Citation: Gong SS, Fan YH, Lv B, Zhang MQ, Xu Y, Zhao J. Fatigue in patients with inflammatory bowel disease in Eastern China. World J Gastroenterol 2021; 27(11): 1076-1089
- URL: https://www.wjgnet.com/1007-9327/full/v27/i11/1076.htm
- DOI: https://dx.doi.org/10.3748/wjg.v27.i11.1076


