Copyright
©The Author(s) 2020.
World J Gastroenterol. Mar 7, 2020; 26(9): 904-917
Published online Mar 7, 2020. doi: 10.3748/wjg.v26.i9.904
Published online Mar 7, 2020. doi: 10.3748/wjg.v26.i9.904
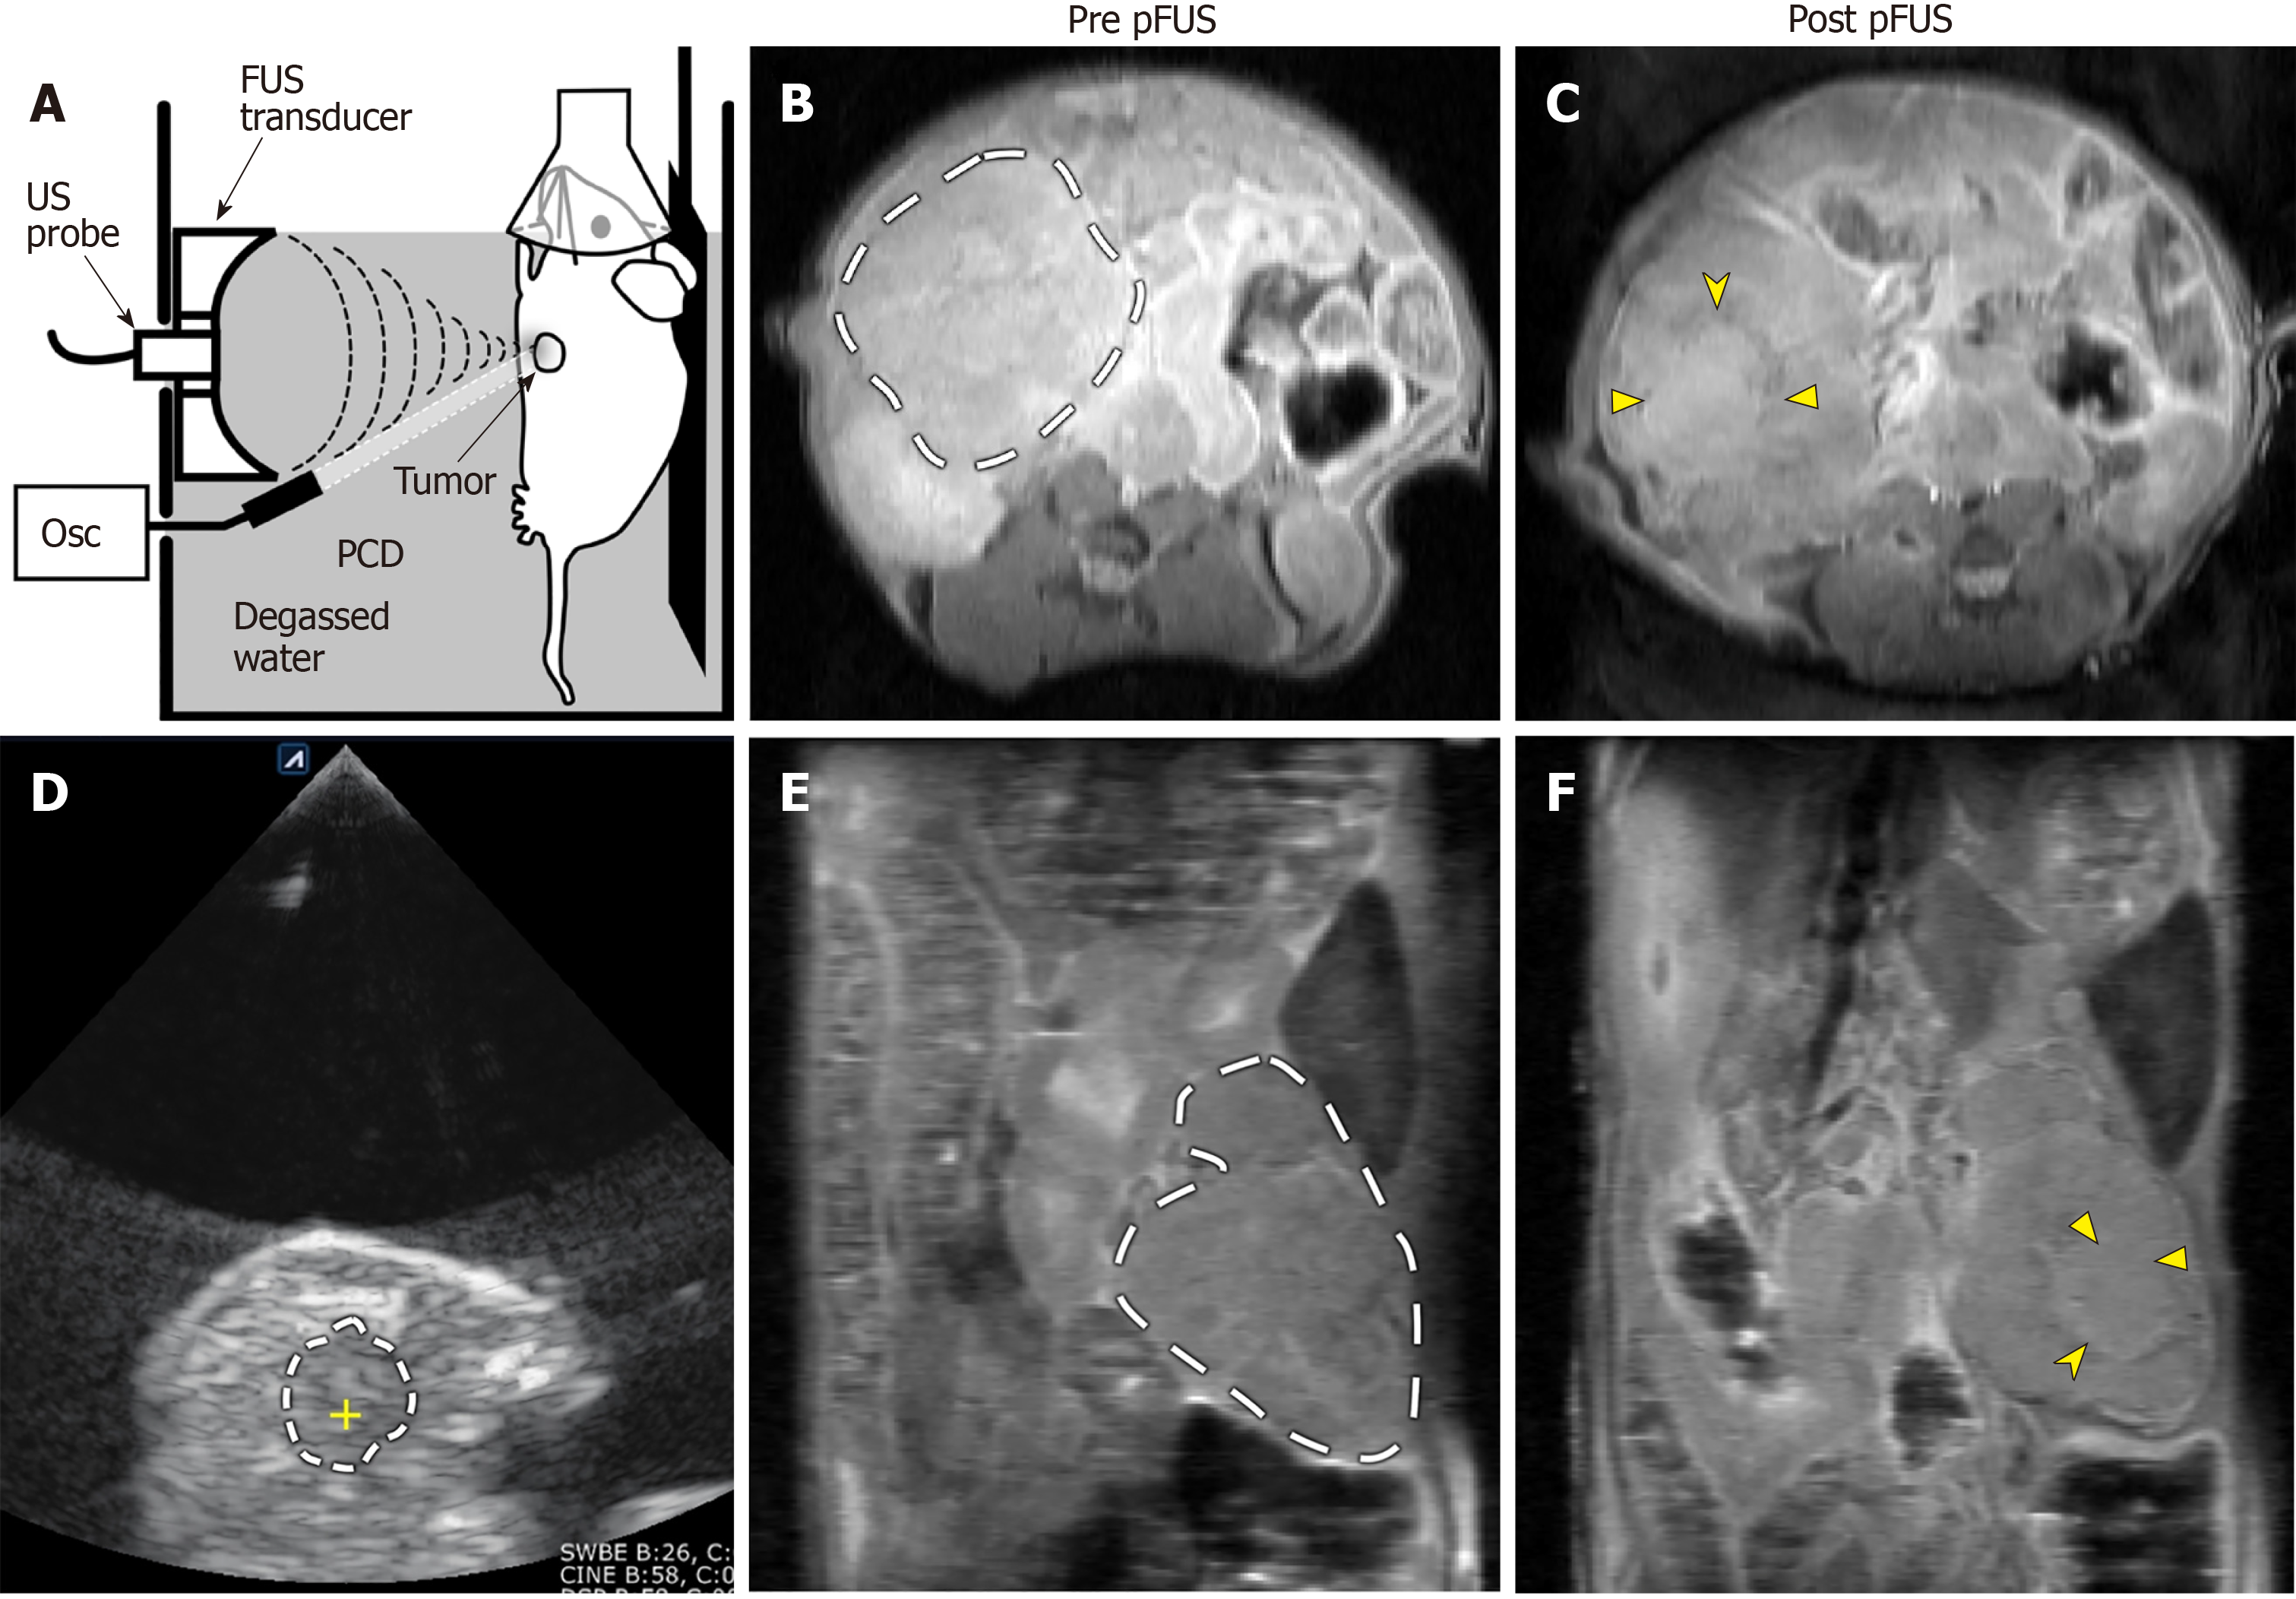
Figure 1 Representative images of pulsed focused ultrasound treatment and 14T magnetic resonance imaging assessment.
(A) Sagittal plane line drawing and (D) axial plane ultrasound (US) image of a pulsed focused ultrasound (pFUS) treatment. Animals were anesthetized, placed on a mobile platform, and partially submerged in degassed water. Tumors were identified using B-mode images from a diagnostic US probe. The KPC mouse tumors generally appear as predominantly hypoechoic masses along the distribution of the pancreas (dashed line in D; the yellow cross within marks the focus of the pFUS transducer). Axial (B and C) and coronal (E and F) pre- and post-treatment proton density weighted anatomic images from a different KPC mouse. Dashed lines in B and E demarcate the pancreatic tumor mass. The treated area demonstrates predominantly isointense signal (solid arrowheads in C and F), with a peripheral ring of hypointense signal (notched arrowheads in C and F), most likely representing sequelae of hyperacute hemorrhage. pFUS: Pulsed focused ultrasound; SC: Subcutaneous; Osc: Oscilloscope; PCD: Passive cavitation detector.
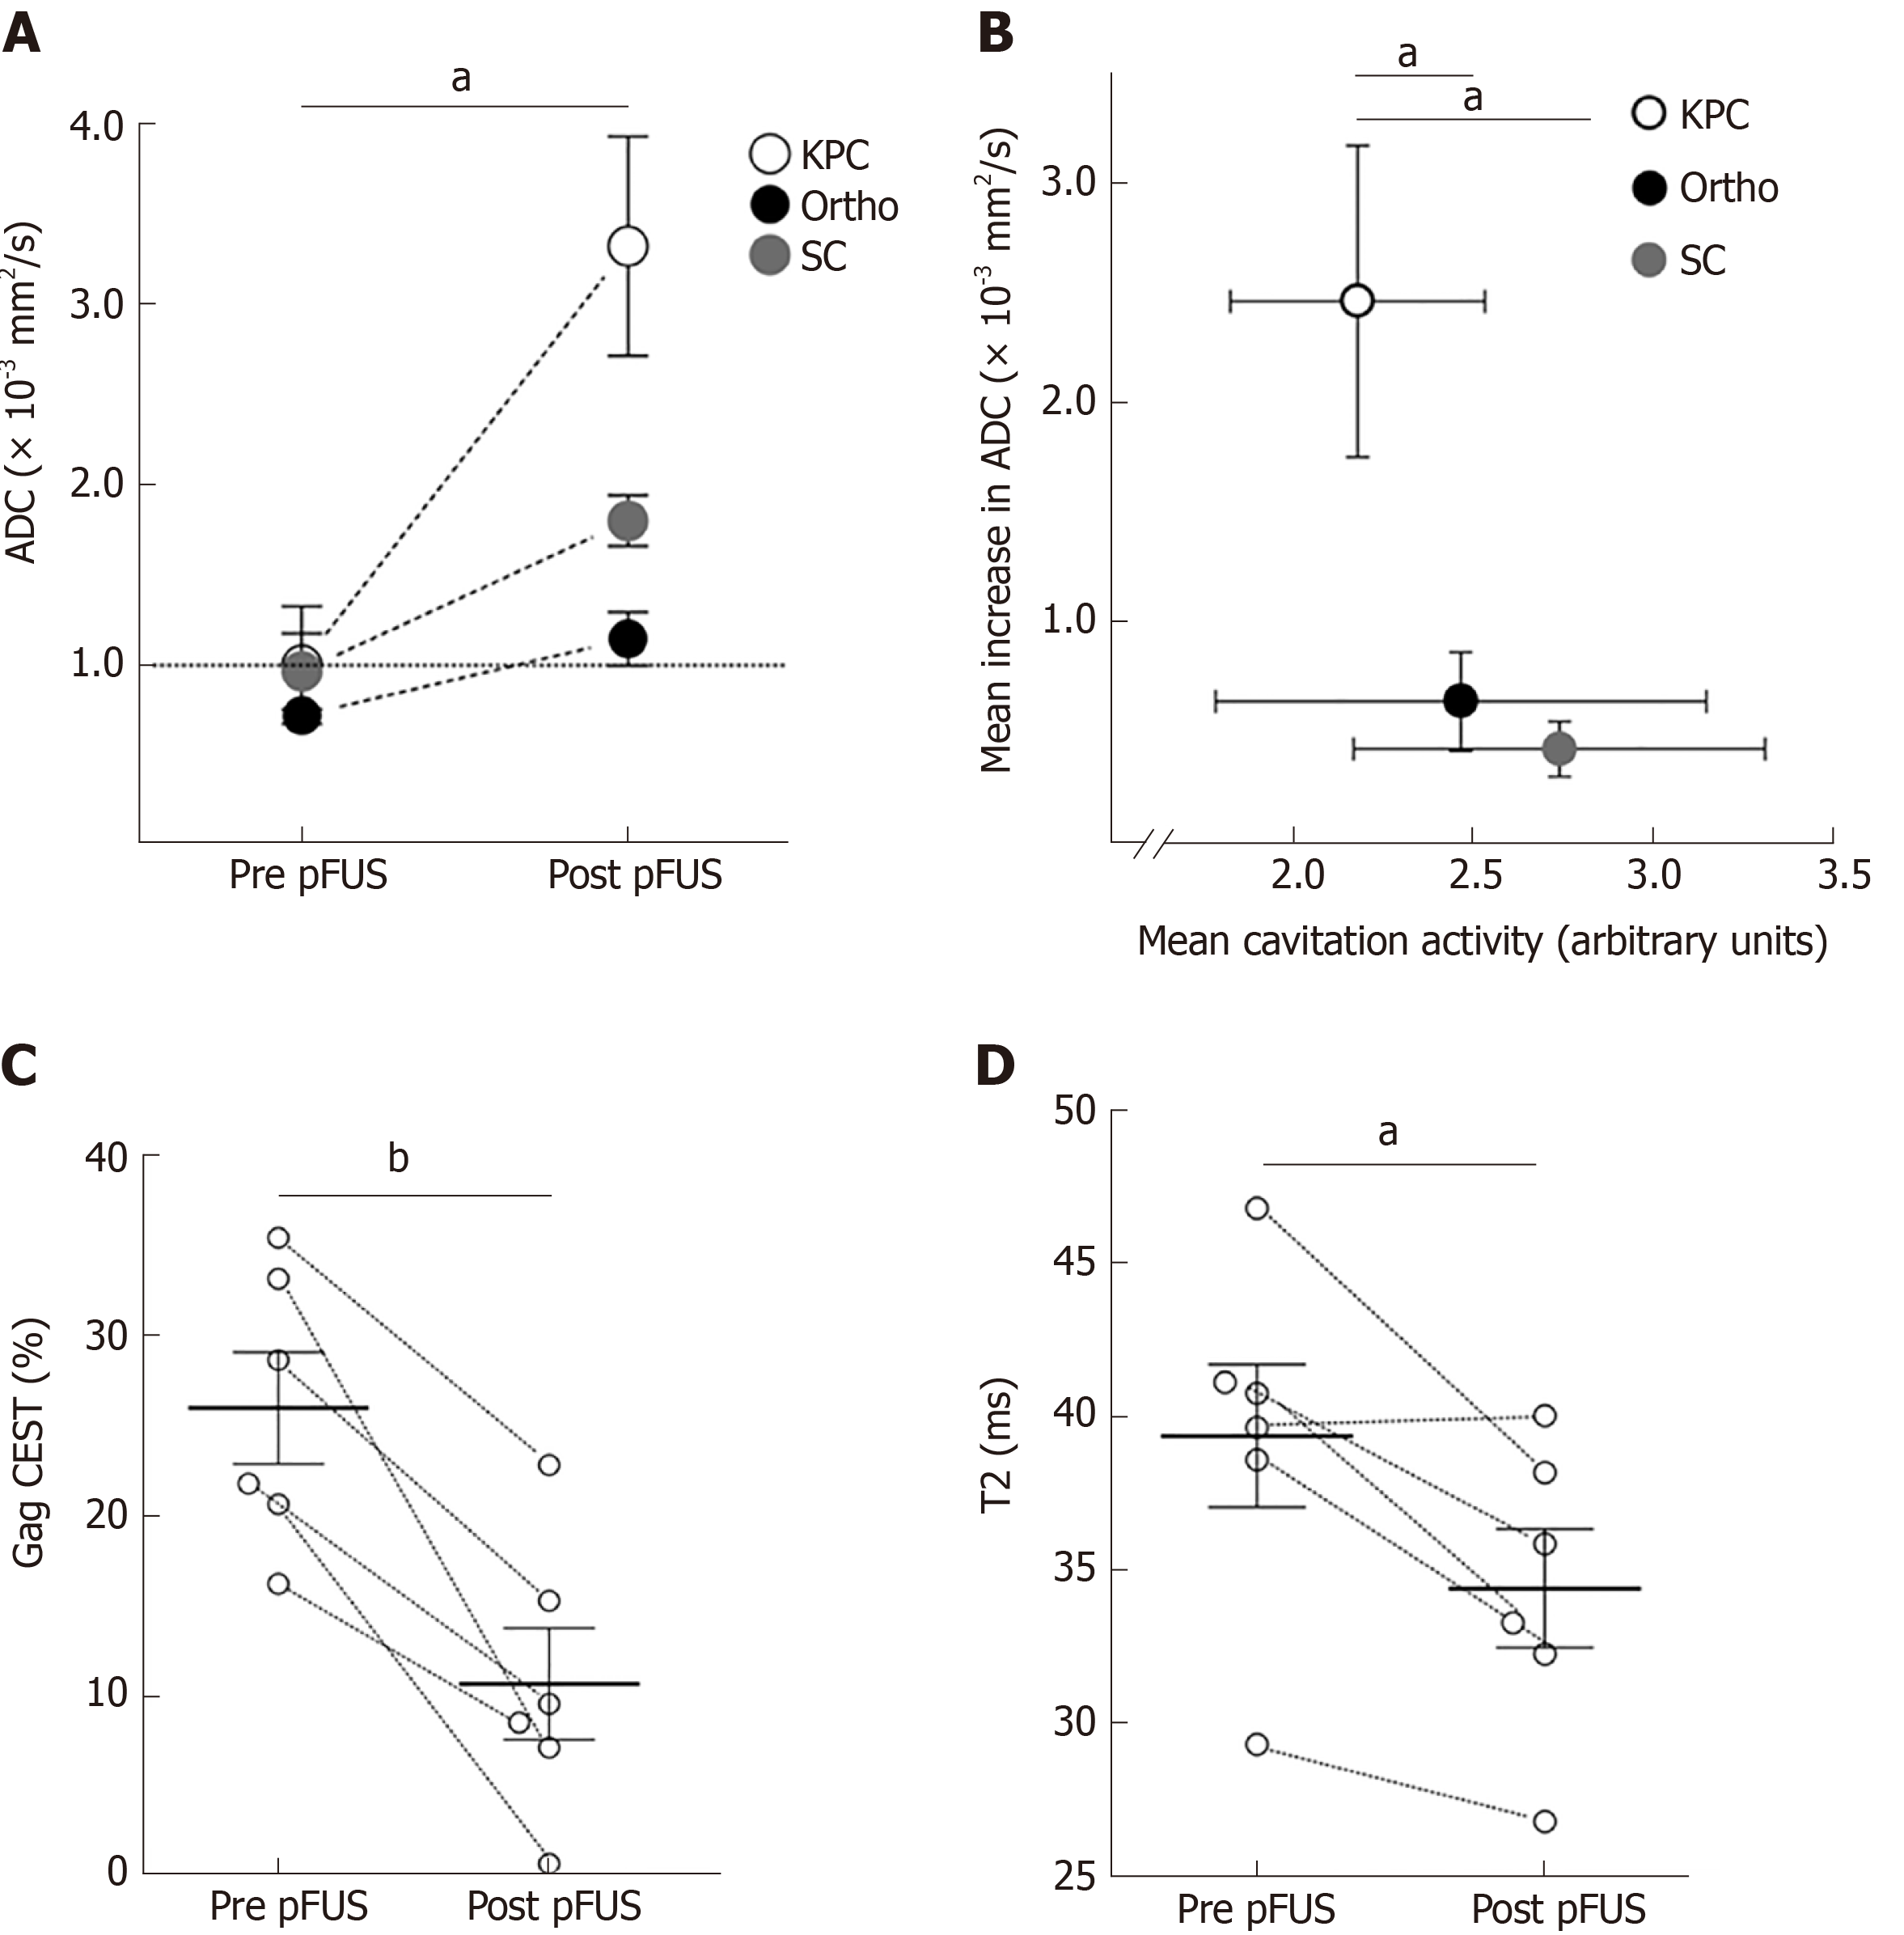
Figure 2 14T magnetic resonance imaging parameter changes due to pulsed focused ultrasound treatments.
A: There was significant increase in mean apparent diffusion coefficient (ADC) quantitation for all three murine pancreatic ductal adenocarcinoma models (n = 6 in each group). The horizontal dotted line at ADC = 1 demarcates a frequently used clinical threshold for “restricted” diffusion; B: Cavitation was successfully achieved in all treated animals. On average, cavitation activity tended to be lower in the KPC animals, yet the absolute increase in ADC values for these animals was significantly higher than the other two models post-pulsed focused ultrasound (pFUS) treatment; C and D: GagCEST (C) and T2 (D) quantifications in KPC animals revealed significant decrease in mean values (solid horizontal lines) post-pFUS treatment (n = 6). There was no significant change in these parameters in the other tumor models. aP < 0.05; bP < 0.01. ADC: Apparent diffusion coefficient; pFUS: Pulsed focused ultrasound; Ortho: Orthotopic; KPC: Genetic mouse model; SC: Subcutaneous.
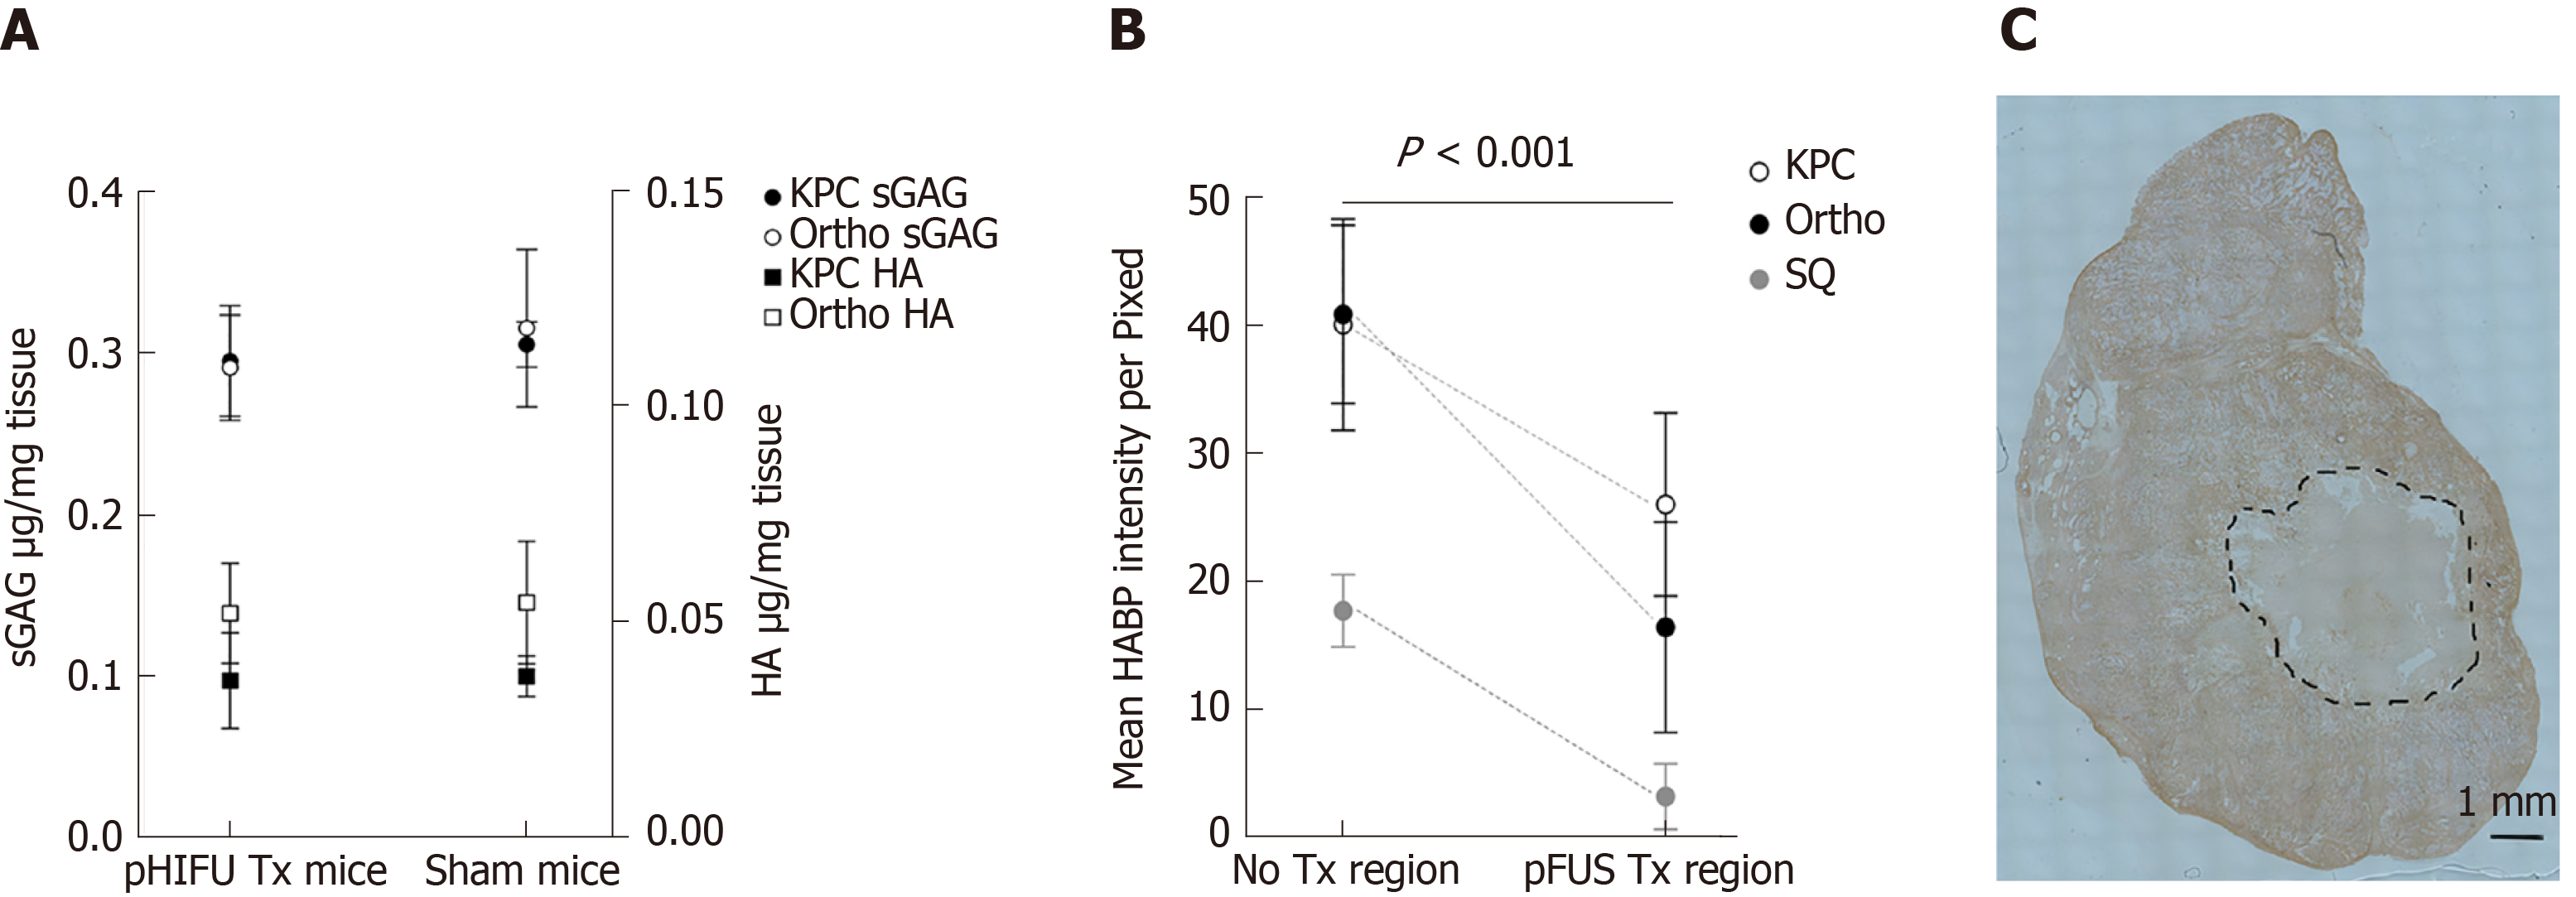
Figure 3 Histochemical and biochemical parameter changes due to pulsed focused ultrasound treatments.
A: Hyaluronic acid (HA) and sulfated glycosaminoglycan concentrations in treated and sham treated KPC and orthotopic mice; B: HA intensities in treated and non-treated regions of the tumor in KPC, orthotopic, and subcutaneous models; C: Representative histological image of HA binding protein stained section for a KPC mouse. The treated region is outline by a dashed line. KPC: Genetic mouse model; Ortho: Orthotopic; HA: Hyaluronic acid.
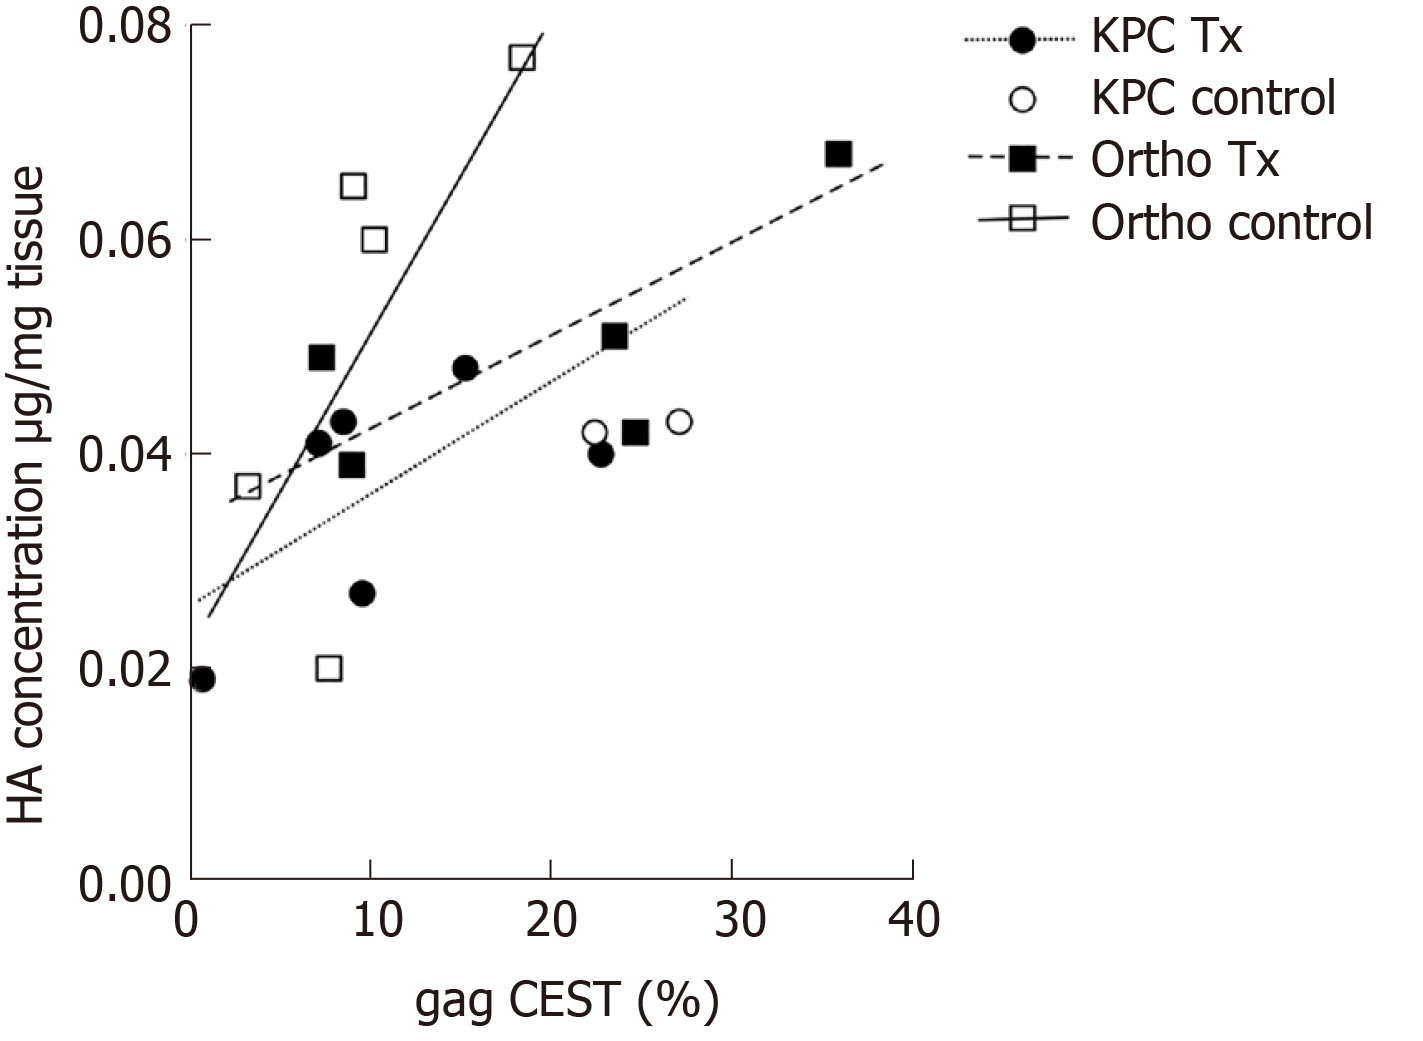
Figure 4 Total hyaluronic acid concentration compared to glycosaminoglycan chemical exchange saturation transfer for treated and sham treated (control) KPC and orthotopic mice.
Regression lines for each animal model and condition demonstrate strong positive correlation between the hyaluronic acid concentrations as determined by the biochemical assay and glycosaminoglycan chemical exchange saturation transfer measurements. HA: Hyaluronic acid; CEST: Chemical exchange saturation transfer.
- Citation: Maloney E, Wang YN, Vohra R, Son H, Whang S, Khokhlova T, Park J, Gravelle K, Totten S, Hwang JH, Lee D. Magnetic resonance imaging biomarkers for pulsed focused ultrasound treatment of pancreatic ductal adenocarcinoma. World J Gastroenterol 2020; 26(9): 904-917
- URL: https://www.wjgnet.com/1007-9327/full/v26/i9/904.htm
- DOI: https://dx.doi.org/10.3748/wjg.v26.i9.904


