Copyright
©The Author(s) 2020.
World J Gastroenterol. Feb 21, 2020; 26(7): 706-716
Published online Feb 21, 2020. doi: 10.3748/wjg.v26.i7.706
Published online Feb 21, 2020. doi: 10.3748/wjg.v26.i7.706
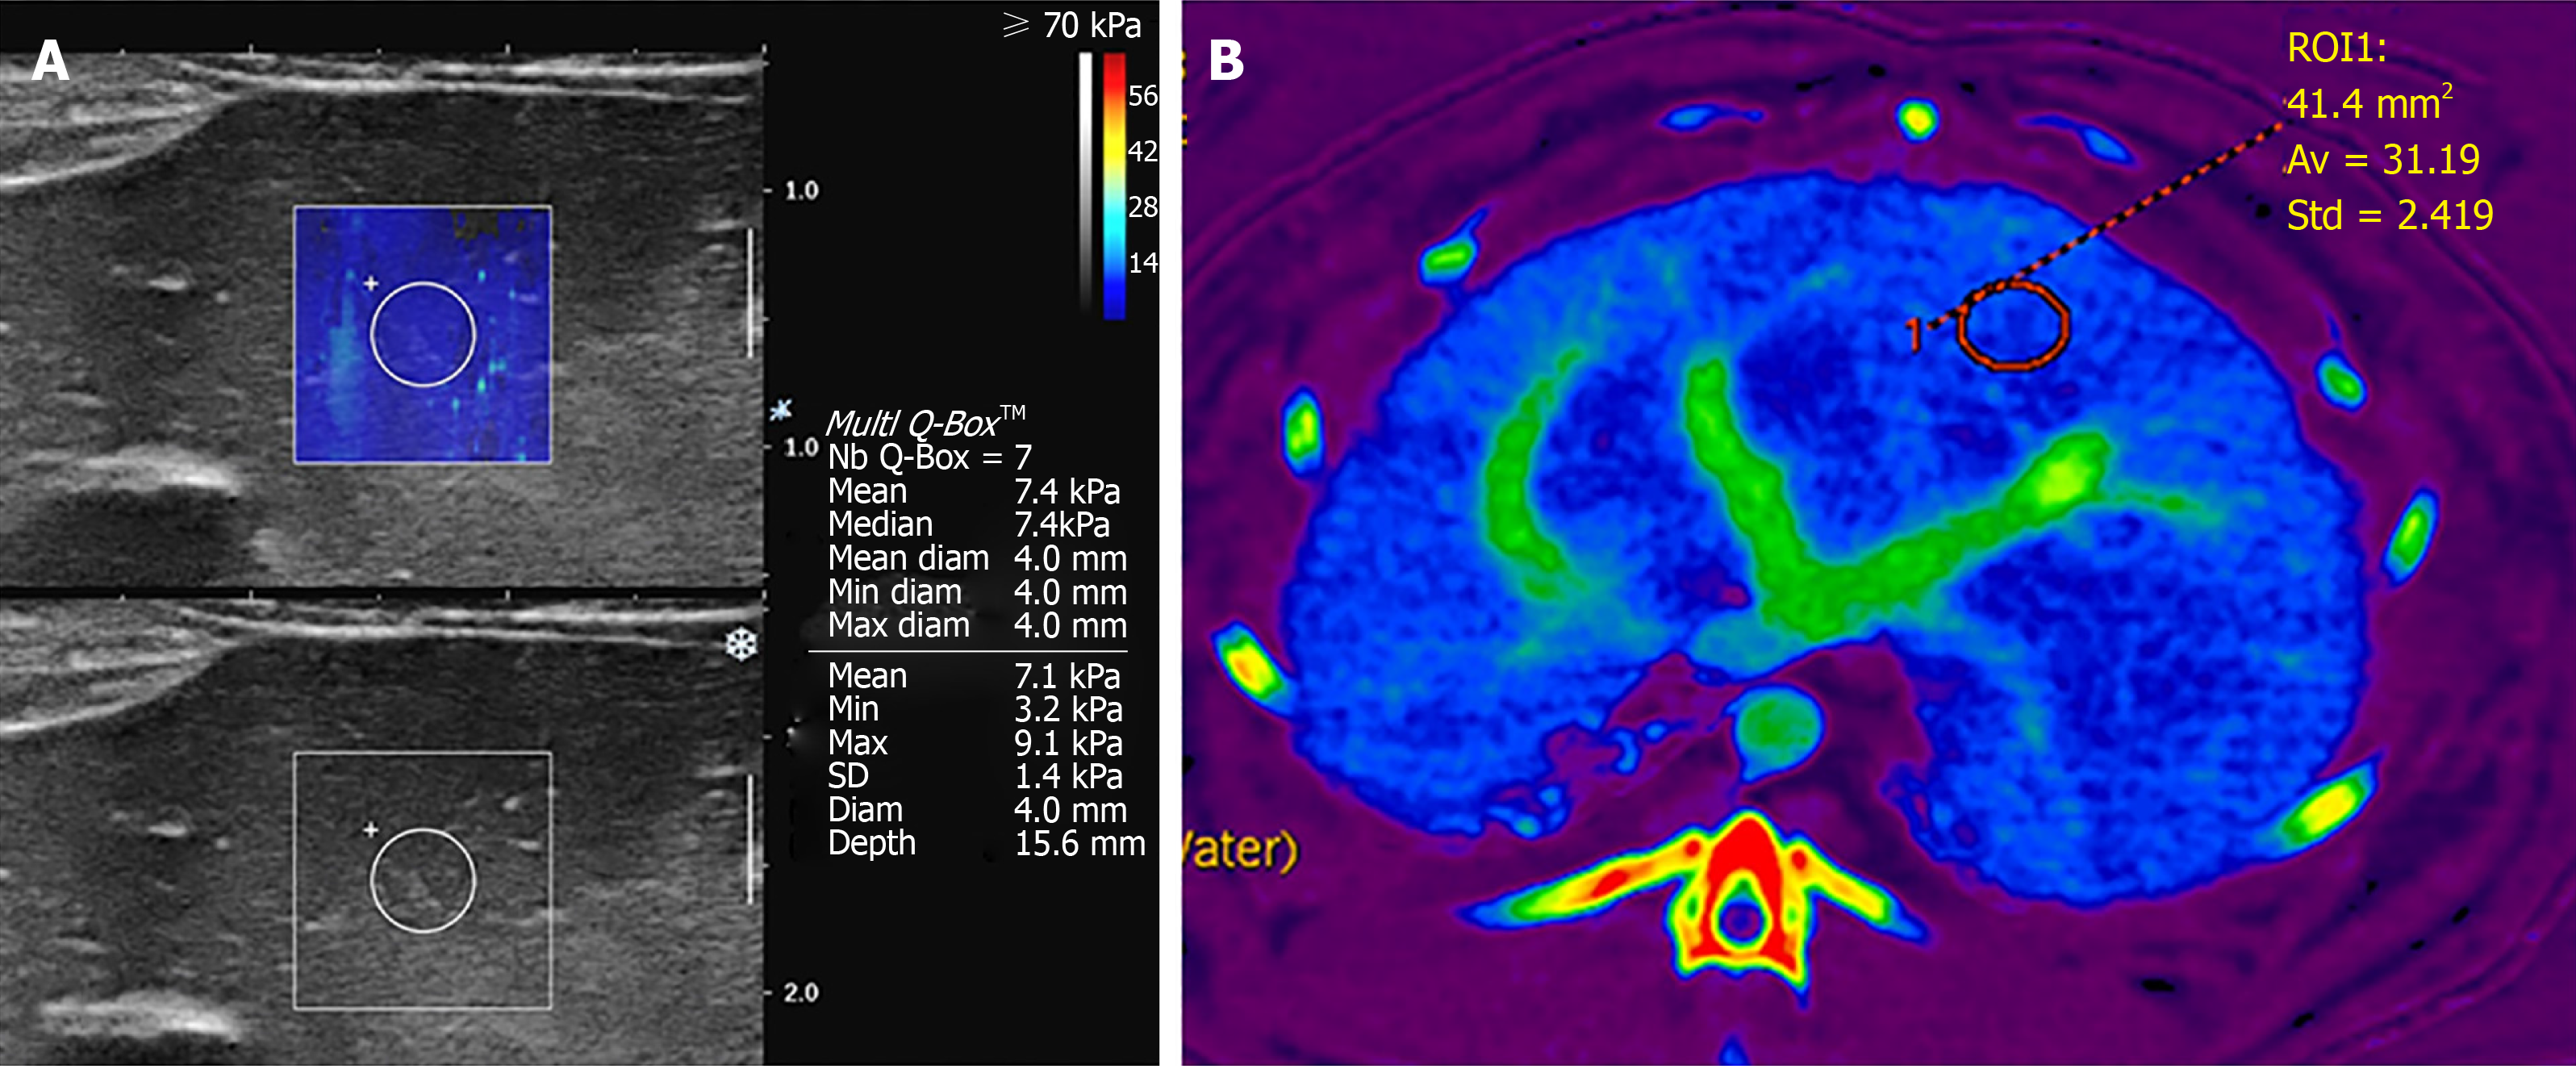
Figure 1 Representative images from supersonic shear wave imaging and dual energy computed tomography of rabbits in a sinusoidal obstruction syndrome group on day 20.
A: Mean liver stiffness value for livers in the sinusoidal obstruction syndrome group was 7.4 kPa; B: Iodine concentration in livers of the sinusoidal obstruction syndrome group was 31.19 mg/mL.
Figure 2 Changing patterns of imaging results.
A: Liver stiffness on supersonic shear wave imaging; B: Hounsfield unit values on virtual monochromatic image of 55 keV; C: Iodine concentration on iodine map of dual energy computed tomography on days 0, 3, 10, and 20 in control (blue) and sinusoidal obstruction syndrome (SOS) (red) groups. All three quantitative values showed significant differences in changing pattern between control and SOS groups for all days (P < 0.001). aShows significantly different results between control and SOS groups for each day.
- Citation: Shin J, Yoon H, Cha YJ, Han K, Lee MJ, Kim MJ, Shin HJ. Liver stiffness and perfusion changes for hepatic sinusoidal obstruction syndrome in rabbit model. World J Gastroenterol 2020; 26(7): 706-716
- URL: https://www.wjgnet.com/1007-9327/full/v26/i7/706.htm
- DOI: https://dx.doi.org/10.3748/wjg.v26.i7.706


