Copyright
©The Author(s) 2020.
World J Gastroenterol. Feb 7, 2020; 26(5): 478-498
Published online Feb 7, 2020. doi: 10.3748/wjg.v26.i5.478
Published online Feb 7, 2020. doi: 10.3748/wjg.v26.i5.478
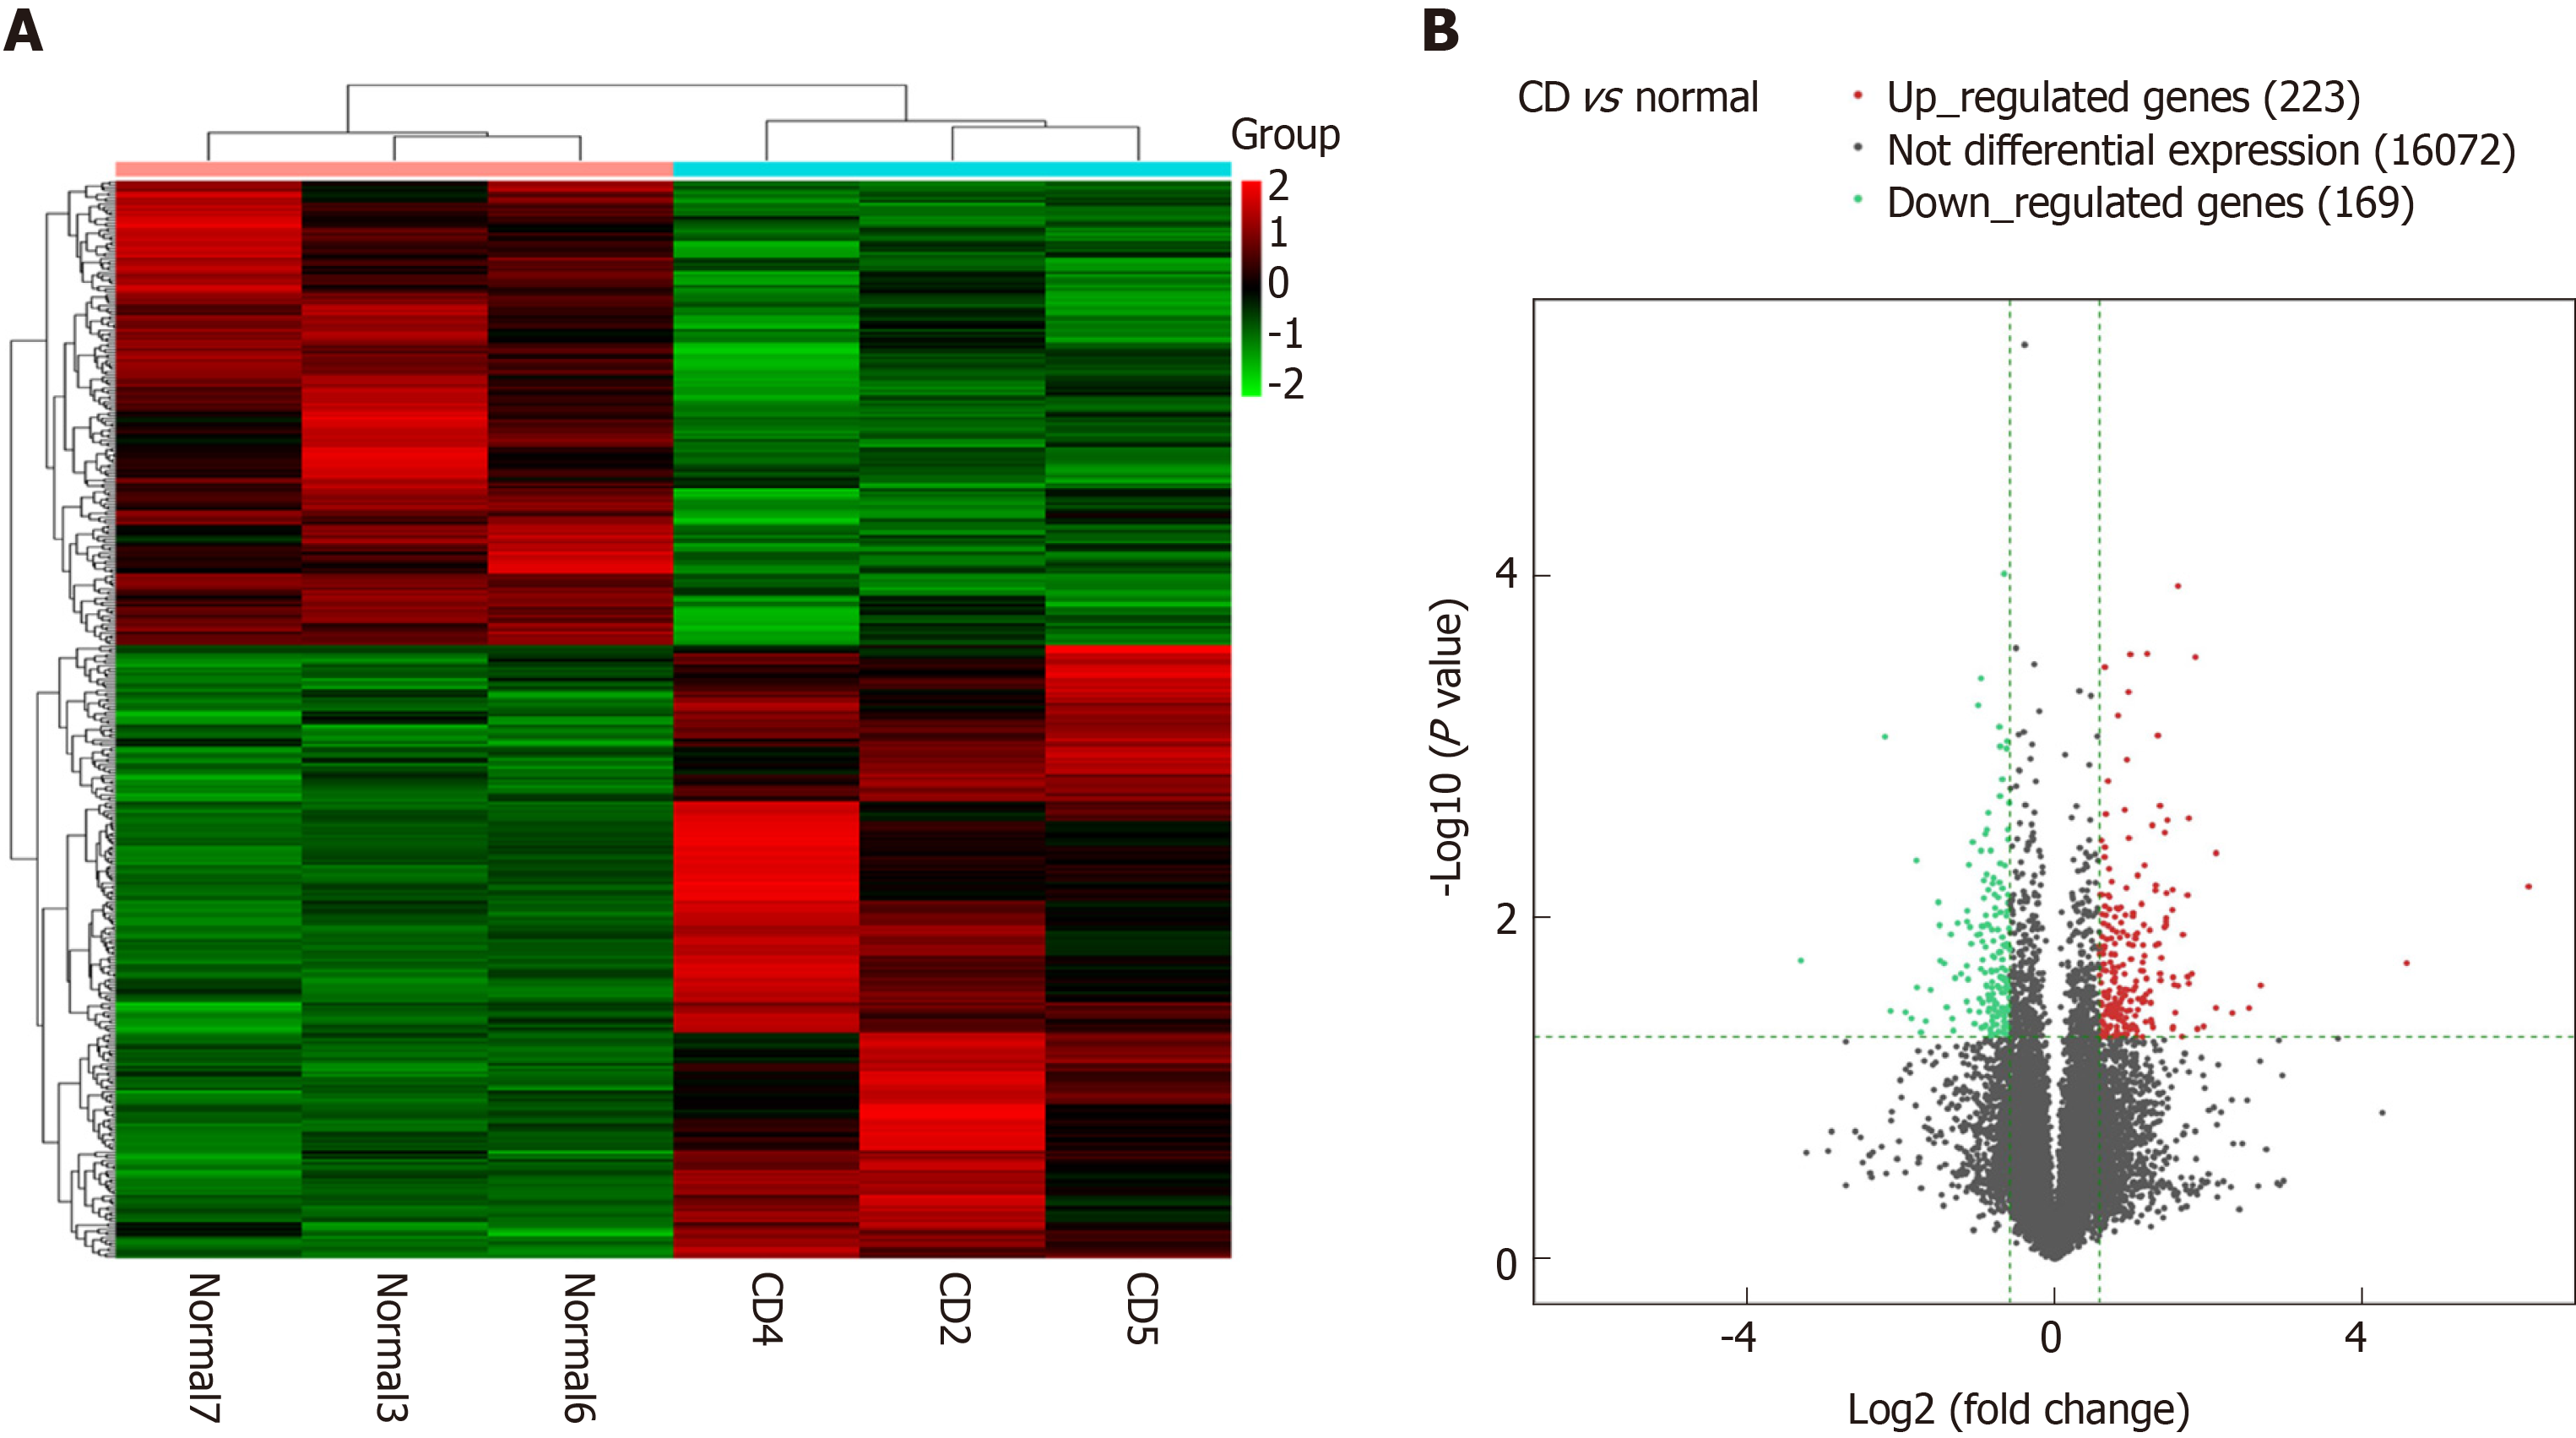
Figure 1 Cluster analysis of differentially expressed long noncoding RNAs.
A: Thermograms of differentially expressed long noncoding RNAs (lncRNAs) in the intestinal mucosa from Crohn’s disease patients (three samples on right) compared to normal intestinal mucosa from control subjects (three samples on left). Each row represents one gene, and each column represents one sample. Red color represents genes with significantly upregulated expression, and green color represents genes with significantly downregulated expression; B: Differentially expressed lncRNAs shown in a volcano plot. The X-axis represents log2-fold changes, and the Y-axis represents log10 P values, for each significantly altered lncRNA. The two vertical green lines are up- and down-sets, and the green horizontal lines represent the P-value threshold. The red dots represent genes with significantly upregulated expression. The green dots represent genes with significantly downregulated expression. The gray dots represent genes without significant changes in expression.
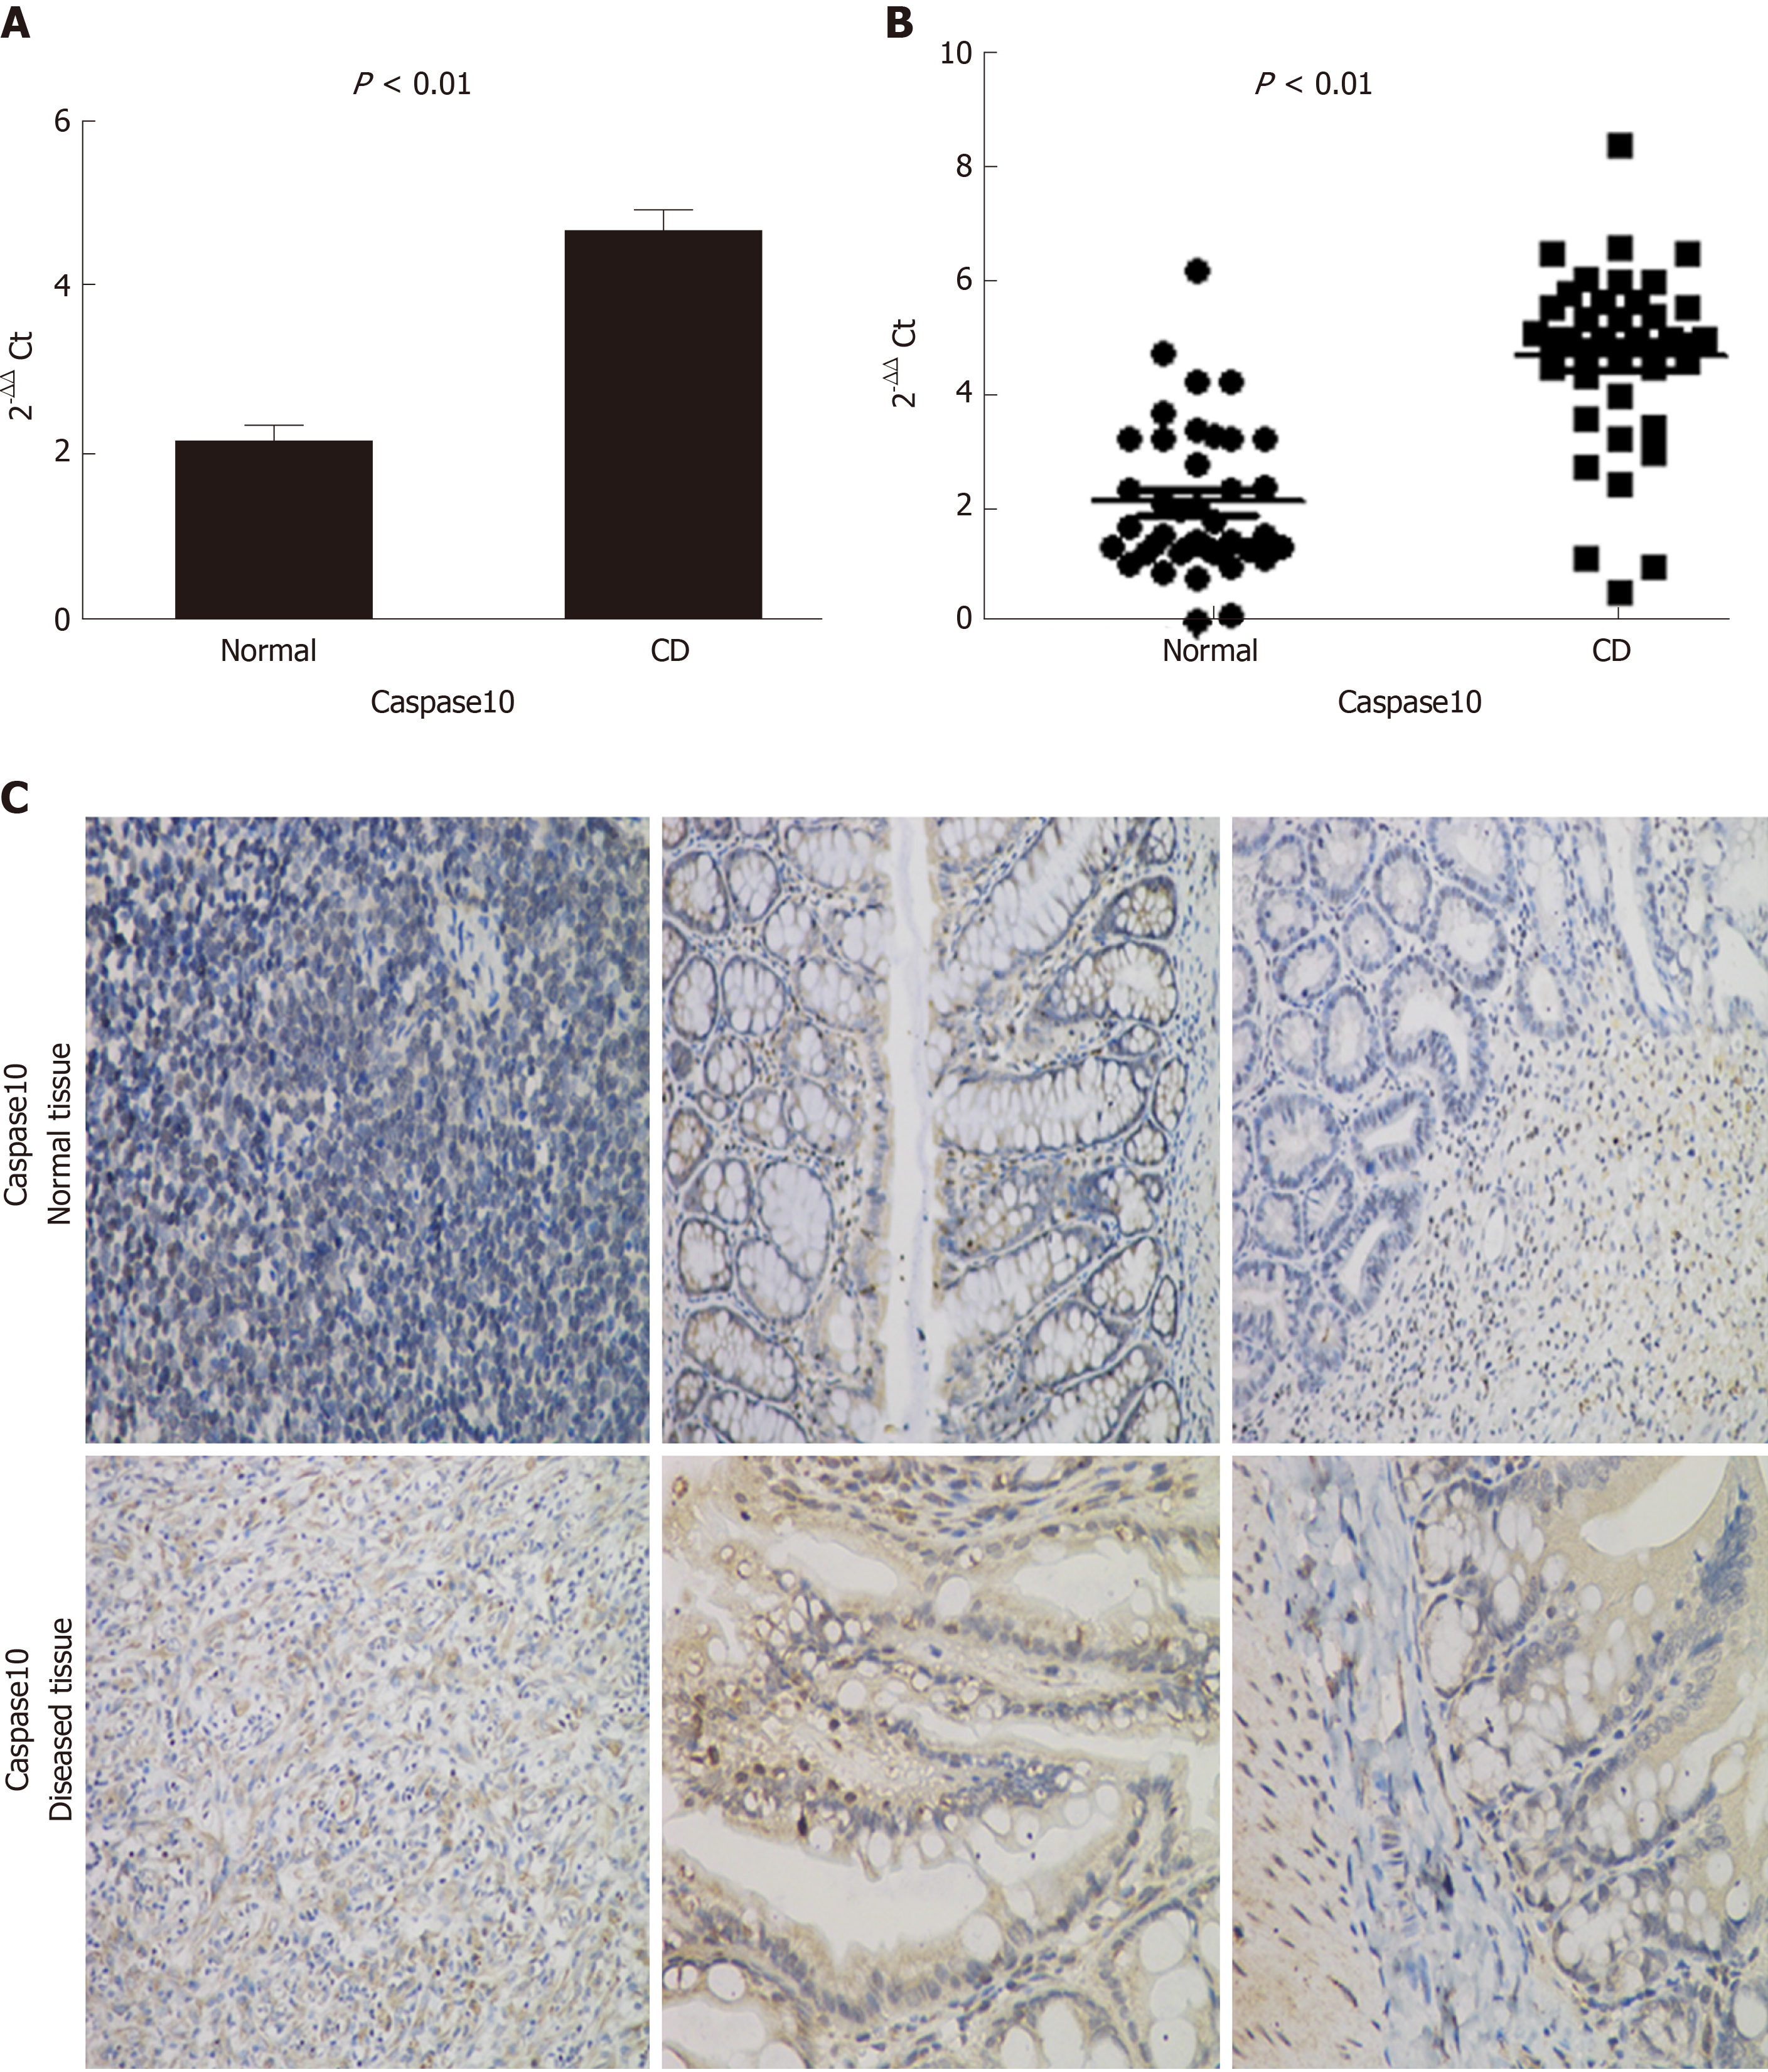
Figure 2 Differential expression of Caspase10 between Crohn’s disease mucosa samples and normal mucosa.
A: Results of real-time PCR. Average Caspase10 mRNA level in the Crohn’s disease (CD) mucosa samples was significantly higher than that in normal mucosa; B: Distribution of Caspase10 mRNA levels in 40 mucosa samples of either the CD or normal control group; C: Representative result of immunohistochemical analysis. Caspase10 expression was increased in intestinal mucosa samples of CD patients compared with that in diseased mucosa tissues. Caspase10 protein appears brown in images. Magnification in the left panel is 100 ×, and in the middle and right panels is 400 ×. CD: Crohn’s disease.
Figure 3 Detection of lncRNACNN3-206 by in situ hybridization.
Green fluorescence was generated by a lncRNACNN3-206 probe. Red fluorescence was generated by a probe for CK20, a molecular marker of intestinal epithelial cells (yellow arrows). Blue fluorescence was from DAPI staining of nuclei (pink arrows). LncRNACNN3-206 was highly expressed in the intestinal mucosa from Crohn’s disease patients compared to normal intestinal mucosa. Further observation at high magnification revealed that lncRNACNN3-206 was mainly distributed in the cytoplasm of intestinal epithelial cells (white arrows). Magnifications are: 100 × on the left, and 400 × on the right. CD: Crohn’s disease.
Figure 4 Results of luciferase reporter assays.
A: Results of luciferase reporter assays following co-transfection of Caco-2 cells with a luciferase plasmid vector containing the 3' end of lncRNACNN3-206 and lentivirus expressing miR-212 mimics (left), or a luciferase plasmid vector containing the 3’ UTR of Caspase10 and lentivirus expressing miR-212 mimics (right). Note the significant inhibition of luciferase activity in the wild-type constructs by miR-212 mimic overexpression. PsiCHECK-2 is the name of an empty plasmid, and served as a control for both lncRNA CNN3-206 and Caspase 10; B: Illustration of the ternary mechanism for the interactions among lncRNACNN3-206, miR-212 and Caspase10. aP < 0.05, bP < 0.01.
Figure 5 Manipulation of lncRNACNN3-206 expression levels led to changes in cell function.
A: Results of flow cytometry showed that overexpression or knockdown of lncRNACNN3-206 expression resulted in changes in Caco-2 (left) and HT-29 (right) cell apoptosis. The number of apoptotic cells in the lncRNACNN3-206 overexpression group (oe-lncRNACNN3-206) was significantly increased, while the number of apoptotic cells in the lncRNACNN3-206 knockdown group (si-lncRNACNN3-206) was significantly decreased, in comparison with the vector and blank control groups; B: Results of Trans-well invasion assays in Caco-2 (left) and HT-29 (right) cells. The number of invasive cells in the lncRNACNN3-206 overexpression (oe-lncRNACNN3-206) group was significantly increased, while the number of invasive cells in the lncRNACNN3-206 knockdown si-lncRNACNN3-206 group was significantly decreased, in comparison with the vector and blank control groups. aP < 0.05, bP < 0.01, eP < 0.001.
Figure 6 Results of the mouse Crohn’s disease model.
A: DAI scores of the five groups, including the TNBS model group (TNBS), lncRNACNN3-206 knockdown group (TBNS + anti-lncRNACNN3-206), and vector control group (TBNS + anti-scramble). The DAI scores after the 4th wk of TNBS administration significantly decreased in the TBNS + anti-lncRNACNN3-206 group compared with the TBNS group. The DPI scores were similar in the TBNS and vector control groups; B: The TNBS and TNBS + anti-scramble groups were significantly shortened, and hyperemia was observed. However, no obvious contracture was observed in the colons from mice in the TNBS + si-lncRNACNN3-206 group. The ileocecal colon in this group had mild segmenting congestion, which was similar to that of the control group. aP < 0.05.
Figure 7 Effects of lncRNACNN3-206 knockdown on pathological changes in the Crohn’s disease model.
A: Results of H&E staining of intestinal mucosal tissue samples from the four groups of mice (a-d magnification, 100 ×; e-f magnification, 400 ×). (a): Few infiltrating neutrophils were observed in the mucosal layer of the intestinal mucosa in the control group. (b): In the TNBS group, the mucosal layer was disrupted, the intestinal crypts were deformed and reduced, and numerous infiltrating neutrophils and mononuclear macrophages were found in the mucosal muscular layer and submucosa, and tissues were observed in the submucosa. (c): In the TNBS + si-lncRNACNN3-206 group, crypt damage was confined to the mucosal layer with a small number of infiltrated neutrophils. (d): In the TNBS + anti-scramble group, some continuous mucosal layers were observed, but the epithelial cells were swollen. A large number of neutrophils and plasma cells were observed in the submucosa and muscularis. (e) and (f): The infiltration of inflammatory cells was observed at higher magnification; B: Distribution of lncRNACNN3-206 in intestinal mucosa of the TNBS group was different from that of the si-lncRNACNN3-206 group (n = 3 for each group). Green fluorescence indicates the probe for lncRNACNN3-206, and blue fluorescence represents cellular structures. The left panels are at 100 × magnification. The right panels are at 400 × magnification; C: Left panels, results of Western blotting for the detection of Caspase10 protein expression in the four groups from two experiments. Right panels, densitometric analysis of Western blotting results. Caspase10 expression was significantly increased in the TNBS and TNBS + anti-scramble groups, but much reduced in the TNBS + si-lncRNACNN3-206 group, in comparison with the TNBS group.
Figure 8 Changes in the percentage of CD4+ lymphocytes in the spleen of the mouse Crohn’s Disease model after manipulation of lncRNACNN3-206 expression levels.
A: The Th1, Th2, Th17, and Treg cells were sorted and counted by flow cytometry analysis; B: Calculation of the ratios of Th1/Th2 and Th17/Treg ratios. The Th1/Th2 ratio in the TNBS group was > 1, while the Th1/Th2 ratio was < 1 after knockdown of si-lncRNACNN3-206 (TNBS + si-lncRNACNN3-206). The Th17/Treg ratio in the TNBS group was > 1, but the Th17/Treg ratio was < 1, after knockdown of si-lncRNACNN3-206 (TNBS + si-lncRNACNN3-206).
- Citation: Li N, Shi RH. lncRNACNN3-206 activates intestinal epithelial cell apoptosis and invasion by sponging miR-212, an implication for Crohn's disease. World J Gastroenterol 2020; 26(5): 478-498
- URL: https://www.wjgnet.com/1007-9327/full/v26/i5/478.htm
- DOI: https://dx.doi.org/10.3748/wjg.v26.i5.478


