Copyright
©The Author(s) 2020.
World J Gastroenterol. Dec 28, 2020; 26(48): 7664-7678
Published online Dec 28, 2020. doi: 10.3748/wjg.v26.i48.7664
Published online Dec 28, 2020. doi: 10.3748/wjg.v26.i48.7664
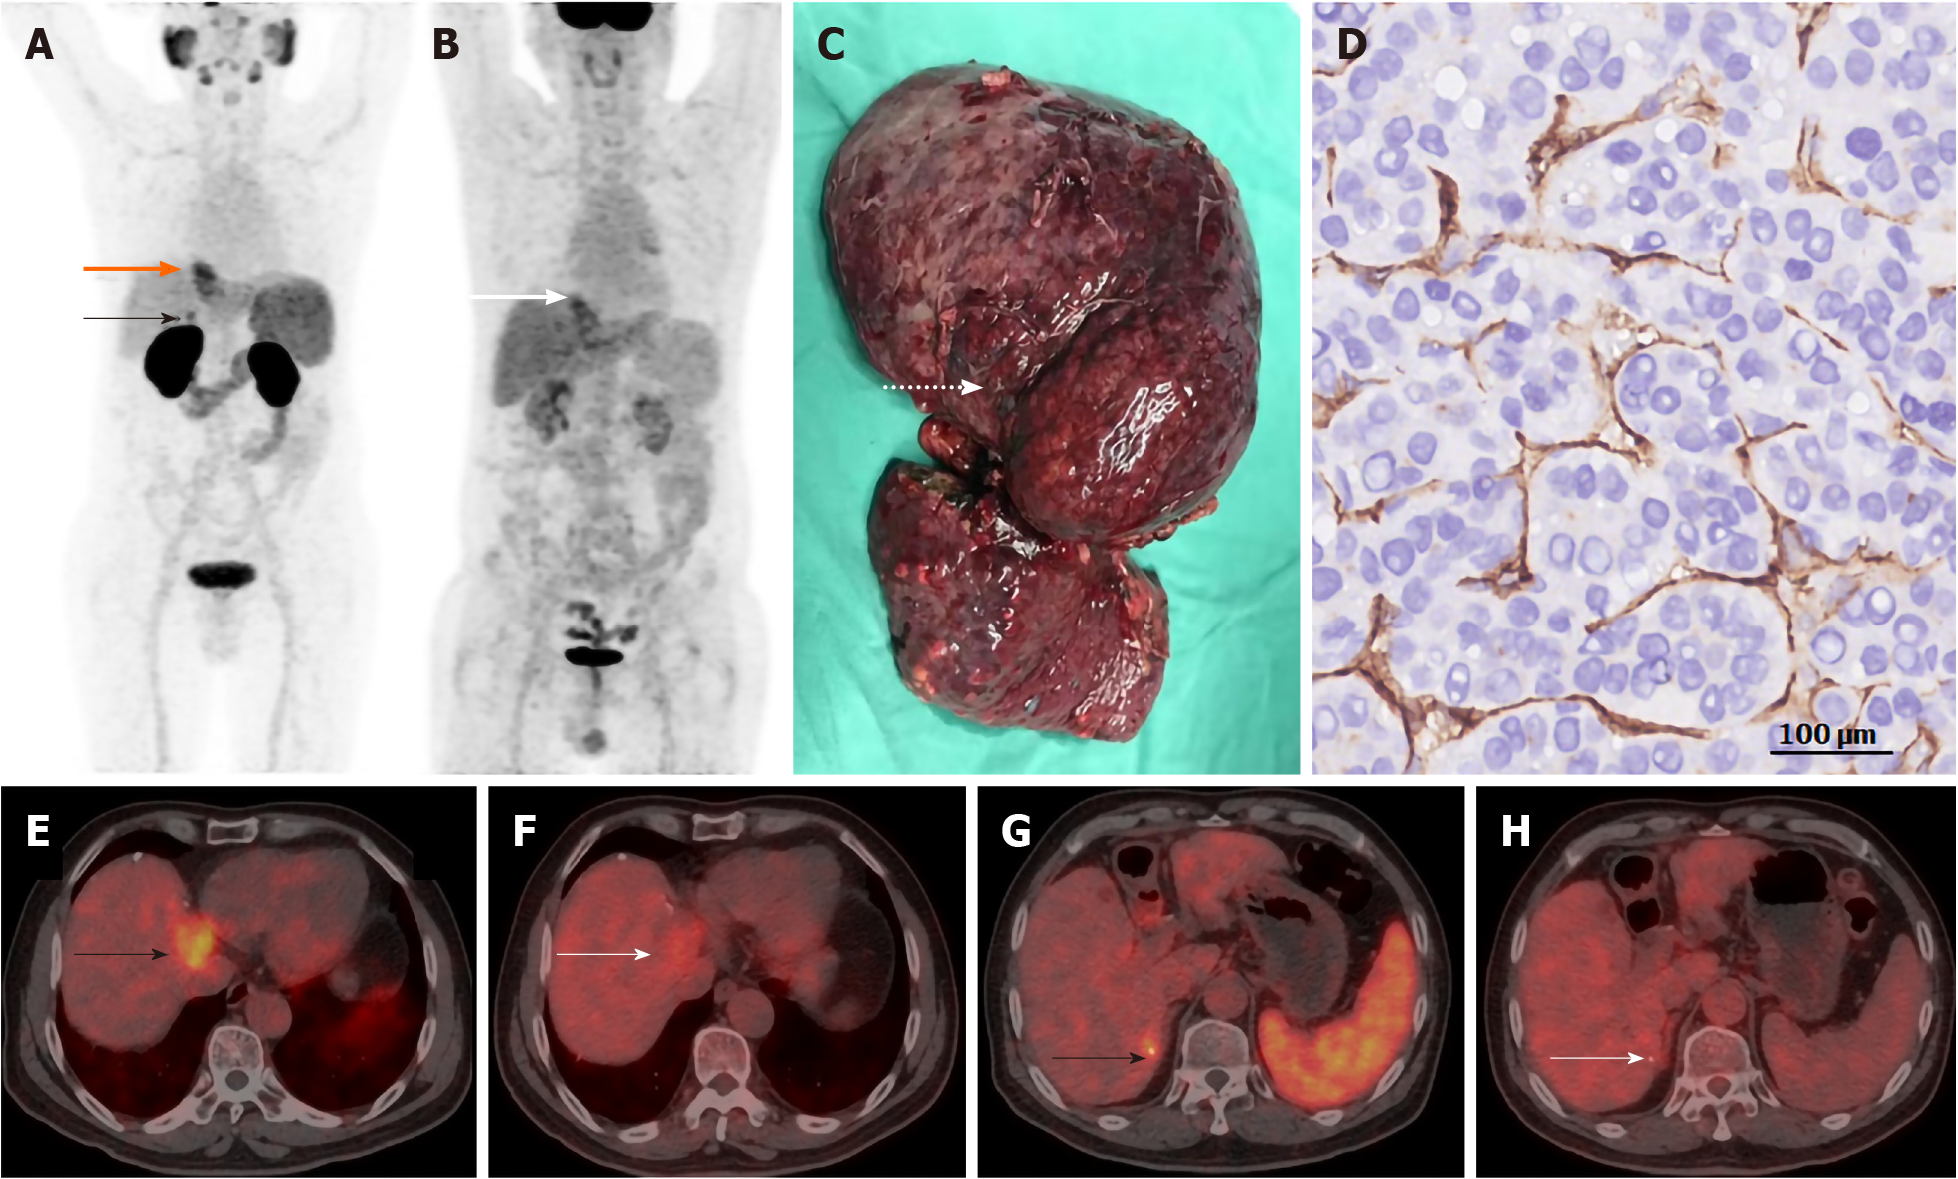
Figure 1 Positron emission tomography imaging study on a 75-year-old man with hepatocellular carcinoma.
18F-Fludeoxyglucose (FDG) and 68Ga-prostate-specific membrane antigen (PSMA) positron emission tomography/computed tomography imaging was performed. A: Maximal intensity projection, 68Ga-PSMA revealed focal uptake [bold orange arrow, standardized uptake value (SUV)max: 7.6; black arrow, SUVmax: 5.7]; B: Maximal intensity projection, 18F-FDG revealed focal uptake (bold white arrow, SUVmax: 4.6), no uptake in right lesion (white arrow); C: Gross section displayed a nodule histologically classified as hepatocellular carcinoma; D: Strong PSMA expression (400 ×, immunohistochemistry, scale bar = 100 μm) was shown in the tumor-associated vascular; E and G: Transaxial fused, 68Ga-PSMA revealed focal uptake (bold black arrow, SUVmax: 7.6; black arrow, SUVmax: 5.7); F and H: Transaxial fused, 18F-FDG revealed focal uptake (bold white arrow, SUVmax: 4.6), no uptake in right lesion (white arrow).
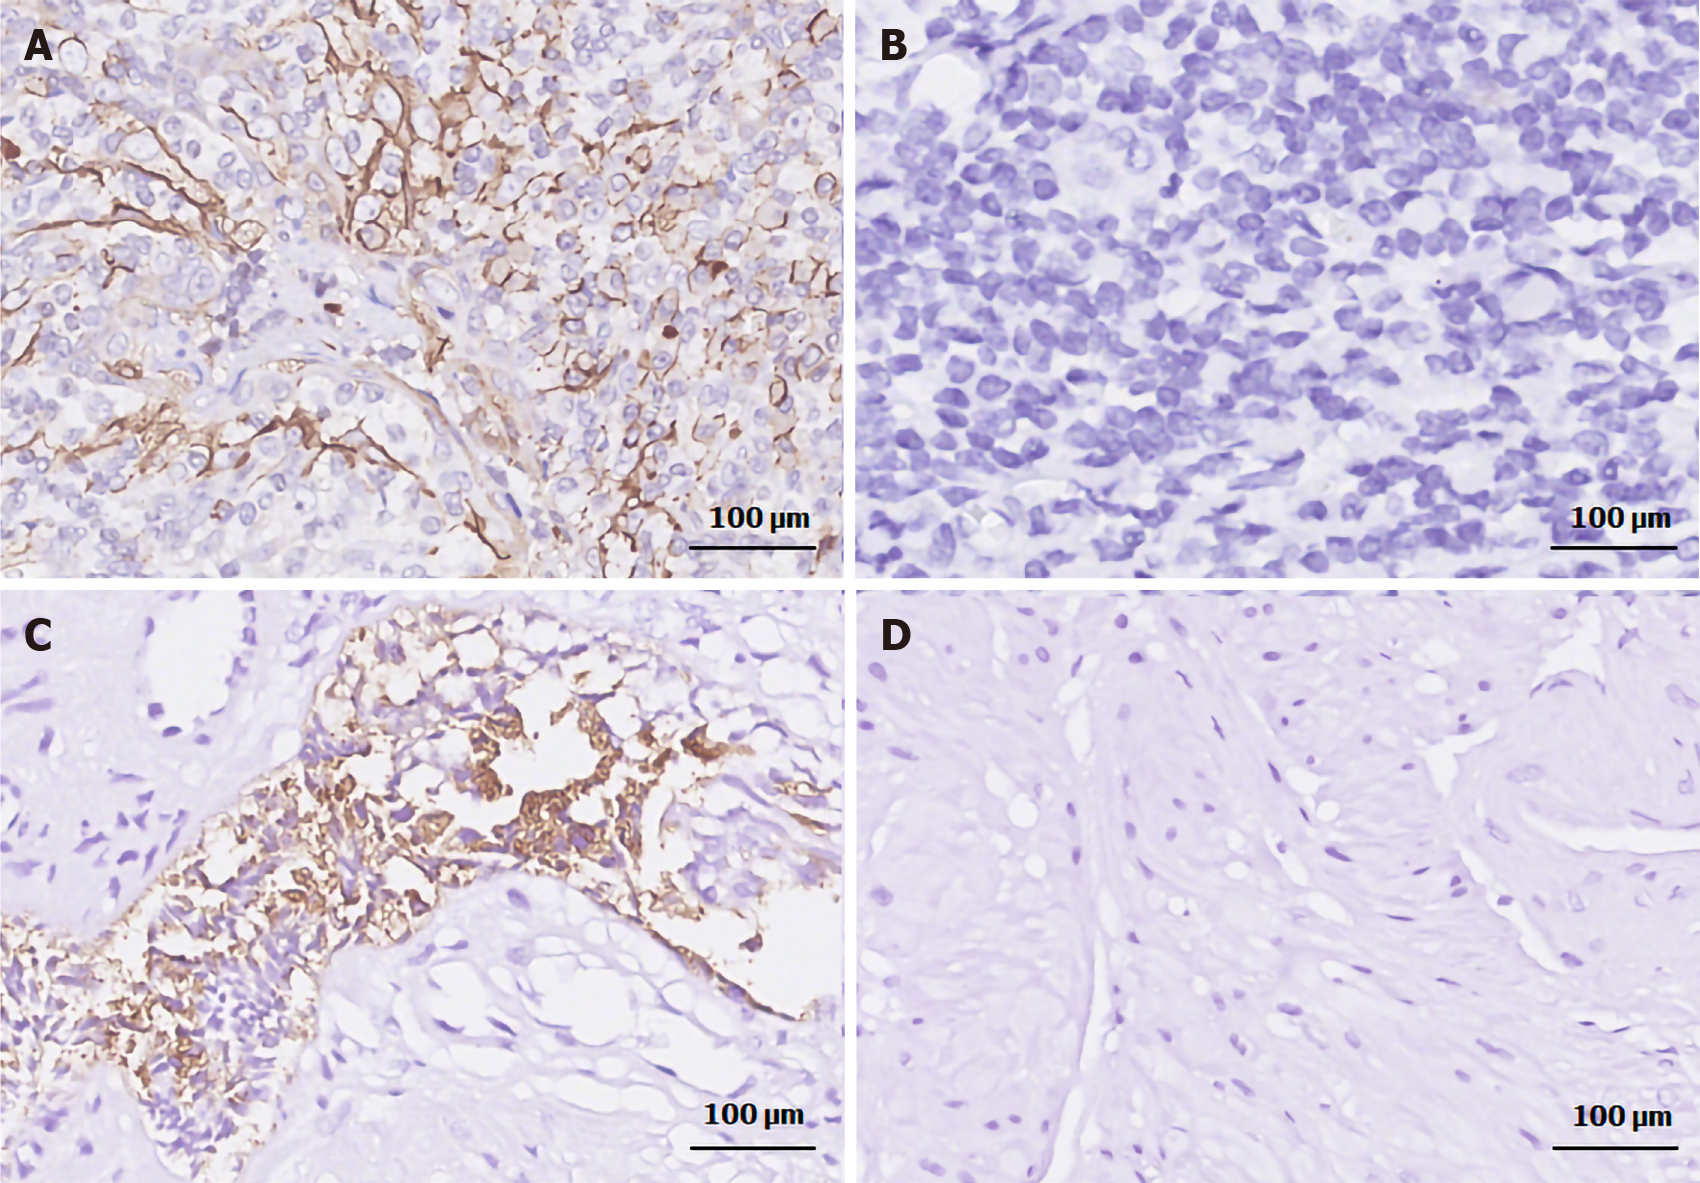
Figure 2 CD31 staining and prostate-specific membrane antigen staining.
A: Positive control, CD31 staining in human tonsils (400 ×, scale bar = 100 μm); B: Negative control, CD31 staining in human tonsils (400 ×, scale bar = 100 μm); C: Anti-prostate-specific membrane antigen (PSMA) positive control, PSMA staining in human prostate cancer tissues (400 ×); D: Anti-PSMA negative control, PSMA staining in human prostate cancer tissues (400 ×).
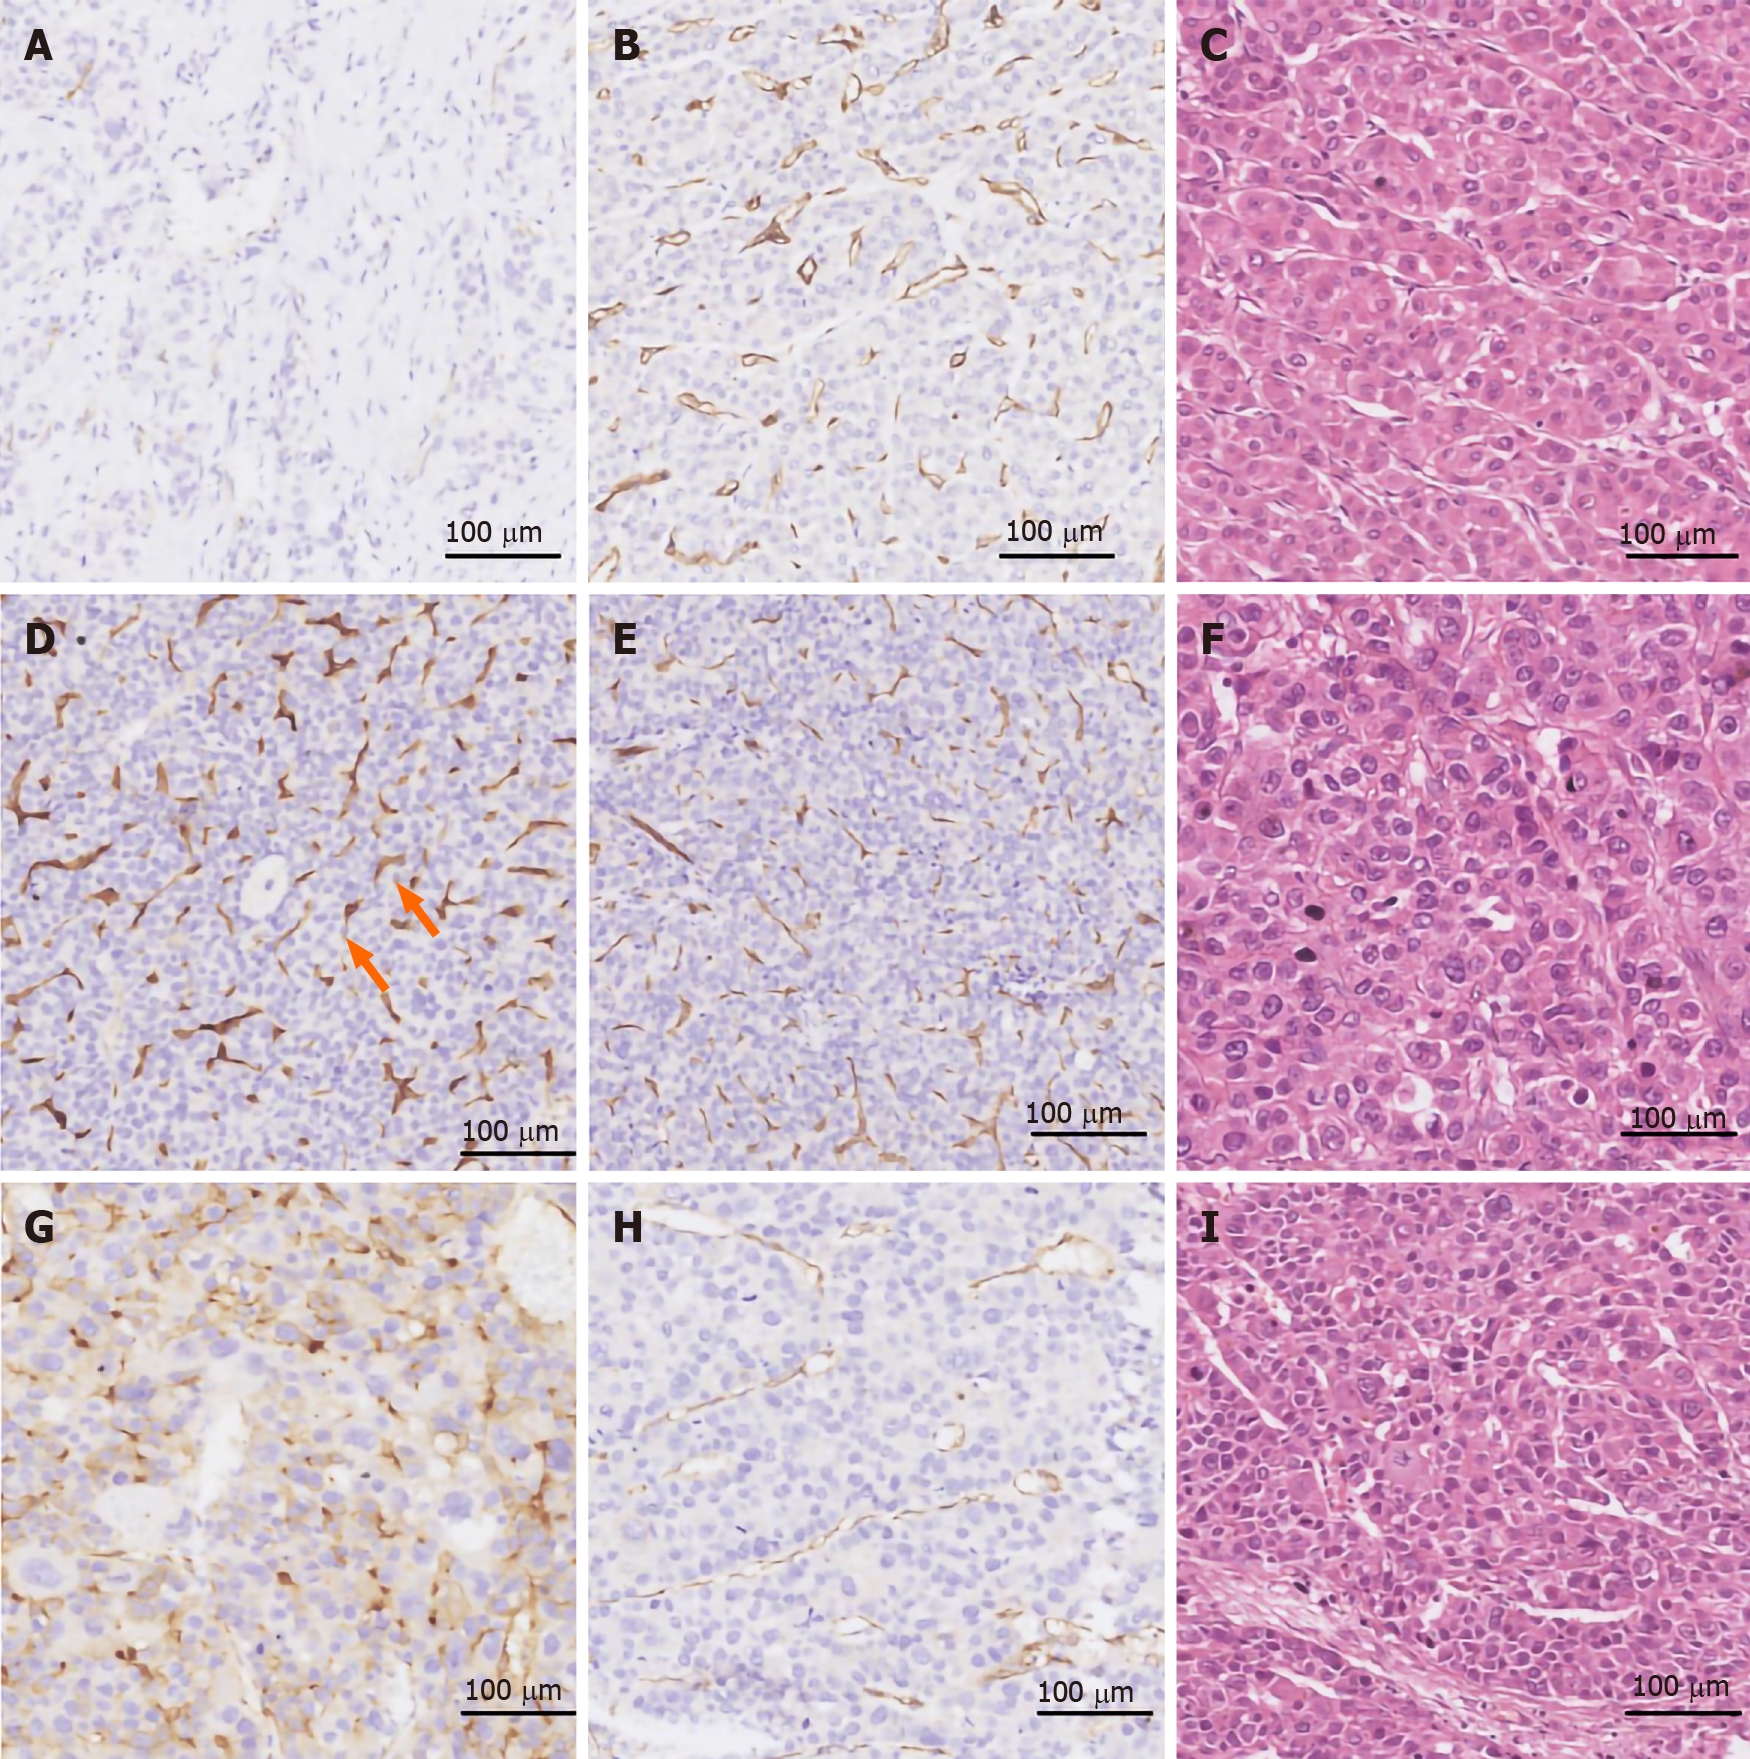
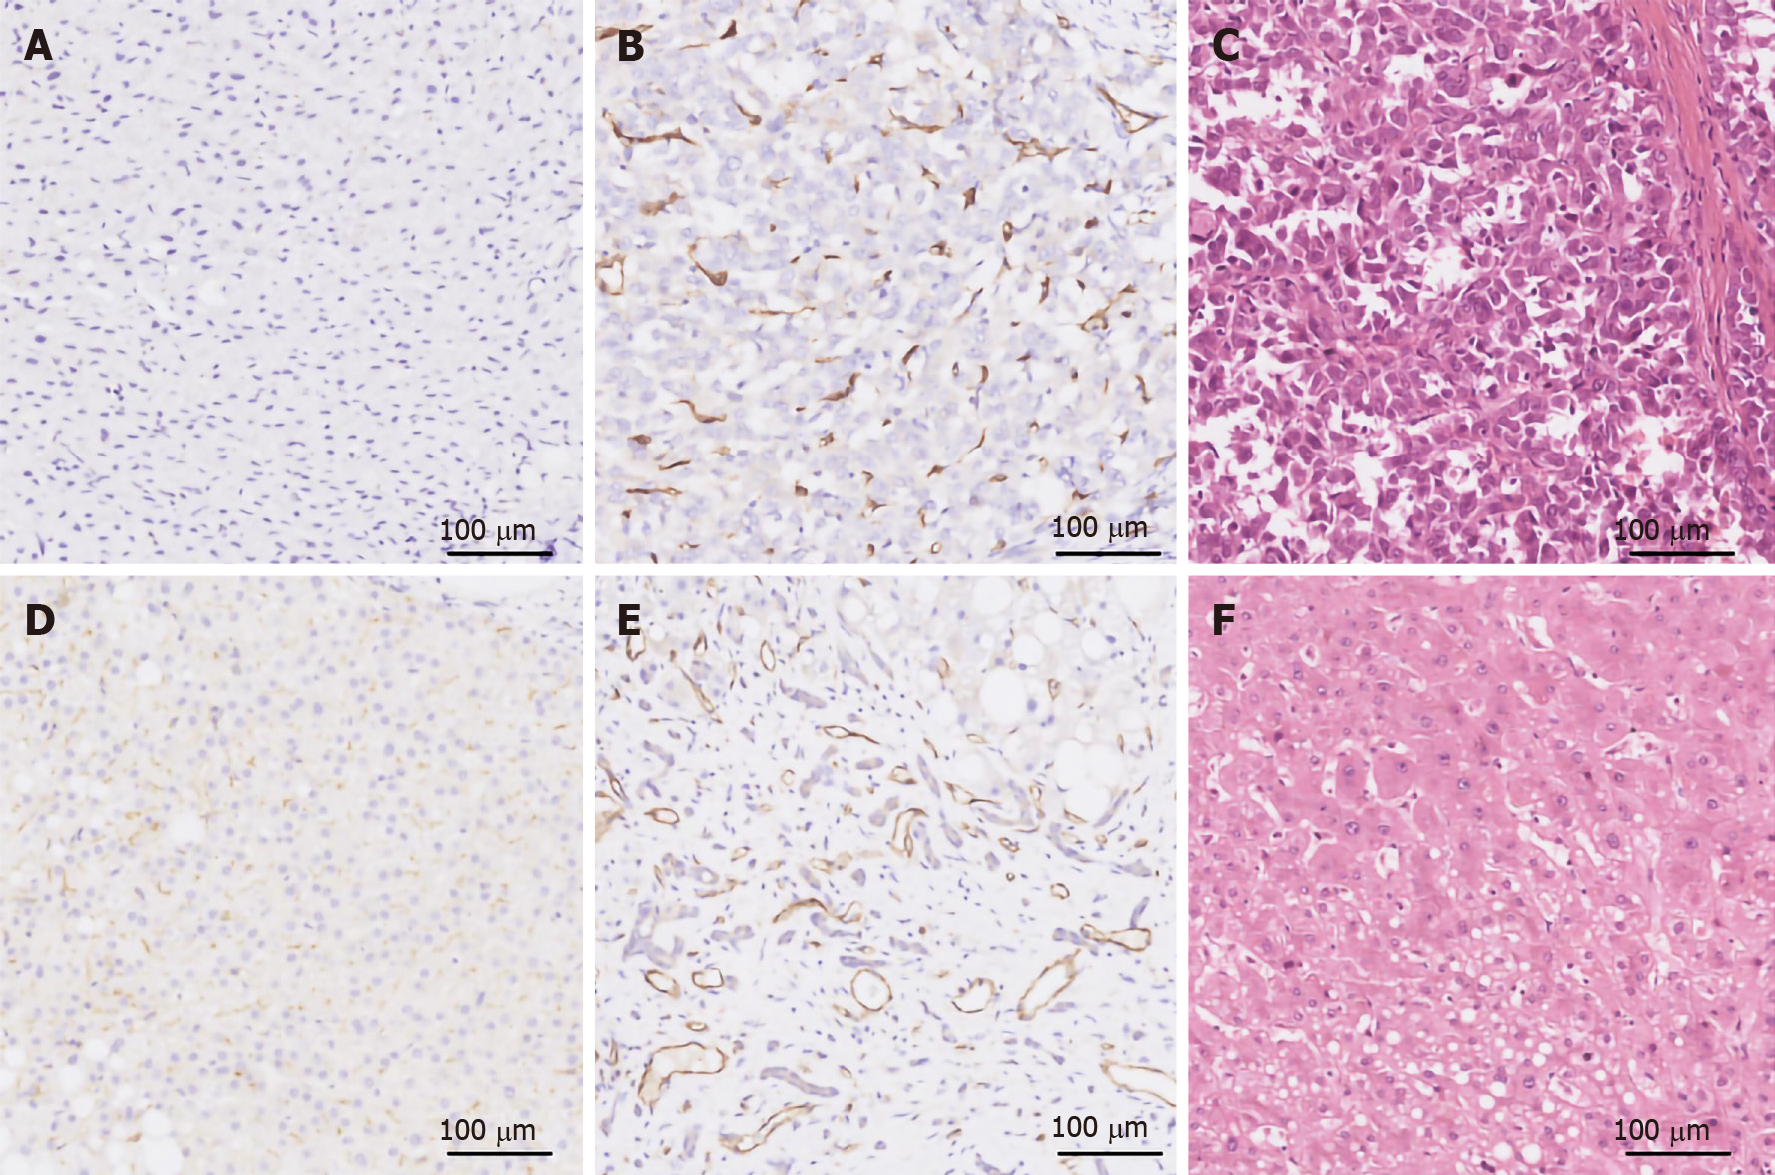
Figure 3 Prostate-specific membrane antigen staining in representative tissues samples of hepatocellular carcinoma with magnification of 400 ×, scale bar = 100 μm.
A: Weak prostate-specific membrane antigen (PSMA) staining (score = 1); B, E and H: The corresponding CD31 staining; C, F and I: The corresponding hematoxylin and eosin staining; D: Strong staining (score = 3); D and E: Vessel-like structures within the tumor (bold orange arrow) showed only PSMA staining but no CD31, D and E were from adjacent slides; G: Blood vessel staining and weak staining of cellular elements (score = 3).
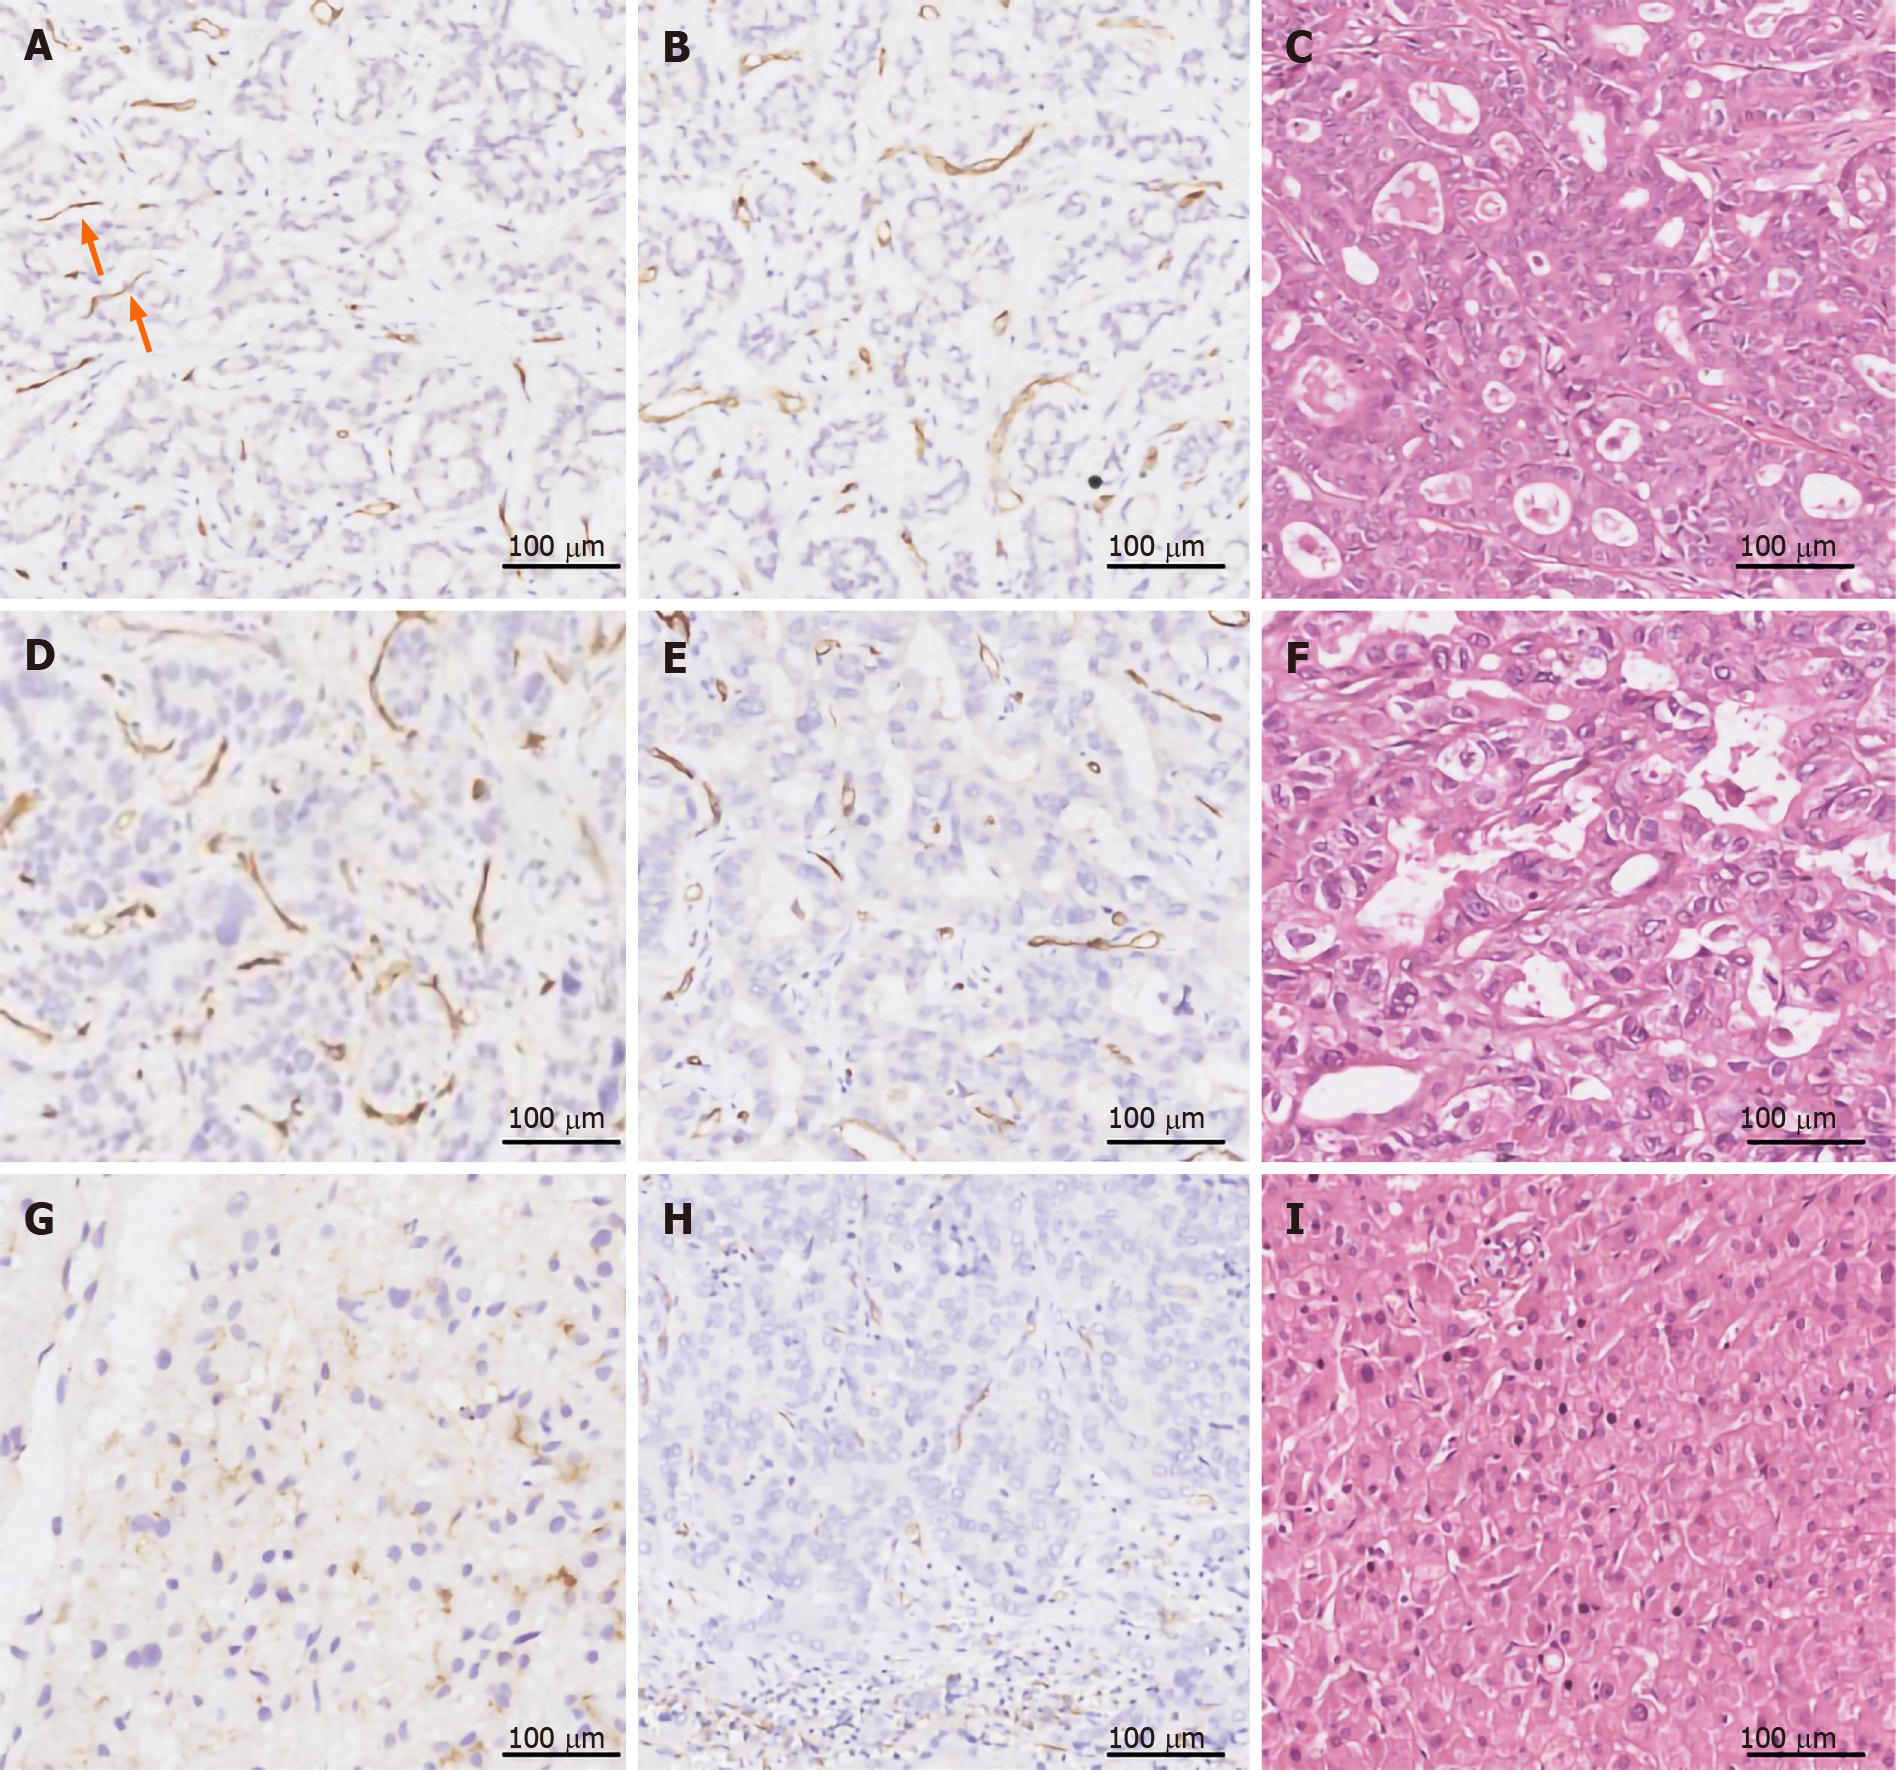
Figure 4 Prostate-specific membrane antigen staining in representative tissues samples of cholangiocarcinoma with magnification of 400 ×, scale bar = 100 μm.
A: Weak prostate-specific membrane antigen (PSMA) staining (score = 1); A and B: Vessel-like structures within the tumor (bold orange arrow) showed staining exclusively for PSMA with no CD31 staining, A and B were from adjacent slides; B, E and H: The corresponding CD31 staining; C, F, and I: The corresponding hematoxylin and eosin staining; D: Strong staining (score = 3); G: Blood vessel staining and weak staining of cellular elements (score = 1).
Figure 5 Prostate-specific membrane antigen staining in liver cirrhosis with magnification of 400 ×, scale bar = 100 μm.
A: Liver cirrhosis showing no prostate-specific membrane antigen (PSMA) staining in blood vessels and hepatocytes (0 point); B and E: The corresponding CD31 staining; C and F: The corresponding hematoxylin and eosin staining; D: Liver cirrhosis showing no PSMA blood vessel staining with a score of 0 and light staining of cellular elements with a score of 1.
- Citation: Chen LX, Zou SJ, Li D, Zhou JY, Cheng ZT, Zhao J, Zhu YL, Kuang D, Zhu XH. Prostate-specific membrane antigen expression in hepatocellular carcinoma, cholangiocarcinoma, and liver cirrhosis. World J Gastroenterol 2020; 26(48): 7664-7678
- URL: https://www.wjgnet.com/1007-9327/full/v26/i48/7664.htm
- DOI: https://dx.doi.org/10.3748/wjg.v26.i48.7664


